
Analyzing your prompt, please hold on...
An error occurred while retrieving the results. Please refresh the page and try again.
To render a Chart.js or Highcharts chart to PDF in C#, load the chart page into an
HTMLDocument and convert the rendered document with
Converter.ConvertHTML() or a
PdfDevice and RenderTo(). Make the chart library available during document loading, define stable chart dimensions, and disable animation for predictable PDF output.
Chart.js draws charts on an HTML <canvas>, while
Highcharts primarily generates SVG inside an HTML container. Aspose.HTML for .NET executes the page’s JavaScript while loading the document and then renders either result to PDF or another supported format.
This article demonstrates two alternative HTML-to-PDF APIs. The Chart.js example uses RenderTo() with a PDF rendering device, and the Highcharts example uses Converter.ConvertHTML(). This choice is only for demonstration: either conversion workflow can be used with either chart library.
Chart.js and Highcharts are third-party libraries and are not included with Aspose.HTML for .NET. Use each library according to its licensing terms; in particular, Highcharts may require a commercial license for production use.
The Chart.js example uses fixed canvas dimensions, disables responsive resizing and animation, and creates the chart from inline data. These settings help the chart reach a stable final state before PDF rendering.
To render a Chart.js chart to PDF:
<canvas> element with explicit width and height.HTMLDocument object.PdfDevice for the output and call RenderTo() to render the document.The following C# example loads the Chart.js source file and renders the generated canvas chart to PDF:
 1// Prepare paths to the source HTML and output PDF files
 2string documentPath = Path.Combine(DataDir, "chartjs-bar.html");
 3string savePath = Path.Combine(OutputDir, "chartjs-bar.pdf");
 4
 5// Load the HTML document containing the Chart.js canvas chart
 6using HTMLDocument document = new HTMLDocument(documentPath);
 7
 8// Create a PDF rendering device for the output file
 9using PdfDevice device = new PdfDevice(savePath);
10
11// Render the JavaScript-generated chart to PDF
12document.RenderTo(device);
The source HTML sets the intrinsic canvas dimensions and loads a fixed Chart.js version:
1<canvas id="salesChart"
2        width="600"
3        height="350"
4        style="display: block;"></canvas>
5
6<script src="https://cdn.jsdelivr.net/npm/chart.js@4.5.1/dist/chart.umd.min.js"></script>
The chart configuration disables responsive resizing and animation:
1options: {
2    responsive: false,
3    animation: false,
4    plugins: {
5        legend: {
6            display: true
7        }
8    }
9}
Note: A CDN-based example requires network access while the HTML document is loading. For offline or controlled environments, store the tested Chart.js file locally and reference it with a relative URL.
The Highcharts example loads the library from a local JavaScript file, gives the chart container fixed dimensions, and disables chart and series animation.
To render a Highcharts chart to PDF:
HTMLDocument object.PdfSaveOptions and call Converter.ConvertHTML() to save the rendered document as PDF.The
Highcharts HTML source file is provided as source code, not as a live preview. It references a local highcharts.js file used by the sample project, so the chart is not displayed when the HTML file is opened directly from the documentation site. Place highcharts.js in the same directory before opening or converting the file:
1<script src="highcharts.js"></script>The chart container has fixed dimensions:
1<div id="container" style="width: 800px; height: 400px; margin: 0 auto;"></div>Both the general chart animation and the initial series animation are disabled:
1chart: {
2    type: 'bar',
3    animation: false
4},
5plotOptions: {
6    series: {
7        animation: false
8    }
9}
The following C# example converts the JavaScript-generated Highcharts chart to PDF:
 1// Prepare paths to the source HTML and output PDF files
 2string documentPath = Path.Combine(DataDir, "highcharts-bar.html");
 3string savePath = Path.Combine(OutputDir, "highcharts-bar.pdf");
 4
 5// Load the HTML document containing the Highcharts chart
 6using HTMLDocument document = new HTMLDocument(documentPath);
 7
 8// Initialize PDF save options
 9PdfSaveOptions options = new PdfSaveOptions();
10
11// Convert the JavaScript-generated chart to PDF
12Converter.ConvertHTML(document, options, savePath);
The relative highcharts.js URL is resolved against the HTML document location. Keep the library next to the HTML file in the application data directory, or change the script URL to match the actual project structure.
The following illustration compares the PDF output produced by the two examples. The Chart.js chart on the left is drawn on an HTML canvas, while the Highcharts chart on the right is generated primarily as SVG before both are rendered to PDF with Aspose.HTML for .NET.
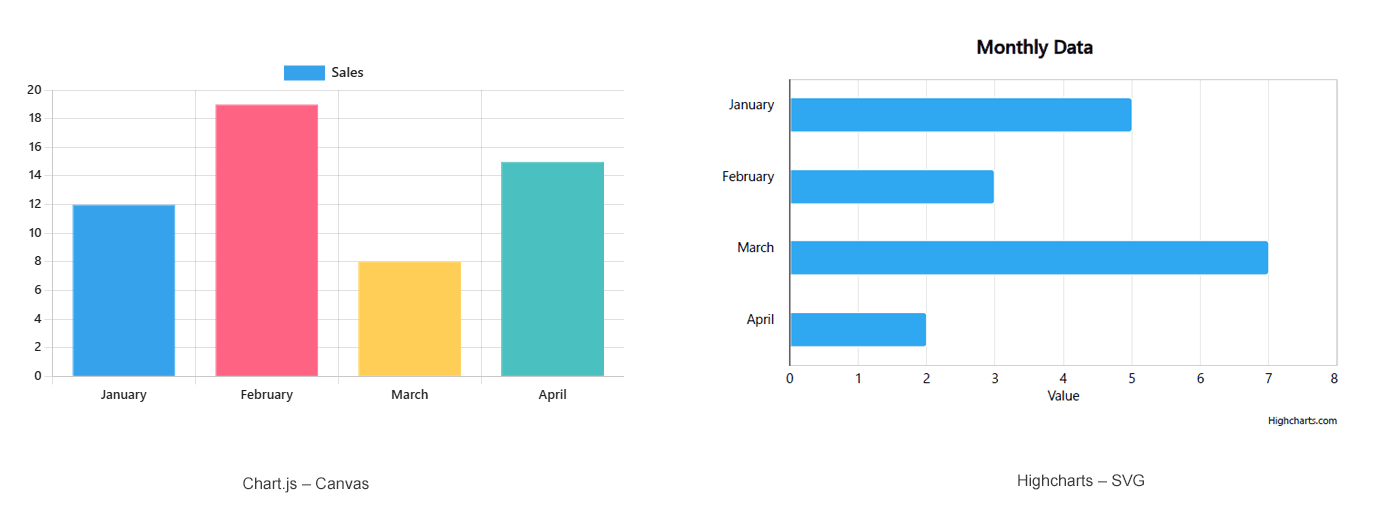
Both examples perform HTML-to-PDF rendering after the JavaScript chart has been created. The API choice does not depend on whether the library uses canvas or SVG.
| Workflow | When to use it |
|---|---|
Converter.ConvertHTML() with PdfSaveOptions | Use the high-level conversion API for a concise HTML-to-PDF workflow and conversion-specific save options. |
RenderTo() with PdfDevice | Use a rendering device when the application needs direct control over the rendering pipeline and device options. |
Chart.js and Highcharts require different quality controls because they generate different types of graphics.
Chart.js draws raster content on a <canvas>:
width and height determine how many pixels the chart contains.devicePixelRatio option can increase pixel density but should be tested with the selected fixed dimensions.Highcharts primarily generates vector SVG:
Use
PdfSaveOptions to configure the PDF page, margins, and JPEG compression. These settings control the PDF output rather than the native detail of the chart. For example, replace the default options initialization in the Converter.ConvertHTML() workflow with the following settings:
1// Configure PDF page layout and JPEG compression
2PdfSaveOptions options = new PdfSaveOptions
3{
4    JpegQuality = 100
5};
6
7options.PageSetup.AnyPage = new Page(
8    new Size(900, 500),
9    new Margin(30, 30, 30, 30));
PageSetup.AnyPage sets the PDF page size and margins; the numeric values in this example are pixels. JpegQuality reduces compression loss only when JPEG compression is used. It does not increase Canvas resolution or affect SVG quality.
For the RenderTo() workflow, configure page setup, JPEG compression, and other required rendering settings through PdfRenderingOptions, and pass the options to the PdfDevice constructor. See
Rendering Options for all available settings,
Resize HTML Output for page sizing strategies, and
Fine-Tuning Converters for the differences between conversion and rendering APIs.
For stable and repeatable PDF output:
| Issue | Possible cause and solution |
|---|---|
| The PDF contains an empty chart area | Verify that the chart library URL is accessible and that the relative path to a local script is correct. |
| The chart is incomplete | Disable animation and make sure the data is available when the chart is initialized. |
| The chart has an unexpected size | Set explicit canvas or container dimensions and configure the PDF page size if the chart is clipped. |
| The CDN example works locally but fails on a server | Check network access in the server environment or replace the CDN dependency with a local library file. |
Yes. Converter.ConvertHTML() and RenderTo() with PdfDevice both process the rendered HTML document. The examples use different APIs to demonstrate the available approaches, not because Chart.js and Highcharts require different conversion methods.
Yes. Aspose.HTML for .NET loads the HTML document, executes its JavaScript, and renders the resulting chart programmatically. The conversion runs in the .NET application and does not require opening Chrome, Edge, or another web browser.
Chart.js draws the chart as raster pixels on a canvas, while Highcharts primarily generates vector SVG. For a sharper Chart.js result, increase the intrinsic canvas width and height or test a higher Chart.js devicePixelRatio before conversion. Increasing the PDF page size or JPEG quality cannot add detail that is missing from the source canvas.
Yes. After Chart.js or Highcharts creates the chart in the HTML document, Aspose.HTML can render the resulting canvas or SVG content to other supported formats, including XPS, DOCX, PNG, JPEG, BMP, GIF, and TIFF. Use the corresponding save options with Converter.ConvertHTML() or the appropriate rendering device for the required output format.
Converter.ConvertHTML() and PDF save options.
Analyzing your prompt, please hold on...
An error occurred while retrieving the results. Please refresh the page and try again.