Customize Data Points in Treemap and Sunburst Charts in .NET
Overview
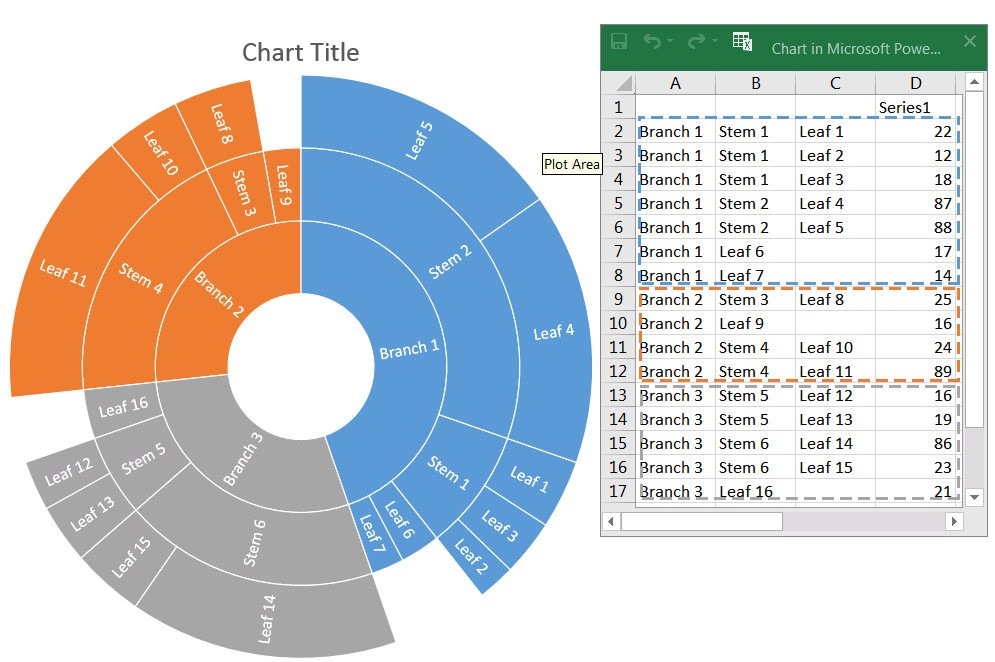
Treemap and Sunburst charts display the same kind of hierarchical data, but they use different layouts. A Treemap draws the hierarchy as nested rectangles whose areas represent leaf values. A Sunburst draws it as concentric rings: top-level groups are near the center, and leaf categories are on the outer ring.
In Aspose.Slides for .NET, each numeric value is an IChartDataPoint. Its IChartDataPoint.DataPointLevels collection provides access to the leaf and its parent groups. This article explains that mapping and shows how to create and format both chart types from the same sample data.


Understand Categories, Data Points, and Levels
The sample used below has three category levels and one numeric series:
| Branch | Stem | Leaf | Revenue |
|---|---|---|---|
| Consumer | Computers | Laptops | 12 |
| Consumer | Computers | Desktops | 8 |
| Consumer | Mobile | Phones | 15 |
| Consumer | Mobile | Tablets | 6 |
| Business | Services | Consulting | 10 |
| Business | Services | Support | 7 |
| Business | Software | Licenses | 11 |
| Business | Software | Subscriptions | 14 |
Each row creates one leaf category and one data point. The category grouping levels describe the path from that leaf to its parents. For the first row, the path is Consumer > Computers > Laptops.
The indexes in IChartDataPoint.DataPointLevels run from the leaf upward:
DataPointLevels index |
Logical level | Treemap representation | Sunburst representation |
|---|---|---|---|
0 |
Leaf | Value rectangle | Outer-ring segment |
1 |
Stem | Parent rectangle or header | Middle-ring segment |
2 |
Branch | Top-level rectangle or header | Inner-ring segment |
This order is the same for both chart types even though their visual layouts differ. A parent segment is shared by several leaves. To format it, use the corresponding level of the first data point in that group. For example, the Consumer branch starts with the Laptops point, while the Software stem starts with the Licenses point. Keeping references to those points is clearer and safer than using unexplained expressions such as dataPoints[0] or dataPoints[6].
Create and Customize Both Chart Types
The following complete example creates a Treemap on the first slide and a Sunburst on the second slide. It builds the hierarchy, displays the value for Tablets, applies fixed colors to selected levels, formats a branch label, and saves the presentation.
using System.Drawing;
using Aspose.Slides;
using Aspose.Slides.Charts;
using Aspose.Slides.Export;
using var presentation = new Presentation();
var treemapSlide = presentation.Slides[0];
AddHierarchyChart(treemapSlide, ChartType.Treemap);
var layoutSlide = presentation.LayoutSlides[0];
var sunburstSlide = presentation.Slides.AddEmptySlide(layoutSlide);
AddHierarchyChart(sunburstSlide, ChartType.Sunburst);
presentation.Save("hierarchical-charts.pptx", SaveFormat.Pptx);
static void AddHierarchyChart(ISlide slide, ChartType chartType)
{
const int worksheetIndex = 0;
const int leafLevelIndex = 0;
const int stemLevelIndex = 1;
const int branchLevelIndex = 2;
var chart = slide.Shapes.AddChart(chartType, 40, 40, 640, 440);
chart.HasTitle = false;
chart.HasLegend = false;
chart.ChartData.Categories.Clear();
chart.ChartData.Series.Clear();
var workbook = chart.ChartData.ChartDataWorkbook;
workbook.Clear(worksheetIndex);
// Add the leaf categories. A grouping item is set only when a new group begins;
// the following categories remain in that group until another item is set.
var laptopsCategory = AddCategory(1, "Laptops");
laptopsCategory.GroupingLevels.SetGroupingItem(stemLevelIndex, "Computers");
laptopsCategory.GroupingLevels.SetGroupingItem(branchLevelIndex, "Consumer");
AddCategory(2, "Desktops");
var phonesCategory = AddCategory(3, "Phones");
phonesCategory.GroupingLevels.SetGroupingItem(stemLevelIndex, "Mobile");
AddCategory(4, "Tablets");
var consultingCategory = AddCategory(5, "Consulting");
consultingCategory.GroupingLevels.SetGroupingItem(stemLevelIndex, "Services");
consultingCategory.GroupingLevels.SetGroupingItem(branchLevelIndex, "Business");
AddCategory(6, "Support");
var licensesCategory = AddCategory(7, "Licenses");
licensesCategory.GroupingLevels.SetGroupingItem(stemLevelIndex, "Software");
AddCategory(8, "Subscriptions");
var seriesNameCell = workbook.GetCell(worksheetIndex, 0, 3, "Revenue");
var series = chart.ChartData.Series.Add(seriesNameCell, chartType);
series.Labels.DefaultDataLabelFormat.ShowCategoryName = true;
var laptopsDataPoint = AddDataPoint(1, 12);
AddDataPoint(2, 8);
AddDataPoint(3, 15);
var tabletsDataPoint = AddDataPoint(4, 6);
AddDataPoint(5, 10);
AddDataPoint(6, 7);
var licensesDataPoint = AddDataPoint(7, 11);
AddDataPoint(8, 14);
// Show the category and value on the Tablets leaf.
var tabletsLabelFormat = tabletsDataPoint.DataPointLevels[leafLevelIndex]
.Label.DataLabelFormat;
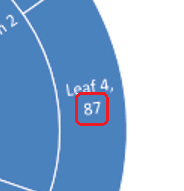
tabletsLabelFormat.ShowCategoryName = true;
tabletsLabelFormat.ShowValue = true;
tabletsLabelFormat.Separator = "\n";
tabletsLabelFormat.NumberFormat = "$0";
// Format the Consumer branch through the first leaf in that branch.
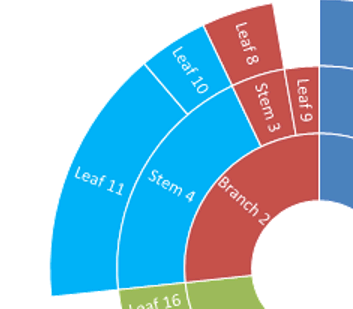
var consumerBranchLevel = laptopsDataPoint.DataPointLevels[branchLevelIndex];
var consumerBranchFill = consumerBranchLevel.Format.Fill;
var consumerBranchColor = Color.FromArgb(31, 78, 121);
SetSolidFill(consumerBranchFill, consumerBranchColor);
var consumerLabelFormat = consumerBranchLevel.Label.DataLabelFormat;
consumerLabelFormat.ShowCategoryName = true;
consumerLabelFormat.ShowSeriesName = false;
var consumerLabelTextFill = consumerLabelFormat.TextFormat.PortionFormat.FillFormat;
SetSolidFill(consumerLabelTextFill, Color.White);
// Format the Software stem through the first leaf in that stem.
var softwareStemLevel = licensesDataPoint.DataPointLevels[stemLevelIndex];
var softwareStemFill = softwareStemLevel.Format.Fill;
var softwareStemColor = Color.FromArgb(112, 173, 71);
SetSolidFill(softwareStemFill, softwareStemColor);
// ParentLabelLayout affects Treemap parent labels; Sunburst uses ring segments.
if (chartType == ChartType.Treemap)
{
series.ParentLabelLayout = ParentLabelLayoutType.Overlapping;
}
IChartCategory AddCategory(int rowIndex, string leafName)
{
var categoryCell = workbook.GetCell(worksheetIndex, rowIndex, 2, leafName);
return chart.ChartData.Categories.Add(categoryCell);
}
IChartDataPoint AddDataPoint(int rowIndex, double value)
{
var valueCell = workbook.GetCell(worksheetIndex, rowIndex, 3, value);
if (chartType == ChartType.Treemap)
{
return series.DataPoints.AddDataPointForTreemapSeries(valueCell);
}
return series.DataPoints.AddDataPointForSunburstSeries(valueCell);
}
static void SetSolidFill(IFillFormat fillFormat, Color color)
{
fillFormat.FillType = FillType.Solid;
fillFormat.SolidFillColor.Color = color;
}
}
The category cells and value cells use the same worksheet row, so their collection positions remain aligned. When you work with an existing chart rather than creating one, inspect the category rows first and store named references to the data points and levels you intend to format.
Behavior and Practical Considerations
Treemap and Sunburst Differences
- A Treemap uses area to communicate value and nested rectangles to communicate hierarchy. The IChartSeries.ParentLabelLayout property controls how parent labels appear in this chart type.
- A Sunburst uses angle to communicate value and ring depth to communicate hierarchy. IChartSeries.ParentLabelLayout does not control its ring labels.
- Both chart types use the same category grouping levels and the same leaf-to-parent order in
DataPointLevels, so the data-building and level-formatting code can be shared. - Parent values are calculated from their descendant leaves. Do not add separate numeric points for branches or stems.
Sorting and Segment Order
The chart layout engine determines the final placement of rectangles and ring segments. Arrange related category rows together before adding them, but do not rely on a specific rectangle position or start angle. If sequence carries meaning, include it in the labels or use a chart type with an explicit category axis.
Theme and Fixed Colors
Unformatted chart levels inherit colors from the presentation theme. The example uses explicit RGB fills for predictable output. If the chart should follow theme changes, use scheme colors instead of fixed RGB values and avoid overriding every level. Also check label contrast after changing a branch or stem fill.
Labels and Available Space
PowerPoint may hide or truncate labels when a segment is too small. Increasing the chart size, shortening category names, or showing fewer label fields usually produces a clearer result. A label can combine the category name, series name, and value through IDataLabelFormat, but enabling every field often makes hierarchical charts difficult to read.
Export and Rendering
Saving to PPTX keeps the chart editable. When Aspose.Slides renders the presentation to PDF or an image, the supported fills and label settings are rendered with the chart. Font substitution and small differences in available layout space can change line wrapping or label visibility, so install the required fonts and verify important export targets.
FAQ
Why does changing a parent level affect several leaves?
A branch or stem is a shared visual segment. Its IChartDataPointLevel can be reached through a descendant leaf, but the formatting belongs to the shared parent segment rather than only to that leaf.
Why is a data label missing?
First enable the required fields on the label’s IDataLabelFormat object. Then check whether the segment has enough space. Treemap parent-label layout, chart dimensions, label length, font size, and the number of enabled fields all affect whether a label can be displayed.
Can I set the exact order or coordinates of segments?
You can control the source-row order and keep each group contiguous, but you cannot assign exact Treemap rectangles or Sunburst angles. The chart layout engine calculates them from the hierarchy, values, and available space.
Why do colors change after the presentation theme changes?
Theme-based fills are designed to follow the presentation palette. Apply explicit RGB colors to the levels that must remain fixed, or keep scheme colors when adapting to a new theme is preferred.
Will custom formatting be preserved in PDF and image exports?
Yes, supported chart fills and label settings are included during rendering. For consistent results across systems, make the required fonts available and test the final export size because label fitting is layout-dependent.