SVG Shapes | Basics & SVG Code, Examples
The simple shapes are used continuously in vector drawings – in logos, diagrams, etc. To include the figure into the picture, you need to create an element in an SVG file. The element’s attributes will indicate the position, size, and other figure’s characteristics. A wide range of visual properties can be applied to the shapes: coloration, opacity, corner rounding, stroke and more. How to insert the figure in the SVG document and edit it using the Aspose.SVG API you can learn in the section Edit SVG File.
SVG Rectangle
The <rect> element is applied to create an SVG rectangle and variations of rectangle figures. There are six attributes determine the rectangle’s shape and position on the screen:
x, y – the x, y coordinates of the rectangle’s top-left corner
width, height – the width and height of the rectangle
rx, ry – the x and y radii of the rectangle’s corners
If x and y attributes are not set, the top-left corner of the rectangle is placed at the point (0,0). If rx and ry radii are not specified, they default to 0. You can fill the rectangle with a color, make the filling transparent, and style the stroke using the style attribute properties (see Fills and Strokes in SVG).
The SVG code to generate the SVG rectangle looks like ( rectangle1.svg):
1<svg width="500" height="550" xmlns="http://www.w3.org/2000/svg">
2    <rect x="60" y="100" width="70" height="40" rx="10" ry="10" style="fill:#778899; stroke:#FF4500; stroke-width:5; fill-opacity:0.7; stroke-opacity:0.6" />
3</svg>
The code example shows that you create an SVG rectangle with the top-left point at coordinates (60,100), the width="70", and the height="40". It has rounded edges and the stroke-width:5. All units are in pixels.
Below is one more sample code for creating a rectangle without rounded borders (
rectangle2.svg):
1<svg width="500" height="550" xmlns="http://www.w3.org/2000/svg">
2    <rect x="120" y="140" width="90" height="90" style="fill:grey; stroke-width:3; stroke:rgb(0,0,0)" />
3</svg>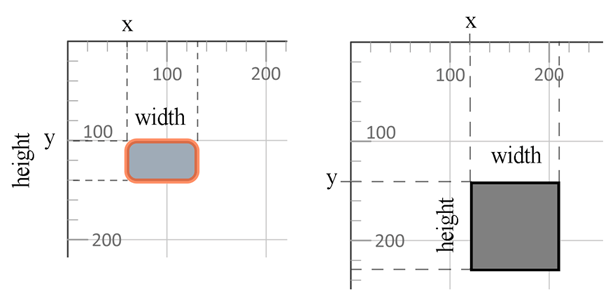
The following properties of the style attribute are used:
fill – defines the fill color of the rectangle
fill-opacity – determines the transparent of the rectangle
stroke-width – determines the width of the stroke
stroke – determines the color of the stroke
stroke-opacity – determines the transparent of the stroke
In the CSS fill and stroke properties the color can be set in several ways:
fill:blue– color is taken from CSS color names. All modern browsers support the 140+ color names.fill:rgb(0,0,255)– color is written in RGB color model (rgb values).fill:#0000ff– color is written in RGB color model (hex rgb values).
RGB (red, green, blue) is an additive color model that describes how any color is encoded using three basic ones. The values r, g and b are the intensity (in the range from 0 to 255), respectively, of the red, green and blue components of the determined color. That is, a bright blue color can be defined as (0,0,255), red as (255,0,0), bright green – (0,255,0), black – (0,0,0), and white – (255,255,255).
SVG Circle
The SVG <circle> element is used to draw a circle on the screen. You need to set the position of the SVG circle’s center and radius. These are cx, cy, and r attributes, respectively.
You can set the stroke and fill properties for an SVG circle. In the following example, the stroke color is black, and the fill color is red. You can also set the stroke width using the stroke-width style property and fill transparency using the fill-opacity property. Here is an example ( circle.svg):
1<svg width="300" height="550" xmlns="http://www.w3.org/2000/svg">
2    <circle cx="250" cy="100" r="60" style="fill:red; stroke-width:3; stroke:rgb(0,0,0); fill-opacity:0.7" />
3</svg>
In the example, the circle image does not entirely fit into the viewport. The viewport’s width is 300, i.e. on the x-axis, it is cropped by 300 pixels distance. And for the full SVG circle viewing, 310-pixel wide window is needed (cx+r=250+60=310). To make the circle fully visible, you need to increase the width of the viewport until 310.
SVG Ellipse
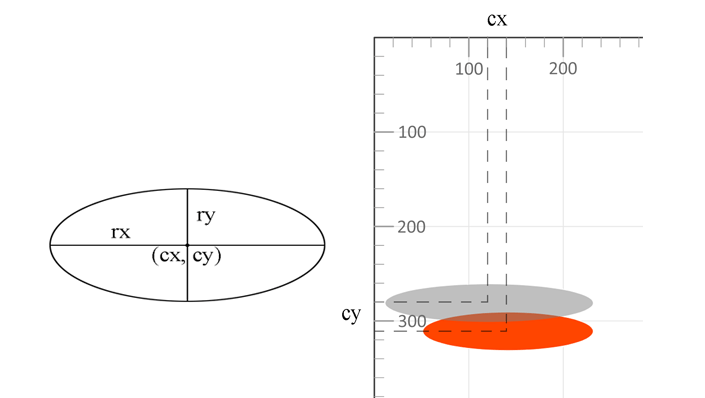
An ellipse is a more general figure than a circle. In the context of an <ellipse> element creating, the values of a semi-major axis rx, a semi-minor axis ry, and the coordinates of their intercrossing point (cx, cy) are indicated. These characteristics are attributes:
rx, ry – the x and y radii of the ellipse (semi-major axis and semi-minor axis)
cx, cy – the x and y coordinates of the center of the ellipse
1<svg width="500" height="550" xmlns="http://www.w3.org/2000/svg">
2    <ellipse cx="140" cy="310" rx="90" ry="20" style="fill:OrangeRed" />
3    <ellipse cx="120" cy="280" rx="110" ry="20" style="fill:grey; fill-opacity:0.5" />
4</svg>
The second SVG ellipse in the code has transparency 50% and will be displayed over the first. A rule about the order of the SVG elements showing is: the later elements in the code are displayed on top of the previous ones ( ellipse.svg).
SVG Line
In order to the SVG line draw, the <line> tag is used, which can have the following attributes:
x1, y1 – the x, y coordinates of the origin point
x2, y2 – the x, y coordinates of the end point
stroke-width – the line width
stroke – the line color
1<svg width="500" height="550" xmlns="http://www.w3.org/2000/svg">
2    <line x1="30" y1="30" x2="350" y2="290" style="stroke:rgb(255,0,0); stroke-width:3" />
3    <line x1="30" y1="50" x2="300" y2="350" style="stroke:grey; stroke-width:5" />
4    <line x1="20" y1="80" x2="100" y2="200" style="stroke:orangered; stroke-width:8" />
5</svg>
Here is the rendered SVG image ( line.svg):
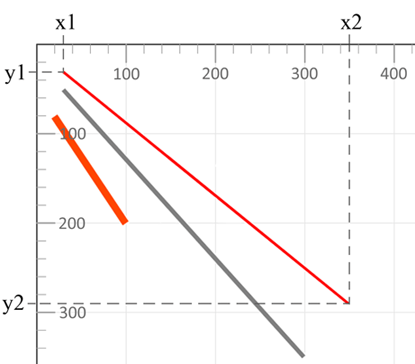
The code example describes three SVG lines of different colors and different widths. The style attribute properties stroke and stroke-width set the color and thickness of the SVG line.
SVG Polyline
The SVG <polyline> element is used to draw multiple connected straight lines. As a rule, polylines are open forms, the beginning of the first and the end of the last line do not match. The points attribute specifies the x, y coordinates of the points at which the polyline bends.
The first group of two numbers in the points defines the coordinates of the beginning of the first line, the second group defines the end of the first line and at the same time the beginning of the second line, etc ( polyline.svg).
1<svg width="500" height="550" xmlns="http://www.w3.org/2000/svg">
2    <polyline points="280,290 300,220 320,290" style="fill:grey; stroke:grey; stroke-width:2; fill-opacity:0.5" />
3    <polyline points="220,200 240,180 260,200 280,180 300,200 320,180 340,200" style="fill:none; stroke:red; stroke-width:6" />
4</svg>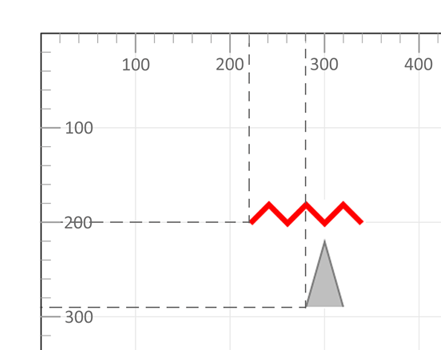
In the first SVG polyline example, there are 3 points that define a triangle. The space between the points will be filled with the fill property. In the example, the fill color is grey: style="fill:grey". The default fill color is black. In the second example, seven points are connected by the SVG red polyline with the stroke-width:6 and the fill:none.
For more information on style attributes’ properties, please see the article Fills and Strokes in SVG. Full information is on the W3C page.
SVG Polygon
A polygon is a plane geometric shape formed by a closed polyline. If the polyline does not have self-crossing points, the polygon is simple. For example, triangles and squares are simple polygons, but a five-pointed star is not.
The <polygon> element is used to create a shape that contains at least three sides. The attribute points defines the coordinates (x, y) for each corner of the SVG polygon.
An example of a simple SVG polygon building ( polygon.svg):
1<svg width="500" height="550" xmlns="http://www.w3.org/2000/svg">
2    <polygon points="160,10 350,140 210,350 50,199" style="fill:orange;stroke:purple;stroke-width:1" />
3</svg>
SVG Basic Shapes
A simple SVG document consists of nothing more than the <svg> root element and several basic shapes that build a graphic together (
conclusion.svg).
 1<svg width="500" height="550" xmlns="http://www.w3.org/2000/svg">
 2    <line x1="30" y1="30" x2="350" y2="290" style="stroke:rgb(255,0,0); stroke-width:3" />
 3    <line x1="30" y1="50" x2="300" y2="350" style="stroke:grey; stroke-width:5" />
 4    <rect x="60" y="100" width="70" height="40" rx="10" ry="10" style="fill:#778899; stroke:#FF4500; stroke- width:5; fill-opacity:0.7; stroke-opacity:0.6" />
 5    <polygon points="160,10 350,140 210,350 50,199" style="fill:orange; stroke:purple; stroke-width:1; fill-opacity:1" />
 6    <rect x="120" y="150" width="90" height="90" style="fill:grey; stroke-width:3; stroke:rgb(0,0,0)" />
 7    <circle cx="250" cy="100" r="60" stroke="black" stroke-width="3" fill="red" fill-opacity="0.7" />
 8    <ellipse cx="140" cy="310" rx="90" ry="20" style="fill:OrangeRed" />
 9    <ellipse cx="120" cy="280" rx="110" ry="20" style="fill:grey; fill-opacity:0.5" />
10    <polyline points="220,200 240,180 260,200 280,180 300,200 320,180 340,200" style="fill:none; stroke:red; stroke-width:6" />
11    <line x1="20" y1="80" x2="100" y2="200" style="stroke:orangered; stroke-width:8" />
12    <polyline points="280,290 300,220 320,290" style="fill:grey; stroke:grey; stroke-width:2; fill-opacity:0.5" />
13</svg>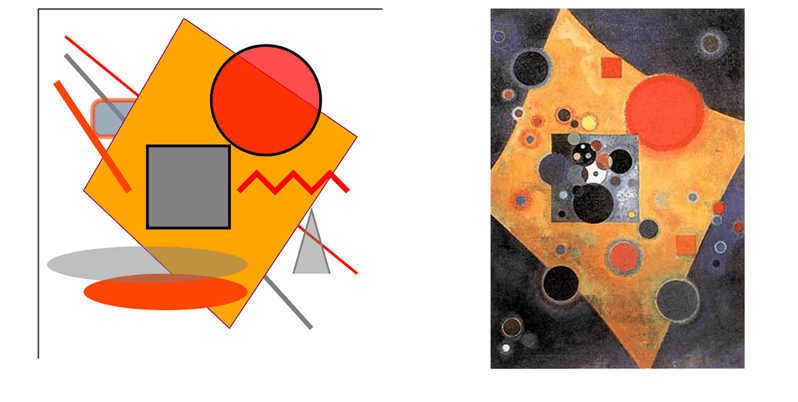
This simple picture “SVG Basic Shapes” contains all the figures described above. Nearby is the famous painting “Pink Accent” by Wassily Kandinsky. The basic knowledge of SVG markup allows you to draw a simple image in a text editor, although more complex ideas are not done that way.
In the Element Builders – Create and Edit SVG Elements article, you will learn how to create and edit SVG elements, including SVG shapes in C# using the Aspose.SVG Builder API. You will also see how SVG Builder is effective and how it simplifies SVG programming.
If you have an image that is not an SVG like a JPG or PNG file, you can convert the file into a vector and save it as an SVG using a free online Image Vectorizer. The App is browser-based and works on any platform. Check our Image Vectorizer to get all the benefits of vector graphics!