
Analyzing your prompt, please hold on...
An error occurred while retrieving the results. Please refresh the page and try again.
Quick Answer: To control SVG coordinates in Python, load or create an
SVGDocument and set width, height, and viewBox on the root SVG element with
set_attribute(). width and height set the visible output size. viewBox chooses which coordinate rectangle is shown, and SVG scales that coordinate system up or down to fill the viewport.
1from aspose.svg import SVGDocument
2
3with SVGDocument() as document:
4    svg = document.root_element
5    svg.set_attribute("width", "300")
6    svg.set_attribute("height", "150")
7    svg.set_attribute("viewBox", "0 0 100 50")
8    document.save("viewbox.svg")
In this article, you will learn how to:
width, height, and viewBox on the root SVG element;The easiest way to think about viewBox is to separate the drawing from the place where it is shown. The SVG canvas is the coordinate space where shapes are placed. The viewport is the visible output area, usually defined by width and height. The viewBox says: “show this rectangle of the canvas inside the viewport, then scale that rectangle to fill the viewport.”
The viewBox attribute has four values: min-x, min-y, width, and height. For example, viewBox="0 0 100 50" means: start looking at coordinate (0, 0), show 100 coordinate units horizontally, and show 50 coordinate units vertically. If the viewport is 300x150, that 100x50 coordinate system is enlarged three times to fill the visible area. The rendered size can also be 600x300 or any other proportional size, and the same coordinates will be scaled again to fit it.
| Attribute | Example | Meaning |
|---|---|---|
width | 300 | The visible output width, for example 300 screen pixels or CSS units |
height | 150 | The visible output height |
viewBox | 0 0 100 50 | The coordinate rectangle that is scaled to fill the viewport |
preserveAspectRatio | xMidYMid meet | How artwork is aligned and scaled when aspect ratios differ |
A user coordinate system is simply the coordinate system your shapes use after viewBox is applied. If a rectangle has x="10" and width="80", those values are measured in viewBox units, not directly in screen pixels. With width="300" height="150" viewBox="0 0 100 50", SVG scales the user coordinate system up: one viewBox unit becomes 3 rendered units in both directions. If the viewBox were larger than the viewport, the same mechanism would scale the drawing down.
Use this workflow when generated SVG artwork needs predictable coordinates and a clear visible area:
SVGDocument.document.root_element.width, height, and viewBox with
set_attribute().document.save() and check that no artwork is clipped.A common pattern is to keep simple drawing coordinates while rendering a larger image. The following example uses a 300x150 viewport with a 100x50 viewBox, then draws a rectangle in viewBox coordinates. The rectangle is defined as 80x30 coordinate units, but it appears as 240x90 rendered units because the viewport is three times larger than the viewBox in both directions.
 1import os
 2from aspose.svg import SVGDocument
 3
 4SVG_NS = "http://www.w3.org/2000/svg"
 5
 6output_folder = "output/"
 7output_path = os.path.join(output_folder, "svg-viewbox-fixed.svg")
 8os.makedirs(output_folder, exist_ok=True)
 9
10with SVGDocument() as document:
11    svg = document.root_element
12    svg.set_attribute("width", "300")
13    svg.set_attribute("height", "150")
14    svg.set_attribute("viewBox", "0 0 100 50")
15
16    rect = document.create_element_ns(SVG_NS, "rect")
17    rect.set_attribute("x", "10")
18    rect.set_attribute("y", "10")
19    rect.set_attribute("width", "80")
20    rect.set_attribute("height", "30")
21    rect.set_attribute("rx", "4")
22    rect.set_attribute("fill", "#2e86de")
23    svg.append_child(rect)
24
25    document.save(output_path)
The output keeps the rectangle proportional because the viewport ratio 300:150 matches the viewBox ratio 100:50. SVG enlarges the user coordinate system by the same factor on the x and y axes, so the rectangle gets bigger on the screen but keeps its proportions. In practice, this lets you design an icon, chart, or diagram in convenient small numbers and render it at a larger size without rewriting every coordinate.
The illustration compares the same rectangle in the same 300x150 rendered viewport. Part (a) uses viewBox="0 0 300 150", so one coordinate unit maps to one rendered unit and the 80x30 rectangle stays small. Part (b) uses viewBox="0 0 100 50", so SVG enlarges the smaller coordinate system three times to fill the same viewport. The rectangle uses the same code values, but it appears much larger.
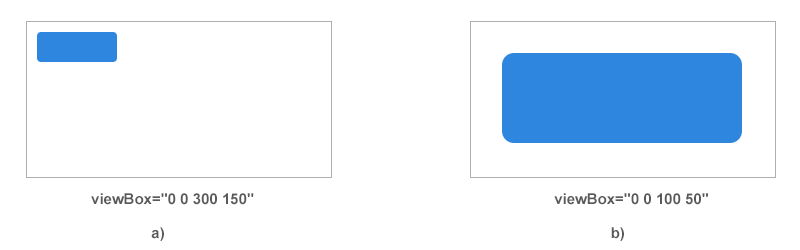
The first two viewBox values can be negative or non-zero. They do not move a single shape. They move the visible coordinate window over the SVG canvas. This is useful when generated artwork uses coordinates around a center point or when you need space around a shape whose coordinates cross zero.
In the next example, viewBox="-60 -60 120 120" makes coordinate (0, 0) appear in the middle of the square viewport. The visible area starts at x=-60, y=-60, then extends 120 units to the right and 120 units downward.
 1import os
 2from aspose.svg import SVGDocument
 3
 4namespace_uri = "http://www.w3.org/2000/svg"
 5
 6output_folder = "output/"
 7output_path = os.path.join(output_folder, "svg-viewbox-shifted.svg")
 8os.makedirs(output_folder, exist_ok=True)
 9
10with SVGDocument() as document:
11    svg = document.root_element
12    svg.set_attribute("width", "240")
13    svg.set_attribute("height", "240")
14    svg.set_attribute("viewBox", "-60 -60 120 120")
15
16    x_axis = document.create_element_ns(namespace_uri, "line")
17    x_axis.set_attribute("x1", "-50")
18    x_axis.set_attribute("y1", "0")
19    x_axis.set_attribute("x2", "50")
20    x_axis.set_attribute("y2", "0")
21    x_axis.set_attribute("stroke", "#0071aa")
22    x_axis.set_attribute("stroke-width", "3")
23    svg.append_child(x_axis)
24
25    marker = document.create_element_ns(namespace_uri, "circle")
26    marker.set_attribute("cx", "0")
27    marker.set_attribute("cy", "0")
28    marker.set_attribute("r", "25")
29    marker.set_attribute("fill", "#00aaaa")
30    marker.set_attribute("stroke", "#006863")
31    marker.set_attribute("stroke-width", "5")
32    svg.append_child(marker)
33
34    document.save(output_path)
Here the center of the visible area is coordinate (0, 0). The horizontal axis runs from x=-50 to x=50, and the circle is centered exactly on the origin. This pattern is useful for icons, markers, polar diagrams, and generated symbols that are easier to calculate around a center.
The illustration compares two ways to show a circle whose center is at coordinate (0, 0). Part (a) uses viewBox="0 0 240 240", so (0, 0) is the upper-left corner and most of the circle is clipped outside the viewport. Part (b) uses viewBox="-60 -60 120 120", so the visible coordinate area starts at (-60, -60) and ends at (60, 60). This places (0, 0) in the center of the viewport and makes the full circle visible.

| Problem | Why it happens | Fix |
|---|---|---|
| SVG appears blank | All visible elements are outside the coordinate rectangle defined by viewBox. For example, a circle at cx="200" is not visible in viewBox="0 0 100 100". | Move the elements into the viewBox range or increase the viewBox width, height, min-x, and min-y values so the elements are inside the visible coordinate area. |
| Artwork is clipped | The element is only partly inside the viewBox. SVG shows the part that falls inside the visible coordinate rectangle and hides the rest. | Expand the viewBox or shift it with min-x and min-y so the whole shape fits into the visible area. |
| Artwork looks larger than expected | The viewBox width and height are smaller than the viewport, which creates a zoom-in effect. | Use a larger viewBox or reduce the rendered width and height. |
| Artwork looks smaller than expected | The viewBox width and height are larger than the viewport, which creates a zoom-out effect. | Use a smaller viewBox or increase the rendered width and height. |
| Output looks stretched | The viewport aspect ratio does not match the viewBox ratio. For example, 300x150 and 100x100 have different proportions. | Use matching proportions or set preserveAspectRatio deliberately. |
| Coordinates feel hard to manage | The viewBox does not match how you think about the drawing. | Choose a convenient coordinate system, such as 0 0 100 100 for icons or centered negative-to-positive coordinates for symmetric shapes. |
| Stroke is cut at the edge | The shape itself fits, but the stroke is drawn half inside and half outside the shape boundary. A circle touching the viewBox edge can lose part of its outline. | Leave extra margin inside the viewBox or move the shape away from the edge by at least half the stroke-width. |
The viewBox defines which rectangular coordinate area of the SVG canvas should be shown inside the SVG viewport. In viewBox="0 0 100 50", the visible area starts at (0, 0) and includes 100 units across and 50 units down. SVG then scales that 100x50 coordinate area up or down to fill the rendered viewport.
The viewport is the visible output area defined by width and height. The viewBox is the coordinate rectangle mapped into that visible area. For a deeper SVG theory explanation, see
SVG Coordinate Systems and Units and
SVG viewBox.
No. width and height control the rendered viewport size. The viewBox controls the coordinate area used by shapes, text, and paths. A circle with cx="50" still uses coordinate 50, even if the SVG is rendered at 100 pixels wide or 1000 pixels wide.
A smaller viewBox shows a smaller coordinate area and fits it into the same viewport. For example, fitting viewBox="0 0 50 50" into a 200x200 viewport makes each coordinate unit occupy more rendered space (4 times) than fitting viewBox="0 0 200 200" into the same viewport.
A larger viewBox shows more coordinate space inside the same viewport. The renderer has to fit more canvas area into the same visible size, so each coordinate unit takes less rendered space and the artwork appears smaller.
Yes. Negative min-x or min-y values are useful when drawing around a center point or when artwork needs visible margin around coordinates near zero.
Analyzing your prompt, please hold on...
An error occurred while retrieving the results. Please refresh the page and try again.