Gantt -Diagramme rendern
Überblick
Gantt -Diagramme werden häufig verwendet, um Projektpläne, Aufgabenhierarchien, Dauer und Abhängigkeiten zu visualisieren. Mit Aspose.Tasks für .NET können Entwickler Gantt -Diagramme programmgesteuert in Bildformate wie JPEG, PNG, BMP oder Multipage TIFF rendern und die fortgeschrittene Anpassung von Layout, Farben, Labels, Zeitstichen und Barstilen unterstützen.
Mit Microsoft Project können Benutzer die Zeitskala festlegen, in der ein Gantt -Diagramm angezeigt wird. (Die Zeitskala ist oben in der Gantt -Diagrammansicht angezeigt.) Sie können bis zu drei Zeitstufen des Zeitraums haben, um ihnen genau die Zeitauflösung zu geben, die sie benötigen.
Aspose.Tasks für .NET unterstützt diese Funktion und ermöglicht es Ihnen, Gantt -Diagramme mit unterschiedlichen Zeitskala -Einstellungen zu rendern. Gantt-Diagramme können mit diesen Optionen einseitig auf ein Seitenbild gerendert werden.
Unterstützte Ausgangsformate
Gantt -Diagramme können exportiert werden nach:
- JPEG/PNG/BMP - zum Einbetten in Dokumente oder Berichte
- TIFF (Multipage) - zum Drucken oder Archivieren
- PDF-Verwenden von
pdfsaveOptionsfür das Rendering des Berichtsstils
Typische Anwendungsfälle umfassen:
- Integration mit internen Dashboards oder Berichtsmotoren
- Druckvisuelle für Stakeholder
- Archivierungsprojektstaaten für Prüfungszwecke
Zeitskalen einstellen und auf ein Bild speichern
Die Zeitskala -Eigenschaft der ImagesSaveOptions Die Zeitskala der Klasse der Klasse bestimmt die Zeitskala -Einstellungen eines Projekts. Die Zeitskala ist standardmäßig auf Tage eingestellt. Die anderen Optionen sind Monat und dritte Monate.
Das folgende Code -Beispiel:
- Liest eine Projektdatei.
- Legt jede verschiedene Zeitskala -Einstellung fest.
- Speichert die Datei als JPG auf Disk.
 1Project project = new Project("New Project.mpp");
 2
 3// Save to one page image (Timescale.days by default)
 4project.Save("NewProductDevDays.jpeg", new ImageSaveOptions(SaveFileFormat.JPEG));
 5
 6// Save to one page image (Timescale.ThirdsOfMonths)
 7ImageSaveOptions options = new ImageSaveOptions(SaveFileFormat.JPEG);
 8options.Timescale = Timescale.ThirdsOfMonths;
 9
10project.Save("NewProductDevThirdsOfMonths.jpeg", options);
11
12// Save to one page image (Timescale.Months)
13options.Timescale = Timescale.Months;
14project.Save("NewProductDevMonths.jpeg", options);Key Rendering Settings
| Property | Description |
|---|---|
ImageSaveOptions.Timescale | Defines timeline scale (Days, Months, etc.) |
RollUpGanttBars | Enables rolled-up summary bars |
DrawNonWorkingTime | Toggles rendering of non-working hours/days |
TextFormatter | Customizes task labels dynamically |
StringAlignment | Controls alignment of text in columns |
UseGradientBrush | Enables MS Project–like gradient fill |
Gantt-Balken beim Rendern aufrollen
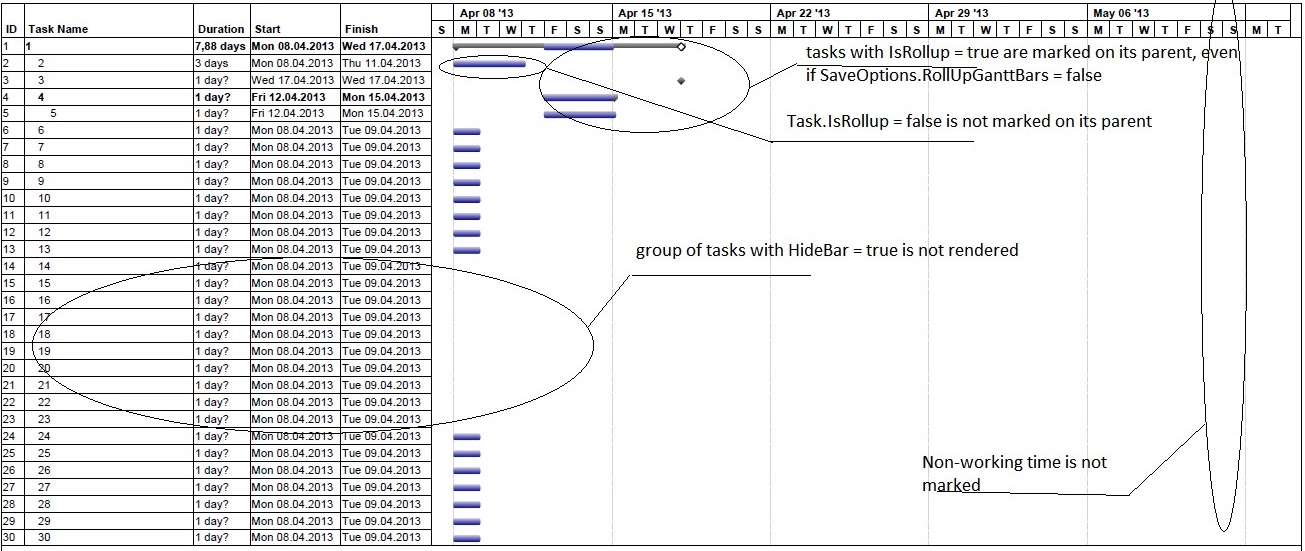
- Wenn die Eigenschaft SaveOptions.RollUpGanttBars auf „true“ gesetzt ist, werden alle Sammelvorgänge im Projekt durch ihre sichtbaren Untervorgänge markiert. Die Eigenschaft Task.HideBar wird beim Rendern berücksichtigt. (Wenn Task.HideBar = „true“, wird der Balken im Gantt-Diagramm nicht angezeigt.)
- Wenn SaveOptions.RollUpGanttBars = „false“ ist, wird der Untervorgang trotzdem im Sammelvorgang angezeigt, sofern subtask.IsRollup und subtask.ParentTask.IsRollup auf „true“ gesetzt sind.
Auch wenn SaveOptions.DrawNonWorkingTime (Standardwert = „true“) auf „false“ gesetzt ist, wird die arbeitsfreie Zeit nicht im Gantt-Diagramm angezeigt.
Example 1: Gantt Chart Bars Not Rolled Up
1PdfSaveOptions options = new PdfSaveOptions();
2options.PresentationFormat = PresentationFormat.GanttChart;
3options.FitContent = true;
4options.RollUpGanttBars = false;
5options.DrawNonWorkingTime = false;
6options.PageSize = PageSize.A3;
7Project project = new Project(file);
8project.Save("RenderGanttChartWithBarsNotRolledUp_out.pdf", (SaveOptions)options);The output from example 1
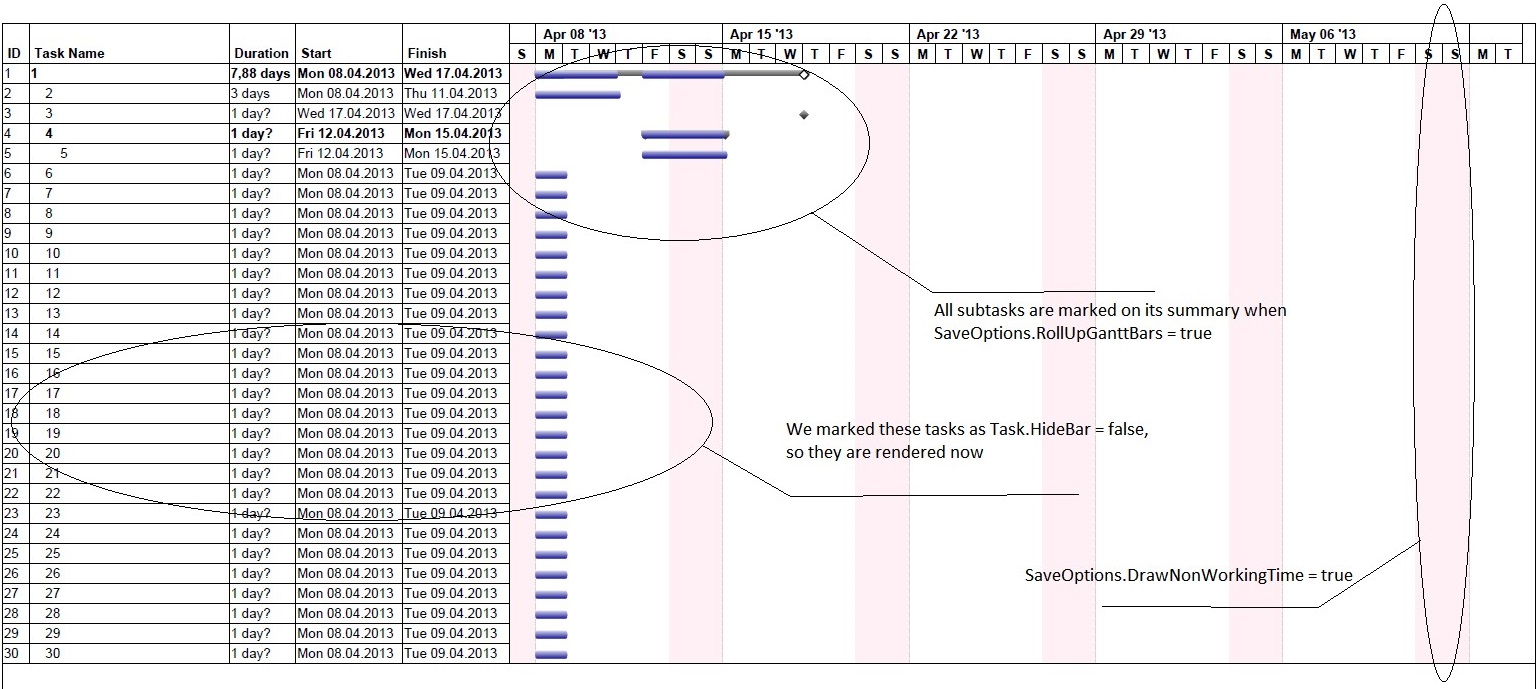
Example 2: Rolling Up Gantt Chart Bars
In this example, SaveOptions.RollUpGanttBars = true, SaveOptions.DrawNonWorkingTime = true, and task.HideBar = false for hidden tasks.
1PdfSaveOptions options = new PdfSaveOptions();
2options.PresentationFormat = PresentationFormat.GanttChart;
3options.FitContent = true;
4options.RollUpGanttBars = true;
5options.DrawNonWorkingTime = true;
6options.PageSize = PageSize.A3;
7
8Project project = new Project(fileName);
9project.Save("RenderGanttChartWithBarsNotRolledUp_out.pdf", (SaveOptions)options);The output from example 2
Customize Text with Task Bars
In this example, the text on the right of the taskbar can be customized by delegate instance. Here we customize the text on the critical tasks.
 1Project project = new Project();
 2
 3Task task1 = project.RootTask.Children.Add("Task 1");
 4Task task2 = project.RootTask.Children.Add("Task 2");
 5
 6task1.Set(Tsk.Duration, project.GetDuration(1, TimeUnitType.Day));
 7task2.Set(Tsk.Duration, project.GetDuration(1, TimeUnitType.Day));
 8
 9TaskLink link = project.TaskLinks.Add(task1, task2, TaskLinkType.FinishToStart);
10
11Task task3 = project.RootTask.Children.Add("Task 3");
12Resource resource1 = project.Resources.Add("Resource 1");
13Resource resource2 = project.Resources.Add("Resource 2");
14Resource resource3 = project.Resources.Add("Resource 3");
15
16ResourceAssignment assignment1 = project.ResourceAssignments.Add(task1, resource1);
17ResourceAssignment assignment2 = project.ResourceAssignments.Add(task2, resource2);
18ResourceAssignment assignment3 = project.ResourceAssignments.Add(task3, resource3);
19
20SaveOptions options = new PdfSaveOptions();
21options.Timescale = Timescale.ThirdsOfMonths;
22
23BarStyle style = new BarStyle();
24style.ItemType = BarItemType.CriticalTask;
25
26style.BarTextConverter = delegate (Task t)
27{
28  return string.Format("This task is on critical path");
29};
30
31BarStyle style2 = new BarStyle();
32style2.BarColor = Color.DarkOrchid;
33style2.ItemType = BarItemType.Task;
34
35options.BarStyles = new List<BarStyle>();
36options.BarStyles.Add(style);
37options.BarStyles.Add(style2);
38
39project.Save("output.pdf", options);Align Cell Contents
Text can be aligned by GanttChartColumn.StringAlignment, ResourceViewColumn.StringAlignment properties. Alignment by default is StringAlignment.Near (left).
 1Project project = new Project("New Project.mpp");
 2SaveOptions options = new PdfSaveOptions();
 3options.Timescale = Timescale.Months;
 4options.View = ProjectView.GetDefaultGanttChartView();
 5
 6GanttChartColumn column1 = options.View.Columns[2] as GanttChartColumn;
 7column1.StringAlignment = StringAlignment.Center;
 8column1 = options.View.Columns[3] as GanttChartColumn;
 9column1.StringAlignment = StringAlignment.Far;
10column1 = options.View.Columns[4] as GanttChartColumn;
11column1.StringAlignment = StringAlignment.Far;
12
13project.Save("AlignCellContents_GanttChart_out.pdf", options);
14
15options.PresentationFormat = PresentationFormat.ResourceSheet;
16options.View = ProjectView.GetDefaultResourceSheetView();
17
18ResourceViewColumn column2 = options.View.Columns[2] as ResourceViewColumn;
19column2.StringAlignment = StringAlignment.Center;
20column2 = options.View.Columns[3] as ResourceViewColumn;
21column2.StringAlignment = StringAlignment.Far;
22column2 = options.View.Columns[4] as ResourceViewColumn;
23column2.StringAlignment = StringAlignment.Far;
24
25project.Save("AlignCellContents_ResourceSheet_out.pdf", options);Changing Gantt Chart Bars Color Gradient
Microsoft Project allows users to render the output of Gantt charts using gradients. The same functionality is provided by Aspose.Tasks as shown in the following sample code.
1Project project = new Project("New Project.mpp");
2SaveOptions options = new XamlOptions();
3options.UseGradientBrush = false;
4project.Save("ChangeGanttBarsColorGradient_Solid_out.xaml", options);
5
6options.UseGradientBrush = true;
7project.Save("ChangeGanttBarsColorGradient_Gradient_out.xaml", options);Setting Start date of Gantt Chart View
The TimeScaleStart property exposed by Prj class allows to set the start date of the Gantt chart view. However, if the saved file is opened by MSP in maximized window mode then the timescale start date will not match.
1Project project = new Project("New Project.mpp");
2project.Set(Prj.TimescaleStart, new DateTime(2012, 4, 30));
3project.Save("SetGanttChartViewStartDate_out.mpp", SaveFileFormat.MPP);Aspose.Tasks for .NET provides comprehensive capabilities for exporting Gantt charts with full control over layout, style, and visual logic. Whether you’re generating visual reports, printing schedules, or embedding task data into dashboards — the flexible rendering engine supports your use case.
You can further explore: