Renderizando gráficos Gantt
Descripción general
Los gráficos Gantt se utilizan ampliamente para visualizar los horarios de los proyectos, las jerarquías de tareas, las duraciones y las dependencias. Aspose.Tasks for .NET permite a los desarrolladores hacer medidas medias programáticas a formatos de imagen como JPEG, PNG, BMP o TIFF multipage, admitiendo la personalización avanzada de diseño, colores, etiquetas, escala de tiempo y estilos de barra.
Microsoft Project permite a los usuarios establecer la escala de tiempo en la que se muestra un grado de Gantt.
Aspose.Tasks para .NET admite esta función y le permite representar gráficos Gantt con diferentes configuraciones de escala de tiempo. Los gráficos Gantt se pueden representar a la imagen de una página utilizando estas opciones.
Formatos de salida compatibles
Los gráficos de Gantt se pueden exportar a:
- jpeg/png/bmp - para incrustar en documentos o informes
- tiff (multipage) - para imprimir o archivar
- PDF-Uso de
pdfsaveOptionspara el renderizado de estilo de informe
Los casos de uso típicos incluyen:
- Integración con paneles internos o motores de informes
- Impresos listos para la impresión para las partes interesadas
- Archivando estados del proyecto para fines de auditoría
Configuración de escalas de tiempo y guardando una imagen
La propiedad de la escala de tiempo de la clase determina la configuración de la escala de tiempo de un proyecto. La escala de tiempo se establece en días por defecto. Las otras opciones son mes y tercero de los meses.
La siguiente muestra de código:
- Lee un archivo de proyecto.
- Establece cada configuración de escala de tiempo diferente.
- Guarda el archivo en el disco como JPG.
 1Project project = new Project("New Project.mpp");
 2
 3// Save to one page image (Timescale.days by default)
 4project.Save("NewProductDevDays.jpeg", new ImageSaveOptions(SaveFileFormat.JPEG));
 5
 6// Save to one page image (Timescale.ThirdsOfMonths)
 7ImageSaveOptions options = new ImageSaveOptions(SaveFileFormat.JPEG);
 8options.Timescale = Timescale.ThirdsOfMonths;
 9
10project.Save("NewProductDevThirdsOfMonths.jpeg", options);
11
12// Save to one page image (Timescale.Months)
13options.Timescale = Timescale.Months;
14project.Save("NewProductDevMonths.jpeg", options);Key Rendering Settings
| Property | Description |
|---|---|
ImageSaveOptions.Timescale | Defines timeline scale (Days, Months, etc.) |
RollUpGanttBars | Enables rolled-up summary bars |
DrawNonWorkingTime | Toggles rendering of non-working hours/days |
TextFormatter | Customizes task labels dynamically |
StringAlignment | Controls alignment of text in columns |
UseGradientBrush | Enables MS Project–like gradient fill |
Agrupamiento de barras de Gantt durante la renderización
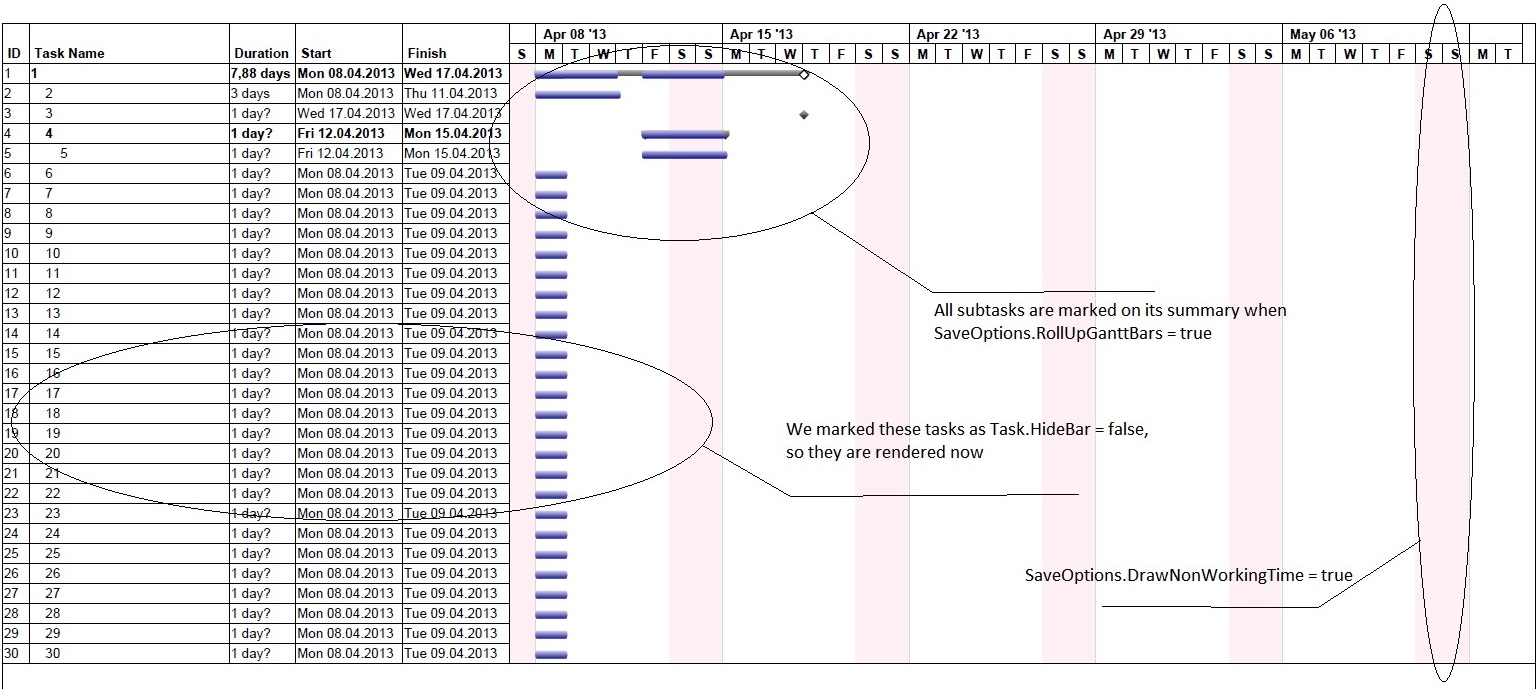
- Si la propiedad SaveOptions.RollUpGanttBars se establece en verdadero, cualquier tarea de resumen del proyecto se marcará con sus subtareas visibles, teniendo en cuenta la propiedad Task.HideBar al renderizar. (Si Task.HideBar = verdadero, la barra no se renderiza en el diagrama de Gantt).
- Si SaveOptions.RollUpGanttBars = falso, la subtarea se mostrará en la tarea de resumen de todos modos, siempre que subtask.IsRollup y subtask.ParentTask.IsRollup se establezcan en verdadero.
Además, si SaveOptions.DrawNonWorkingTime (valor predeterminado = verdadero) se establece en falso, el tiempo no laborable no se mostrará en el diagrama de Gantt.
Example 1: Gantt Chart Bars Not Rolled Up
1PdfSaveOptions options = new PdfSaveOptions();
2options.PresentationFormat = PresentationFormat.GanttChart;
3options.FitContent = true;
4options.RollUpGanttBars = false;
5options.DrawNonWorkingTime = false;
6options.PageSize = PageSize.A3;
7Project project = new Project(file);
8project.Save("RenderGanttChartWithBarsNotRolledUp_out.pdf", (SaveOptions)options);The output from example 1

Example 2: Rolling Up Gantt Chart Bars
In this example, SaveOptions.RollUpGanttBars = true, SaveOptions.DrawNonWorkingTime = true, and task.HideBar = false for hidden tasks.
1PdfSaveOptions options = new PdfSaveOptions();
2options.PresentationFormat = PresentationFormat.GanttChart;
3options.FitContent = true;
4options.RollUpGanttBars = true;
5options.DrawNonWorkingTime = true;
6options.PageSize = PageSize.A3;
7
8Project project = new Project(fileName);
9project.Save("RenderGanttChartWithBarsNotRolledUp_out.pdf", (SaveOptions)options);The output from example 2
Customize Text with Task Bars
In this example, the text on the right of the taskbar can be customized by delegate instance. Here we customize the text on the critical tasks.
 1Project project = new Project();
 2
 3Task task1 = project.RootTask.Children.Add("Task 1");
 4Task task2 = project.RootTask.Children.Add("Task 2");
 5
 6task1.Set(Tsk.Duration, project.GetDuration(1, TimeUnitType.Day));
 7task2.Set(Tsk.Duration, project.GetDuration(1, TimeUnitType.Day));
 8
 9TaskLink link = project.TaskLinks.Add(task1, task2, TaskLinkType.FinishToStart);
10
11Task task3 = project.RootTask.Children.Add("Task 3");
12Resource resource1 = project.Resources.Add("Resource 1");
13Resource resource2 = project.Resources.Add("Resource 2");
14Resource resource3 = project.Resources.Add("Resource 3");
15
16ResourceAssignment assignment1 = project.ResourceAssignments.Add(task1, resource1);
17ResourceAssignment assignment2 = project.ResourceAssignments.Add(task2, resource2);
18ResourceAssignment assignment3 = project.ResourceAssignments.Add(task3, resource3);
19
20SaveOptions options = new PdfSaveOptions();
21options.Timescale = Timescale.ThirdsOfMonths;
22
23BarStyle style = new BarStyle();
24style.ItemType = BarItemType.CriticalTask;
25
26style.BarTextConverter = delegate (Task t)
27{
28  return string.Format("This task is on critical path");
29};
30
31BarStyle style2 = new BarStyle();
32style2.BarColor = Color.DarkOrchid;
33style2.ItemType = BarItemType.Task;
34
35options.BarStyles = new List<BarStyle>();
36options.BarStyles.Add(style);
37options.BarStyles.Add(style2);
38
39project.Save("output.pdf", options);Align Cell Contents
Text can be aligned by GanttChartColumn.StringAlignment, ResourceViewColumn.StringAlignment properties. Alignment by default is StringAlignment.Near (left).
 1Project project = new Project("New Project.mpp");
 2SaveOptions options = new PdfSaveOptions();
 3options.Timescale = Timescale.Months;
 4options.View = ProjectView.GetDefaultGanttChartView();
 5
 6GanttChartColumn column1 = options.View.Columns[2] as GanttChartColumn;
 7column1.StringAlignment = StringAlignment.Center;
 8column1 = options.View.Columns[3] as GanttChartColumn;
 9column1.StringAlignment = StringAlignment.Far;
10column1 = options.View.Columns[4] as GanttChartColumn;
11column1.StringAlignment = StringAlignment.Far;
12
13project.Save("AlignCellContents_GanttChart_out.pdf", options);
14
15options.PresentationFormat = PresentationFormat.ResourceSheet;
16options.View = ProjectView.GetDefaultResourceSheetView();
17
18ResourceViewColumn column2 = options.View.Columns[2] as ResourceViewColumn;
19column2.StringAlignment = StringAlignment.Center;
20column2 = options.View.Columns[3] as ResourceViewColumn;
21column2.StringAlignment = StringAlignment.Far;
22column2 = options.View.Columns[4] as ResourceViewColumn;
23column2.StringAlignment = StringAlignment.Far;
24
25project.Save("AlignCellContents_ResourceSheet_out.pdf", options);Changing Gantt Chart Bars Color Gradient
Microsoft Project allows users to render the output of Gantt charts using gradients. The same functionality is provided by Aspose.Tasks as shown in the following sample code.
1Project project = new Project("New Project.mpp");
2SaveOptions options = new XamlOptions();
3options.UseGradientBrush = false;
4project.Save("ChangeGanttBarsColorGradient_Solid_out.xaml", options);
5
6options.UseGradientBrush = true;
7project.Save("ChangeGanttBarsColorGradient_Gradient_out.xaml", options);Setting Start date of Gantt Chart View
The TimeScaleStart property exposed by Prj class allows to set the start date of the Gantt chart view. However, if the saved file is opened by MSP in maximized window mode then the timescale start date will not match.
1Project project = new Project("New Project.mpp");
2project.Set(Prj.TimescaleStart, new DateTime(2012, 4, 30));
3project.Save("SetGanttChartViewStartDate_out.mpp", SaveFileFormat.MPP);Aspose.Tasks for .NET provides comprehensive capabilities for exporting Gantt charts with full control over layout, style, and visual logic. Whether you’re generating visual reports, printing schedules, or embedding task data into dashboards — the flexible rendering engine supports your use case.
You can further explore: