Rendre les graphiques de Gantt
Aperçu
Les graphiques Gantt sont largement utilisés pour visualiser les calendriers de projet, les hiérarchies de tâches, les durées et les dépendances. Aspose.tasks pour .NET permet aux développeurs de rendre programme des graphiques Gantt par programmation vers des formats d’image tels que JPEG, PNG, BMP ou TIFF multipage, prenant en charge la personnalisation avancée de la mise en page, des couleurs, des étiquettes, de l’échelle de temps et des styles de barre.
Microsoft Project permet aux utilisateurs de définir l’échelle de temps dans laquelle un graphique Gantt est affiché. (L’échelle de temps est indiquée en haut de la vue du graphique de Gantt.) Ils peuvent avoir jusqu’à trois niveaux d’échelle de temps pour leur donner exactement la résolution temporelle dont ils ont besoin.
Aspose.tasks pour .NET prend en charge cette fonctionnalité et vous permet de rendre des graphiques Gantt avec différents paramètres de temps de temps. Les graphiques Gantt peuvent être rendus à une image d’une page à l’aide de ces options.
Formats de sortie pris en charge
Les graphiques de Gantt peuvent être exportés vers:
- jpeg / png / bmp - pour l’intégration dans des documents ou des rapports
- TIFF (Multipage) - pour l’impression ou l’archivage
- PDF - Utilisation de
PDFSaveOptionspour le rendu de style rapport
Les cas d’utilisation typiques comprennent:
- Intégration avec des tableaux de bord internes ou des moteurs de rapport
- Visuels prêts pour l’impression pour les parties prenantes
- Archivage des États du projet à des fins d’audit
Définition des échelles de temps et enregistrer sur une image
La propriété de l’échelle de temps de la classe ImagesVeOptions détermine les paramètres de temps d’un projet. L’échelle de temps est définie sur des jours par défaut. Les autres options sont du mois et du tiers des mois.
L’exemple de code suivant:
- Lit un fichier de projet.
- Définit chaque paramètre de temps différent.
- Enregistre le fichier sur le disque en JPG.
 1Project project = new Project("New Project.mpp");
 2
 3// Save to one page image (Timescale.days by default)
 4project.Save("NewProductDevDays.jpeg", new ImageSaveOptions(SaveFileFormat.JPEG));
 5
 6// Save to one page image (Timescale.ThirdsOfMonths)
 7ImageSaveOptions options = new ImageSaveOptions(SaveFileFormat.JPEG);
 8options.Timescale = Timescale.ThirdsOfMonths;
 9
10project.Save("NewProductDevThirdsOfMonths.jpeg", options);
11
12// Save to one page image (Timescale.Months)
13options.Timescale = Timescale.Months;
14project.Save("NewProductDevMonths.jpeg", options);Key Rendering Settings
| Property | Description |
|---|---|
ImageSaveOptions.Timescale | Defines timeline scale (Days, Months, etc.) |
RollUpGanttBars | Enables rolled-up summary bars |
DrawNonWorkingTime | Toggles rendering of non-working hours/days |
TextFormatter | Customizes task labels dynamically |
StringAlignment | Controls alignment of text in columns |
UseGradientBrush | Enables MS Project–like gradient fill |
Rolling Up Gantt Bars During Rendering
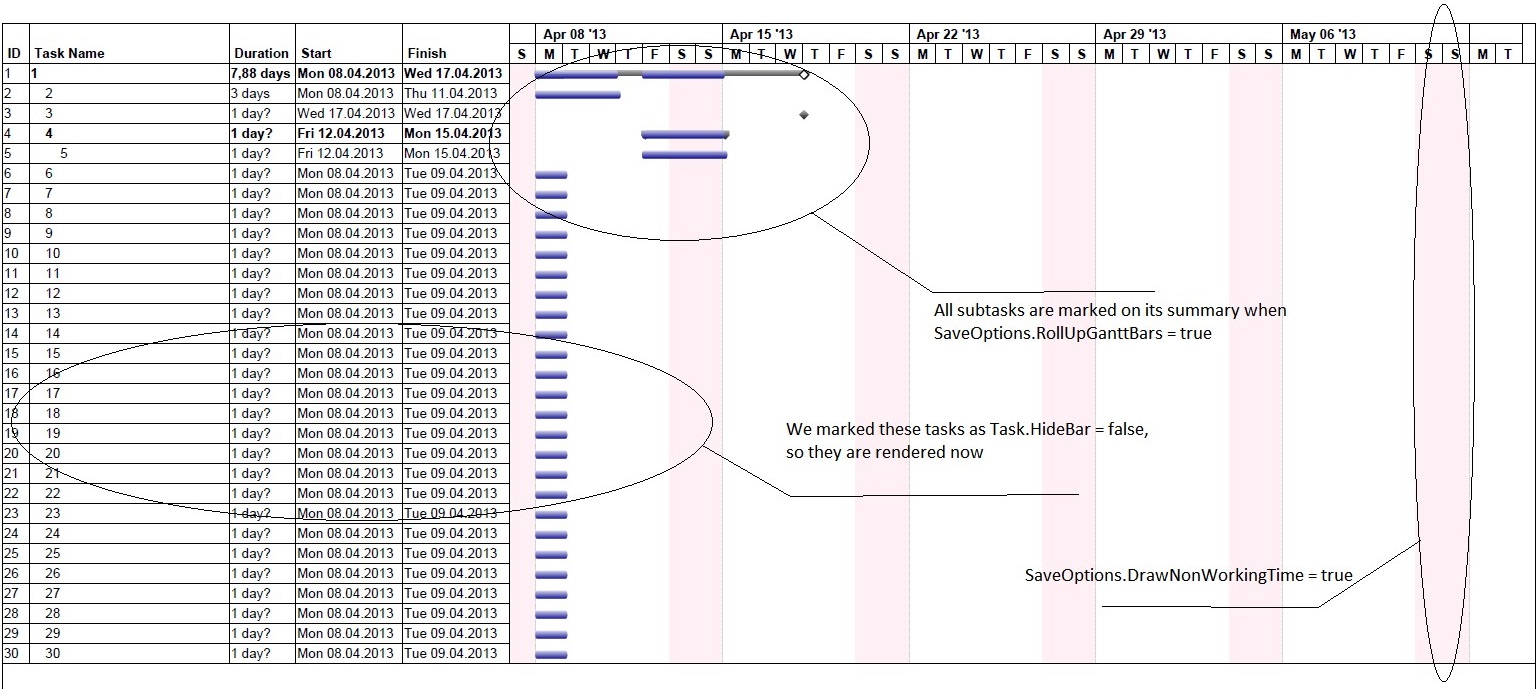
- If the SaveOptions.RollUpGanttBars property is set to true, any summary task in the project is marked by its visible subtasks, keeping into account the Task.HideBar property when rendering. (If Task.HideBar = true, the bar is not rendered on the Gantt chart.)
- If SaveOptions.RollUpGanttBars = false, the subtask will be shown on the summary task anyway, provided that subtask.IsRollup and subtask.ParentTask.IsRollup are set to true.
Also, if SaveOptions.DrawNonWorkingTime (default value = true) is set to false, non-working time will not be shown on the Gantt chart.
Example 1: Gantt Chart Bars Not Rolled Up
1PdfSaveOptions options = new PdfSaveOptions();
2options.PresentationFormat = PresentationFormat.GanttChart;
3options.FitContent = true;
4options.RollUpGanttBars = false;
5options.DrawNonWorkingTime = false;
6options.PageSize = PageSize.A3;
7Project project = new Project(file);
8project.Save("RenderGanttChartWithBarsNotRolledUp_out.pdf", (SaveOptions)options);The output from example 1

Example 2: Rolling Up Gantt Chart Bars
In this example, SaveOptions.RollUpGanttBars = true, SaveOptions.DrawNonWorkingTime = true, and task.HideBar = false for hidden tasks.
1PdfSaveOptions options = new PdfSaveOptions();
2options.PresentationFormat = PresentationFormat.GanttChart;
3options.FitContent = true;
4options.RollUpGanttBars = true;
5options.DrawNonWorkingTime = true;
6options.PageSize = PageSize.A3;
7
8Project project = new Project(fileName);
9project.Save("RenderGanttChartWithBarsNotRolledUp_out.pdf", (SaveOptions)options);The output from example 2
Customize Text with Task Bars
In this example, the text on the right of the taskbar can be customized by delegate instance. Here we customize the text on the critical tasks.
 1Project project = new Project();
 2
 3Task task1 = project.RootTask.Children.Add("Task 1");
 4Task task2 = project.RootTask.Children.Add("Task 2");
 5
 6task1.Set(Tsk.Duration, project.GetDuration(1, TimeUnitType.Day));
 7task2.Set(Tsk.Duration, project.GetDuration(1, TimeUnitType.Day));
 8
 9TaskLink link = project.TaskLinks.Add(task1, task2, TaskLinkType.FinishToStart);
10
11Task task3 = project.RootTask.Children.Add("Task 3");
12Resource resource1 = project.Resources.Add("Resource 1");
13Resource resource2 = project.Resources.Add("Resource 2");
14Resource resource3 = project.Resources.Add("Resource 3");
15
16ResourceAssignment assignment1 = project.ResourceAssignments.Add(task1, resource1);
17ResourceAssignment assignment2 = project.ResourceAssignments.Add(task2, resource2);
18ResourceAssignment assignment3 = project.ResourceAssignments.Add(task3, resource3);
19
20SaveOptions options = new PdfSaveOptions();
21options.Timescale = Timescale.ThirdsOfMonths;
22
23BarStyle style = new BarStyle();
24style.ItemType = BarItemType.CriticalTask;
25
26style.BarTextConverter = delegate (Task t)
27{
28  return string.Format("This task is on critical path");
29};
30
31BarStyle style2 = new BarStyle();
32style2.BarColor = Color.DarkOrchid;
33style2.ItemType = BarItemType.Task;
34
35options.BarStyles = new List<BarStyle>();
36options.BarStyles.Add(style);
37options.BarStyles.Add(style2);
38
39project.Save("output.pdf", options);Align Cell Contents
Text can be aligned by GanttChartColumn.StringAlignment, ResourceViewColumn.StringAlignment properties. Alignment by default is StringAlignment.Near (left).
 1Project project = new Project("New Project.mpp");
 2SaveOptions options = new PdfSaveOptions();
 3options.Timescale = Timescale.Months;
 4options.View = ProjectView.GetDefaultGanttChartView();
 5
 6GanttChartColumn column1 = options.View.Columns[2] as GanttChartColumn;
 7column1.StringAlignment = StringAlignment.Center;
 8column1 = options.View.Columns[3] as GanttChartColumn;
 9column1.StringAlignment = StringAlignment.Far;
10column1 = options.View.Columns[4] as GanttChartColumn;
11column1.StringAlignment = StringAlignment.Far;
12
13project.Save("AlignCellContents_GanttChart_out.pdf", options);
14
15options.PresentationFormat = PresentationFormat.ResourceSheet;
16options.View = ProjectView.GetDefaultResourceSheetView();
17
18ResourceViewColumn column2 = options.View.Columns[2] as ResourceViewColumn;
19column2.StringAlignment = StringAlignment.Center;
20column2 = options.View.Columns[3] as ResourceViewColumn;
21column2.StringAlignment = StringAlignment.Far;
22column2 = options.View.Columns[4] as ResourceViewColumn;
23column2.StringAlignment = StringAlignment.Far;
24
25project.Save("AlignCellContents_ResourceSheet_out.pdf", options);Changing Gantt Chart Bars Color Gradient
Microsoft Project allows users to render the output of Gantt charts using gradients. The same functionality is provided by Aspose.Tasks as shown in the following sample code.
1Project project = new Project("New Project.mpp");
2SaveOptions options = new XamlOptions();
3options.UseGradientBrush = false;
4project.Save("ChangeGanttBarsColorGradient_Solid_out.xaml", options);
5
6options.UseGradientBrush = true;
7project.Save("ChangeGanttBarsColorGradient_Gradient_out.xaml", options);Setting Start date of Gantt Chart View
The TimeScaleStart property exposed by Prj class allows to set the start date of the Gantt chart view. However, if the saved file is opened by MSP in maximized window mode then the timescale start date will not match.
1Project project = new Project("New Project.mpp");
2project.Set(Prj.TimescaleStart, new DateTime(2012, 4, 30));
3project.Save("SetGanttChartViewStartDate_out.mpp", SaveFileFormat.MPP);Aspose.Tasks for .NET provides comprehensive capabilities for exporting Gantt charts with full control over layout, style, and visual logic. Whether you’re generating visual reports, printing schedules, or embedding task data into dashboards — the flexible rendering engine supports your use case.
You can further explore: