レンダリングされたガントチャート画像に複数の列を表示します
概要
Microsoft Projectでは、プロジェクトデータはテキスト形式で、グラフでチャートとして表現できます。最も一般的なチャートタイプには、ガントチャート、タスクの使用、リソースの使用が含まれます。 .NETのAspose.Tasksは、プロジェクトデータをグラフィカルチャートとしてサポートしています。
この記事では、ガントチャートに表示されるプロジェクト列をカスタマイズするための2つのアプローチについて説明し、チャートを画像にレンダリングする方法を示します。
ガントチャート
ガントチャートは、数日、数週間、または月ごとにセグメント化されたプロジェクトタスクのタイムラインベースのグラフィカル表現です。プロジェクトは通常、リソースに割り当てられたタスクで構成されています。個々のタスクは、サブタスクに分割される場合があります。各タスクには、その期間を定義する開始日と終了日があります。 MicrosoftプロジェクトのGanttチャートは、この情報の視覚的な概要を提供します。
次のスクリーンショットは、Microsoftプロジェクトの典型的なガントチャートを示しています。
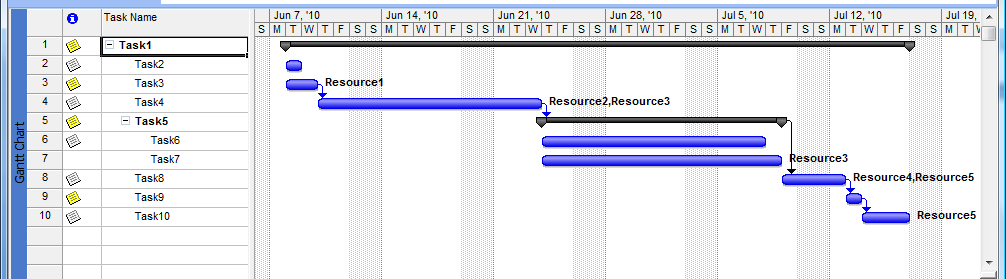
asopsion.tasks for .netのガントチャート画像
.NETのASOPSE.TASKSでは、「プロジェクト」クラスは、プロジェクトファイルを操作するための主要なクラスです。 「Save」メソッドの複数の過負荷を公開して、プロジェクトデータをさまざまな形式にエクスポートします。
たとえば、 save(string、saveoptions)オーバーロード:
- 最初のパラメーターは、出力ファイル名を指定します。
- 2番目のパラメーターは、PDF形式の「pdfsaveoptions」など、「saveoptions」から派生したクラスのインスタンスを受け入れます。
SaveOptionsタイプ
レンダリング動作は、「Saveoptions」クラスまたはその継承者の1つのプロパティを使用してカスタマイズできます。例えば:
saveoptions.customagesizeを使用して、出力ページのサイズを定義します。- 「saveoptions.legendoneachpage」を使用して、各ページに凡例が表示されるかどうかを制御します。
1PdfSaveOptions saveOptions = new PdfSaveOptions()
2{
3    CustomPageSize = new SizeF(800, 600),
4    LegendOnEachPage = false
5};
There are at least two approaches to customize the appearance of the rendered Gantt chart.
Customize Gantt Chart Columns Using ProjectView
This approach is considered obsolete and is unlikely to be extended in future releases. The ProjectView class provides limited functionality and allows specifying a set of columns to be included in the output image.
To use it, create a list of GanttChartColumn instances and pass them to the ProjectView constructor. Then assign this view to the SaveOptions.View property.
1// Create the view columns
2var columns = new List<GanttChartColumn>();
3columns.Add(new GanttChartColumn("Name", 100, new TaskToColumnTextConverter(TaskName)));
4columns.Add(new GanttChartColumn("Notes", 100, new TaskToColumnTextConverter(TaskNotes)));
5columns.Add(new GanttChartColumn("Resources", 200, new TaskToColumnTextConverter(TaskResources)));
6
7// Create the view
8ProjectView projectView = new ProjectView(columns);
9
10// Create SaveOptions
11PdfSaveOptions saveOptions = new PdfSaveOptions()
12{
13 CustomPageSize = new SizeF(800, 600),
14 View = projectView
15};
16
17// Save the project to PDF
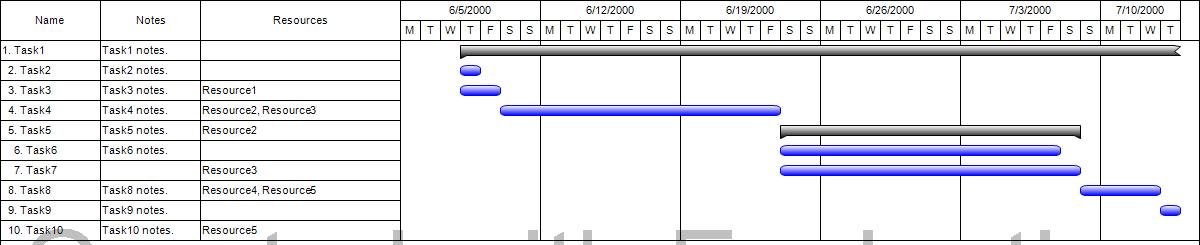
18project.Save("output.pdf", saveOptions);The GanttChartColumn constructor accepts three arguments: the column name, column width, and a TaskToColumnTextConverter delegate that converts task data to display text. Example implementations:
1private string TaskName(Task task)
2{
3 StringBuilder res = new StringBuilder();
4 for (int i = 1; i < task.OutlineLevel; i++)
5 {
6 res.Append(" ");
7 }
8
9 res.AppendFormat("{0}. {1}", task.Id, task.Name);
10 return res.ToString();
11}
12
13private string TaskNameHtml(Task task)
14{
15 StringBuilder res = new StringBuilder();
16 for (int i = 1; i < task.OutlineLevel; i++)
17 {
18 res.Append(" ");
19 }
20
21 res.AppendFormat("{0}. {1}", task.Id, task.Name);
22 return res.ToString();
23}
24
25private string TaskNotes(Task task)
26{
27 return task.NotesText ?? string.Empty;
28}
29
30private string TaskResources(Task task)
31{
32 StringBuilder res = new StringBuilder();
33 Project project = task.ParentProject;
34 bool bFirst = true;
35 foreach (ResourceAssignment assignment in project.GetResourceAssignmentsByTask(task))
36 {
37 if (assignment.Resource != null)
38 {
39 if (!bFirst)
40 {
41 res.Append(", ");
42 }
43
44 res.Append(assignment.Resource.Name);
45 bFirst = false;
46 }
47 }
48
49 return res.ToString();
50}Below are examples of resulting images exported using the above code:
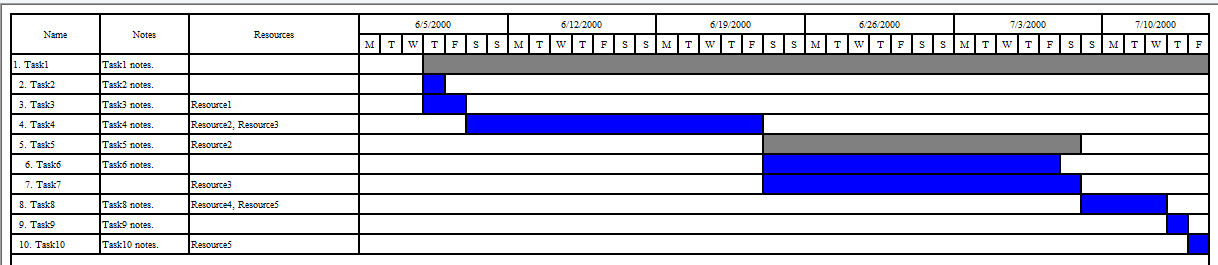
Customize Gantt Chart Columns Using View
Using the View class and its inheritors is the recommended approach for customizing chart output. The View class corresponds to the view settings in Microsoft Project and provides a richer API compared to ProjectView.
An existing view can be retrieved from the Views collection (for MPP files), customized, and passed to the Project.Save method via the SaveOptions.ViewSettings property.
The following example demonstrates how to retrieve an existing view from an MPP file, insert a new column into it, and use this view for rendering the Gantt chart.
 1Project project = new Project("input.mpp");
 2
 3// Get existing view
 4var view = (GanttChartView) project.Views.GetByName("&Gantt Chart");
 5
 6// Define and insert new column
 7TableField field = new TableField()
 8{
 9    AlignData = StringAlignment.Far,
10    Width = 50,
11    Field = Field.TaskName,
12    Title = "Task name"
13};
14
15view.Table.TableFields.Insert(1, field);
16
17PdfSaveOptions saveOptions = new PdfSaveOptions()
18{
19    ViewSettings = view
20};
21
22project.Save("output.pdf", saveOptions);
まとめ
Aspose.Tasks for .NET は、ガントチャートのレンダリングをカスタマイズするための複数のオプションを提供します。ProjectView は基本的な設定が可能ですが、機能が制限されており、非推奨となっています。
Microsoft Project のビジュアル構造に合わせた高度な制御を行うには、View とその関連クラスの使用をお勧めします。このアプローチは柔軟性が高く、MPP ファイルで定義されたビューの操作や、プログラムによる新しいビューレイアウトの設定に適しています。