ガントチャートのレンダリング
概要
ガントチャートは、プロジェクトのスケジュール、タスク階層、期間、依存関係を視覚化するために広く使用されています。 .NETのAspose.Tasksにより、開発者はGANTTチャートをプログラムでJPEG、PNG、BMP、またはMultipage TIFFなどのイメージ形式にレンダリングし、レイアウト、色、ラベル、タイムスケール、バースタイルの高度なカスタマイズをサポートします。
Microsoft Projectを使用すると、ユーザーはガントチャートが表示されるタイムスケールを設定できます。(タイムスケールはガントチャートビューの上部に示されています)。
.NETのAspose.tasksはこの機能をサポートし、異なるタイムスケール設定でガントチャートをレンダリングできます。ガントチャートは、これらのオプションを使用して1ページの画像にレンダリングできます。
サポートされている出力形式
ガントチャートは次のようにエクスポートできます。
- JPEG/PNG/BMP - ドキュメントまたはレポートに埋め込むため
- tiff(multipage) - 印刷またはアーカイブ用
- PDF - レポートスタイルのレンダリングに「PDFSaveOptions」を使用します
典型的なユースケースには以下が含まれます。
- 内部ダッシュボードまたはレポートエンジンとの統合
- 利害関係者向けの印刷対応のビジュアル
- 監査目的でプロジェクトのアーカイブ状態
タイムスケールの設定と画像への保存
ImagesAveoptionsクラスのタイムスケールプロパティは、プロジェクトのタイムスケール設定を決定します。タイムスケールはデフォルトで日に設定されます。他のオプションは月と3ヶ月の3番目です。
次のコードサンプル:
- プロジェクトファイルを読み取ります。
- それぞれの異なるタイムスケール設定を設定します。
- ファイルをJPGとしてディスクに保存します。
 1Project project = new Project("New Project.mpp");
 2
 3// Save to one page image (Timescale.days by default)
 4project.Save("NewProductDevDays.jpeg", new ImageSaveOptions(SaveFileFormat.JPEG));
 5
 6// Save to one page image (Timescale.ThirdsOfMonths)
 7ImageSaveOptions options = new ImageSaveOptions(SaveFileFormat.JPEG);
 8options.Timescale = Timescale.ThirdsOfMonths;
 9
10project.Save("NewProductDevThirdsOfMonths.jpeg", options);
11
12// Save to one page image (Timescale.Months)
13options.Timescale = Timescale.Months;
14project.Save("NewProductDevMonths.jpeg", options);Key Rendering Settings
| Property | Description |
|---|---|
ImageSaveOptions.Timescale | Defines timeline scale (Days, Months, etc.) |
RollUpGanttBars | Enables rolled-up summary bars |
DrawNonWorkingTime | Toggles rendering of non-working hours/days |
TextFormatter | Customizes task labels dynamically |
StringAlignment | Controls alignment of text in columns |
UseGradientBrush | Enables MS Project–like gradient fill |
Rolling Up Gantt Bars During Rendering
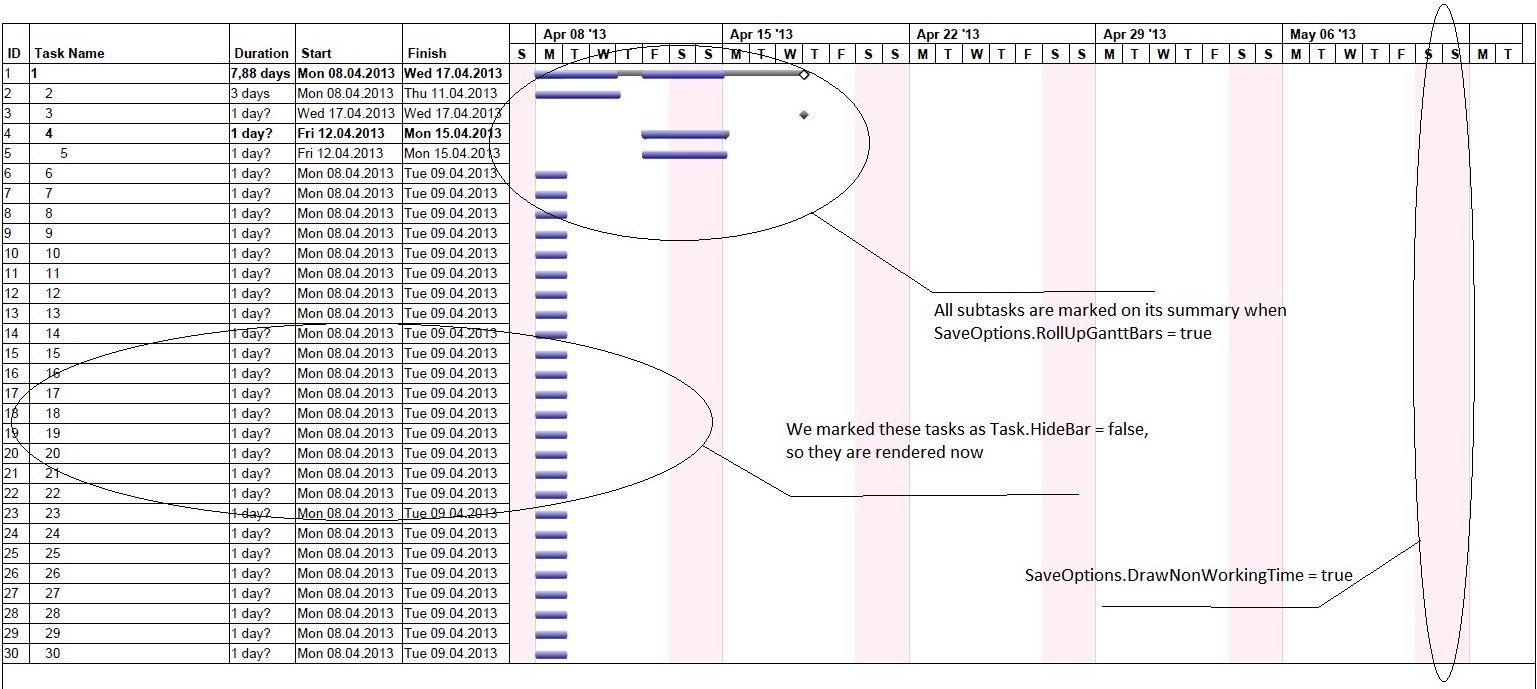
- If the SaveOptions.RollUpGanttBars property is set to true, any summary task in the project is marked by its visible subtasks, keeping into account the Task.HideBar property when rendering. (If Task.HideBar = true, the bar is not rendered on the Gantt chart.)
- If SaveOptions.RollUpGanttBars = false, the subtask will be shown on the summary task anyway, provided that subtask.IsRollup and subtask.ParentTask.IsRollup are set to true.
Also, if SaveOptions.DrawNonWorkingTime (default value = true) is set to false, non-working time will not be shown on the Gantt chart.
Example 1: Gantt Chart Bars Not Rolled Up
1PdfSaveOptions options = new PdfSaveOptions();
2options.PresentationFormat = PresentationFormat.GanttChart;
3options.FitContent = true;
4options.RollUpGanttBars = false;
5options.DrawNonWorkingTime = false;
6options.PageSize = PageSize.A3;
7Project project = new Project(file);
8project.Save("RenderGanttChartWithBarsNotRolledUp_out.pdf", (SaveOptions)options);The output from example 1

Example 2: Rolling Up Gantt Chart Bars
In this example, SaveOptions.RollUpGanttBars = true, SaveOptions.DrawNonWorkingTime = true, and task.HideBar = false for hidden tasks.
1PdfSaveOptions options = new PdfSaveOptions();
2options.PresentationFormat = PresentationFormat.GanttChart;
3options.FitContent = true;
4options.RollUpGanttBars = true;
5options.DrawNonWorkingTime = true;
6options.PageSize = PageSize.A3;
7
8Project project = new Project(fileName);
9project.Save("RenderGanttChartWithBarsNotRolledUp_out.pdf", (SaveOptions)options);The output from example 2
Customize Text with Task Bars
In this example, the text on the right of the taskbar can be customized by delegate instance. Here we customize the text on the critical tasks.
 1Project project = new Project();
 2
 3Task task1 = project.RootTask.Children.Add("Task 1");
 4Task task2 = project.RootTask.Children.Add("Task 2");
 5
 6task1.Set(Tsk.Duration, project.GetDuration(1, TimeUnitType.Day));
 7task2.Set(Tsk.Duration, project.GetDuration(1, TimeUnitType.Day));
 8
 9TaskLink link = project.TaskLinks.Add(task1, task2, TaskLinkType.FinishToStart);
10
11Task task3 = project.RootTask.Children.Add("Task 3");
12Resource resource1 = project.Resources.Add("Resource 1");
13Resource resource2 = project.Resources.Add("Resource 2");
14Resource resource3 = project.Resources.Add("Resource 3");
15
16ResourceAssignment assignment1 = project.ResourceAssignments.Add(task1, resource1);
17ResourceAssignment assignment2 = project.ResourceAssignments.Add(task2, resource2);
18ResourceAssignment assignment3 = project.ResourceAssignments.Add(task3, resource3);
19
20SaveOptions options = new PdfSaveOptions();
21options.Timescale = Timescale.ThirdsOfMonths;
22
23BarStyle style = new BarStyle();
24style.ItemType = BarItemType.CriticalTask;
25
26style.BarTextConverter = delegate (Task t)
27{
28  return string.Format("This task is on critical path");
29};
30
31BarStyle style2 = new BarStyle();
32style2.BarColor = Color.DarkOrchid;
33style2.ItemType = BarItemType.Task;
34
35options.BarStyles = new List<BarStyle>();
36options.BarStyles.Add(style);
37options.BarStyles.Add(style2);
38
39project.Save("output.pdf", options);Align Cell Contents
Text can be aligned by GanttChartColumn.StringAlignment, ResourceViewColumn.StringAlignment properties. Alignment by default is StringAlignment.Near (left).
 1Project project = new Project("New Project.mpp");
 2SaveOptions options = new PdfSaveOptions();
 3options.Timescale = Timescale.Months;
 4options.View = ProjectView.GetDefaultGanttChartView();
 5
 6GanttChartColumn column1 = options.View.Columns[2] as GanttChartColumn;
 7column1.StringAlignment = StringAlignment.Center;
 8column1 = options.View.Columns[3] as GanttChartColumn;
 9column1.StringAlignment = StringAlignment.Far;
10column1 = options.View.Columns[4] as GanttChartColumn;
11column1.StringAlignment = StringAlignment.Far;
12
13project.Save("AlignCellContents_GanttChart_out.pdf", options);
14
15options.PresentationFormat = PresentationFormat.ResourceSheet;
16options.View = ProjectView.GetDefaultResourceSheetView();
17
18ResourceViewColumn column2 = options.View.Columns[2] as ResourceViewColumn;
19column2.StringAlignment = StringAlignment.Center;
20column2 = options.View.Columns[3] as ResourceViewColumn;
21column2.StringAlignment = StringAlignment.Far;
22column2 = options.View.Columns[4] as ResourceViewColumn;
23column2.StringAlignment = StringAlignment.Far;
24
25project.Save("AlignCellContents_ResourceSheet_out.pdf", options);Changing Gantt Chart Bars Color Gradient
Microsoft Project allows users to render the output of Gantt charts using gradients. The same functionality is provided by Aspose.Tasks as shown in the following sample code.
1Project project = new Project("New Project.mpp");
2SaveOptions options = new XamlOptions();
3options.UseGradientBrush = false;
4project.Save("ChangeGanttBarsColorGradient_Solid_out.xaml", options);
5
6options.UseGradientBrush = true;
7project.Save("ChangeGanttBarsColorGradient_Gradient_out.xaml", options);Setting Start date of Gantt Chart View
The TimeScaleStart property exposed by Prj class allows to set the start date of the Gantt chart view. However, if the saved file is opened by MSP in maximized window mode then the timescale start date will not match.
1Project project = new Project("New Project.mpp");
2project.Set(Prj.TimescaleStart, new DateTime(2012, 4, 30));
3project.Save("SetGanttChartViewStartDate_out.mpp", SaveFileFormat.MPP);Aspose.Tasks for .NET provides comprehensive capabilities for exporting Gantt charts with full control over layout, style, and visual logic. Whether you’re generating visual reports, printing schedules, or embedding task data into dashboards — the flexible rendering engine supports your use case.
You can further explore: