Rendering Gantt Charts
Overview
Gantt charts are widely used to visualize project schedules, task hierarchies, durations, and dependencies. Aspose.Tasks for .NET enables developers to programmatically render Gantt charts to image formats such as JPEG, PNG, BMP, or multipage TIFF, supporting advanced customization of layout, colors, labels, timescale, and bar styles.
Microsoft Project lets users set the timescale that a Gantt chart is displayed in. (The timescale is indicated at the top of the Gantt chart view.) They can have up to three tiers of timescale to give them exactly the time resolution they need.
Aspose.Tasks for .NET supports this feature and lets you render Gantt charts with different timescale settings. Gantt charts can be rendered to one-page image using these options.
Supported Output Formats
Gantt charts can be exported to:
- JPEG/PNG/BMP — for embedding into documents or reports
- TIFF (Multipage) — for printing or archiving
- PDF — using
PdfSaveOptionsfor report-style rendering
Typical use cases include:
- Integration with internal dashboards or reporting engines
- Print-ready visuals for stakeholders
- Archiving project states for audit purposes
Setting Timescales and Saving to an Image
The ImageSaveOptions class’s Timescale property determines a project’s timescale settings. The timescale is set to Days by default. The other options are Month and Third of Months.
The following code sample:
- Reads a project file.
- Sets each different timescale setting.
- Saves the file to disk as a JPG.
 1Project project = new Project("New Project.mpp");
 2
 3// Save to one page image (Timescale.days by default)
 4project.Save("NewProductDevDays.jpeg", new ImageSaveOptions(SaveFileFormat.JPEG));
 5
 6// Save to one page image (Timescale.ThirdsOfMonths)
 7ImageSaveOptions options = new ImageSaveOptions(SaveFileFormat.JPEG);
 8options.Timescale = Timescale.ThirdsOfMonths;
 9
10project.Save("NewProductDevThirdsOfMonths.jpeg", options);
11
12// Save to one page image (Timescale.Months)
13options.Timescale = Timescale.Months;
14project.Save("NewProductDevMonths.jpeg", options);Key Rendering Settings
| Property | Description |
|---|---|
ImageSaveOptions.Timescale | Defines timeline scale (Days, Months, etc.) |
RollUpGanttBars | Enables rolled-up summary bars |
DrawNonWorkingTime | Toggles rendering of non-working hours/days |
TextFormatter | Customizes task labels dynamically |
StringAlignment | Controls alignment of text in columns |
UseGradientBrush | Enables MS Project–like gradient fill |
Rolling Up Gantt Bars During Rendering
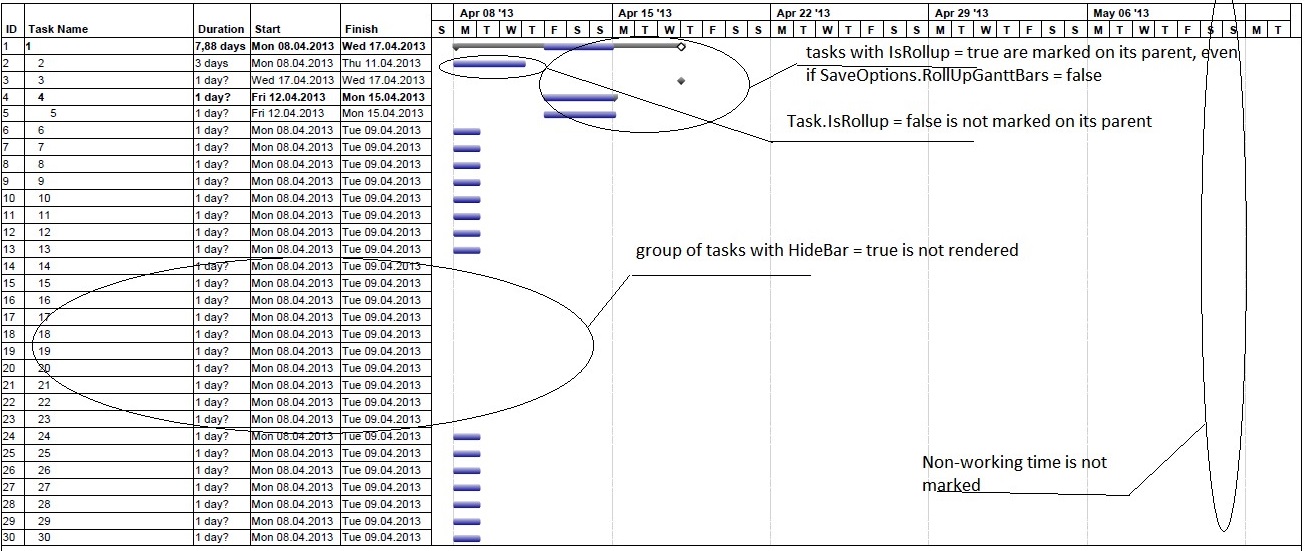
- If the SaveOptions.RollUpGanttBars property is set to true, any summary task in the project is marked by its visible subtasks, keeping into account the Task.HideBar property when rendering. (If Task.HideBar = true, the bar is not rendered on the Gantt chart.)
- If SaveOptions.RollUpGanttBars = false, the subtask will be shown on the summary task anyway, provided that subtask.IsRollup and subtask.ParentTask.IsRollup are set to true.
Also, if SaveOptions.DrawNonWorkingTime (default value = true) is set to false, non-working time will not be shown on the Gantt chart.
Example 1: Gantt Chart Bars Not Rolled Up
1PdfSaveOptions options = new PdfSaveOptions();
2options.PresentationFormat = PresentationFormat.GanttChart;
3options.FitContent = true;
4options.RollUpGanttBars = false;
5options.DrawNonWorkingTime = false;
6options.PageSize = PageSize.A3;
7Project project = new Project(file);
8project.Save("RenderGanttChartWithBarsNotRolledUp_out.pdf", (SaveOptions)options);The output from example 1
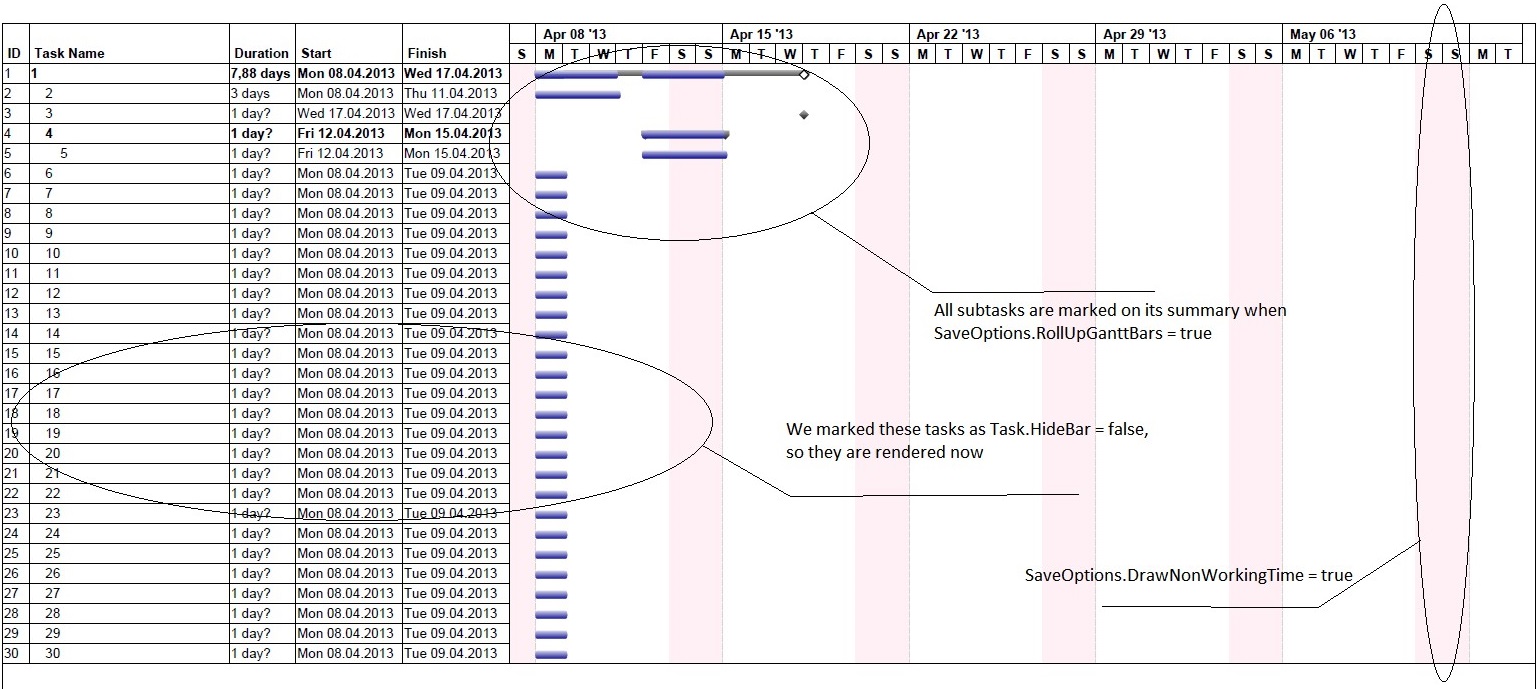
Example 2: Rolling Up Gantt Chart Bars
In this example, SaveOptions.RollUpGanttBars = true, SaveOptions.DrawNonWorkingTime = true, and task.HideBar = false for hidden tasks.
1PdfSaveOptions options = new PdfSaveOptions();
2options.PresentationFormat = PresentationFormat.GanttChart;
3options.FitContent = true;
4options.RollUpGanttBars = true;
5options.DrawNonWorkingTime = true;
6options.PageSize = PageSize.A3;
7
8Project project = new Project(fileName);
9project.Save("RenderGanttChartWithBarsNotRolledUp_out.pdf", (SaveOptions)options);The output from example 2
Customize Text with Task Bars
In this example, the text on the right of the taskbar can be customized by delegate instance. Here we customize the text on the critical tasks.
 1Project project = new Project();
 2
 3Task task1 = project.RootTask.Children.Add("Task 1");
 4Task task2 = project.RootTask.Children.Add("Task 2");
 5
 6task1.Set(Tsk.Duration, project.GetDuration(1, TimeUnitType.Day));
 7task2.Set(Tsk.Duration, project.GetDuration(1, TimeUnitType.Day));
 8
 9TaskLink link = project.TaskLinks.Add(task1, task2, TaskLinkType.FinishToStart);
10
11Task task3 = project.RootTask.Children.Add("Task 3");
12Resource resource1 = project.Resources.Add("Resource 1");
13Resource resource2 = project.Resources.Add("Resource 2");
14Resource resource3 = project.Resources.Add("Resource 3");
15
16ResourceAssignment assignment1 = project.ResourceAssignments.Add(task1, resource1);
17ResourceAssignment assignment2 = project.ResourceAssignments.Add(task2, resource2);
18ResourceAssignment assignment3 = project.ResourceAssignments.Add(task3, resource3);
19
20SaveOptions options = new PdfSaveOptions();
21options.Timescale = Timescale.ThirdsOfMonths;
22
23BarStyle style = new BarStyle();
24style.ItemType = BarItemType.CriticalTask;
25
26style.BarTextConverter = delegate (Task t)
27{
28  return string.Format("This task is on critical path");
29};
30
31BarStyle style2 = new BarStyle();
32style2.BarColor = Color.DarkOrchid;
33style2.ItemType = BarItemType.Task;
34
35options.BarStyles = new List<BarStyle>();
36options.BarStyles.Add(style);
37options.BarStyles.Add(style2);
38
39project.Save("output.pdf", options);Align Cell Contents
Text can be aligned by GanttChartColumn.StringAlignment, ResourceViewColumn.StringAlignment properties. Alignment by default is StringAlignment.Near (left).
 1Project project = new Project("New Project.mpp");
 2SaveOptions options = new PdfSaveOptions();
 3options.Timescale = Timescale.Months;
 4options.View = ProjectView.GetDefaultGanttChartView();
 5
 6GanttChartColumn column1 = options.View.Columns[2] as GanttChartColumn;
 7column1.StringAlignment = StringAlignment.Center;
 8column1 = options.View.Columns[3] as GanttChartColumn;
 9column1.StringAlignment = StringAlignment.Far;
10column1 = options.View.Columns[4] as GanttChartColumn;
11column1.StringAlignment = StringAlignment.Far;
12
13project.Save("AlignCellContents_GanttChart_out.pdf", options);
14
15options.PresentationFormat = PresentationFormat.ResourceSheet;
16options.View = ProjectView.GetDefaultResourceSheetView();
17
18ResourceViewColumn column2 = options.View.Columns[2] as ResourceViewColumn;
19column2.StringAlignment = StringAlignment.Center;
20column2 = options.View.Columns[3] as ResourceViewColumn;
21column2.StringAlignment = StringAlignment.Far;
22column2 = options.View.Columns[4] as ResourceViewColumn;
23column2.StringAlignment = StringAlignment.Far;
24
25project.Save("AlignCellContents_ResourceSheet_out.pdf", options);Changing Gantt Chart Bars Color Gradient
Microsoft Project allows users to render the output of Gantt charts using gradients. The same functionality is provided by Aspose.Tasks as shown in the following sample code.
1Project project = new Project("New Project.mpp");
2SaveOptions options = new XamlOptions();
3options.UseGradientBrush = false;
4project.Save("ChangeGanttBarsColorGradient_Solid_out.xaml", options);
5
6options.UseGradientBrush = true;
7project.Save("ChangeGanttBarsColorGradient_Gradient_out.xaml", options);Setting Start date of Gantt Chart View
The TimeScaleStart property exposed by Prj class allows to set the start date of the Gantt chart view. However, if the saved file is opened by MSP in maximized window mode then the timescale start date will not match.
1Project project = new Project("New Project.mpp");
2project.Set(Prj.TimescaleStart, new DateTime(2012, 4, 30));
3project.Save("SetGanttChartViewStartDate_out.mpp", SaveFileFormat.MPP);Aspose.Tasks for .NET provides comprehensive capabilities for exporting Gantt charts with full control over layout, style, and visual logic. Whether you’re generating visual reports, printing schedules, or embedding task data into dashboards — the flexible rendering engine supports your use case.
You can further explore: