Working with Views
Reading Specific View’s Data
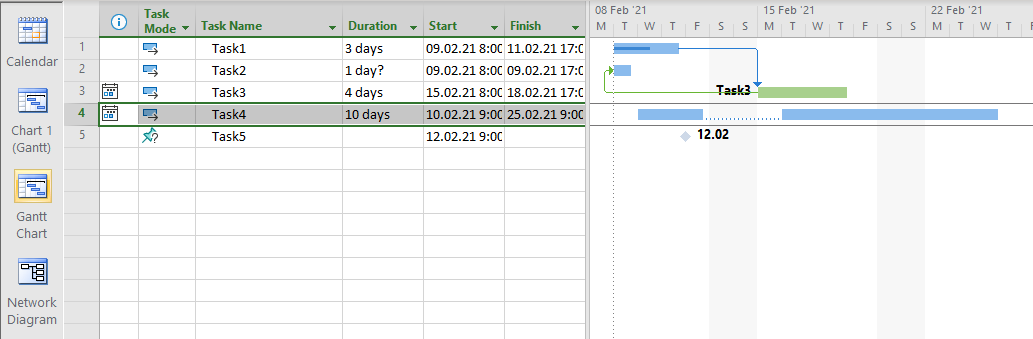
Views provide a graphical representation of a project or its elements (resources, tasks, etc). For example, a Gantt Chart shows a project’s progress and plans visually:
Microsoft Project allows users to customize different view properties such as bar styles, gridlines, progress lines, timescale information, and page setup. All these properties are stored in the MPP file. With Aspose.Tasks for .NET you can access and modify them programmatically through the View class or its derived classes: GanttChartView, TaskUsageView, and ResourceUsageView.
 1Project project = new Project("New Project.mpp");
 2
 3GanttChartView view = project.Views.ToList()[0] as GanttChartView;
 4Console.WriteLine("Is Bar Rounding: " + view.BarRounding);
 5Console.WriteLine("Show Bar Splits? : " + view.ShowBarSplits);
 6Console.WriteLine("Show Drawings? : " + view.ShowDrawings);
 7Console.WriteLine("Roll Up Gantt Bars? " + view.RollUpGanttBars);
 8Console.WriteLine("Hide Rollup Bars When Summary Expa0nded: " + view.HideRollupBarsWhenSummaryExpanded);
 9Console.WriteLine("Bar Size: " + view.BarSize.ToString());
10Console.WriteLine("Bar Style: " + view.BarStyles.Count);
11Console.WriteLine("************************ RETREIVING BAR STYLES INFORMATION FROM THE VIEW *********************");
12int i = 0;
13foreach (GanttBarStyle barStyle in view.BarStyles)
14{
15    Console.WriteLine("Name: " + barStyle.Name);
16    Console.WriteLine("ShowFor: " + barStyle.ShowFor.ToString());
17    Console.WriteLine("Row: " + barStyle.Row);
18    Console.WriteLine("From: " + barStyle.From);
19    Console.WriteLine("To: " + barStyle.To);
20    Console.WriteLine("MiddleShape: " + barStyle.MiddleShape);
21    Console.WriteLine("MiddleShapeColor: " + barStyle.MiddleShapeColor);
22    Console.WriteLine("StartShape: " + barStyle.StartShape);
23    Console.WriteLine("EndShape: " + barStyle.EndShape);
24    Console.WriteLine("EndShapeColor: " + barStyle.EndShapeColor);
25    i++;
26}
27
28Console.WriteLine("Grid Lines Count: " + view.Gridlines.Count);
29Gridlines gridlines = view.Gridlines[0];
30Console.WriteLine("************************ RETREIVING GRID LINES PROPERTIES *********************");
31Console.WriteLine("GridLine Type: " + gridlines.Type);
32Console.WriteLine("Gridlines Internval: " + gridlines.Interval);
33Console.WriteLine("Gridlines Color: " + gridlines.NormalColor);
34Console.WriteLine("Gridlines NormalPattern: " + gridlines.NormalPattern);
35Console.WriteLine("Gridlines IntervalPattern: " + gridlines.IntervalPattern);
36Console.WriteLine("Gridlines IntervalColor: " + gridlines.IntervalColor);
37Console.WriteLine("************************ RETREIVING PROGRESS LINES PROPERTIES *********************");
38Console.WriteLine("ProgressLInes.BeginAtDate: ", view.ProgressLines.BeginAtDate);
39Console.WriteLine("ProgressLines.isBaselinePlan: " + view.ProgressLines.IsBaselinePlan);
40Console.WriteLine("ProgressLines.DisplaySelected: " + view.ProgressLines.DisplaySelected);
41Console.WriteLine("ProgressLines.SelectedDates.Count: " + view.ProgressLines.SelectedDates.Count);
42Console.WriteLine("ProgressLines.SelectedDates[0]: " + view.ProgressLines.SelectedDates[0]);
43Console.WriteLine("ProgressLines.SelectedDates[1]: " + view.ProgressLines.SelectedDates[1]);
44Console.WriteLine("ProgressLines.SelectedDates[2]: " + view.ProgressLines.SelectedDates[2]);
45Console.WriteLine("ProgressLines.DisplayAtRecurringIntervals: " + view.ProgressLines.DisplayAtRecurringIntervals);
46Console.WriteLine("ProgressLines.RecurringInterval.Interval: " + Interval.Weekly, view.ProgressLines.RecurringInterval.Interval);
47Console.WriteLine("ProgressLines.RecurringInterval.WeeklyDays.Count" + view.ProgressLines.RecurringInterval.WeeklyDays.Count);
48Console.WriteLine("Recurring Interval.WeeklyDays: " + view.ProgressLines.RecurringInterval.WeeklyDays);
49Console.WriteLine("Recurring Interval.DayType.Saturday: " + view.ProgressLines.RecurringInterval.WeeklyDays);
50Console.WriteLine("Recurring Interval.DayType.Sunday: " + view.ProgressLines.RecurringInterval.WeeklyDays);
51Console.WriteLine("ProgressLines.ShowDate: " + view.ProgressLines.ShowDate);
52Console.WriteLine("ProgressLines.ProgressPointShape: " + view.ProgressLines.ProgressPointShape.ToString());
53Console.WriteLine("ProgressLines.ProgressPointColor: " + view.ProgressLines.ProgressPointColor);
54Console.WriteLine("ProgressLines.LineColor: " + Color.Red, view.ProgressLines.LineColor);
55Console.WriteLine("ProgressLines.LinePattern: " + LinePattern.Solid, view.ProgressLines.LinePattern);
56Console.WriteLine("ProgressLines.OtherProgressPointShape: " + view.ProgressLines.OtherProgressPointShape.ToString());
57Console.WriteLine("ProgressLines.OtherProgressPointColor: " + view.ProgressLines.OtherProgressPointColor.ToString());
58Console.WriteLine("ProgressLines.OtherLineColor: " + view.ProgressLines.OtherLineColor);
59Console.WriteLine("************************ BOTTOM TIMESCALE IFORMATION ******************");
60Console.WriteLine("BottomTimescaleTier.Count:" + view.BottomTimescaleTier.Count);
61Console.WriteLine("BottomTimescaleTier.Unit:" + TimescaleUnit.Days, view.BottomTimescaleTier.Unit.ToString());
62Console.WriteLine("BottomTimescaleTier.UsesFiscalYear: " + view.BottomTimescaleTier.UsesFiscalYear);
63Console.WriteLine("BottomTimescaleTier.Alignment: " + StringAlignment.Center, view.BottomTimescaleTier.Alignment.ToString());
64Console.WriteLine("BottomTimescaleTier.ShowTicks: " + view.BottomTimescaleTier.ShowTicks.ToString());
65Console.WriteLine("BottomTimescaleTier.Label:" + DateLabel.DayDi, view.BottomTimescaleTier.Label);
66Console.WriteLine("************************ MIDDLE TIMESCALE IFORMATION ******************");
67Console.WriteLine("MiddleTimescaleTier.Count:" + view.MiddleTimescaleTier.Count);
68Console.WriteLine("MiddleTimescaleTier.Unit:" + TimescaleUnit.Days, view.MiddleTimescaleTier.Unit.ToString());
69Console.WriteLine("MiddleTimescaleTier.UsesFiscalYear: " + view.MiddleTimescaleTier.UsesFiscalYear);
70Console.WriteLine("MiddleTimescaleTier.Alignment: " + StringAlignment.Center, view.MiddleTimescaleTier.Alignment.ToString());
71Console.WriteLine("MiddleTimescaleTier.ShowTicks: " + view.MiddleTimescaleTier.ShowTicks.ToString());
72Console.WriteLine("MiddleTimescaleTier.Label:" + DateLabel.DayDi, view.MiddleTimescaleTier.Label);
73Console.WriteLine("************************ TOP TIMESCALE IFORMATION ******************");
74Console.WriteLine("TopTimescaleTier.Unit:" + TimescaleUnit.Days, view.TopTimescaleTier.Unit.ToString());
75Console.WriteLine("TopTimescaleTier.UsesFiscalYear: " + view.TopTimescaleTier.UsesFiscalYear);
76Console.WriteLine("TopTimescaleTier.Alignment: " + StringAlignment.Center, view.TopTimescaleTier.Alignment.ToString());
77Console.WriteLine("TopTimescaleTier.ShowTicks: " + view.TopTimescaleTier.ShowTicks.ToString());
78Console.WriteLine("TopTimescaleTier.Label: ", view.TopTimescaleTier.Label.ToString()); In this code snippet, the Gantt Chart view is accessed directly, making it possible to read and work with its stored properties such as timescale, formatting, or display rules.
Configure Gantt Chart View by Showing Selected Custom Fields
Extended attributes can be added to tasks in a project. Sometimes it is necessary to automatically display specific custom fields in the Gantt Chart view rather than selecting them manually. The following code shows how to customize the project table to achieve this.
 1Project project = new Project("New Project.mpp");
 2
 3// Create a new project task
 4Task task = project.RootTask.Children.Add("New Activity");
 5
 6// Define new custom attribute
 7ExtendedAttributeDefinition text1Definition = ExtendedAttributeDefinition.CreateTaskDefinition(ExtendedAttributeTask.Text1, null);
 8project.ExtendedAttributes.Add(text1Definition);
 9// Add custom text attribute to created task.
10task.ExtendedAttributes.Add(text1Definition.CreateExtendedAttribute("Activity attribute"));
11
12// Customize table by adding text attribute field
13TableField attrField = new TableField();
14attrField.Field = Field.TaskText1;
15attrField.Width = 20;
16attrField.Title = "Custom attribute";
17attrField.AlignTitle = StringAlignment.Center;
18attrField.AlignData = StringAlignment.Center;
19Table table = project.Tables.ToList()[0];
20table.TableFields.Insert(3, attrField);
21
22project.Save("ConfigureTheGantChartViewShowSelectedColumnFields_out.mpp", new MPPSaveOptions() { WriteViewData = true });This approach ensures that selected custom fields appear by default in the exported MPP view.
Customizing Timescale Tier Labels according to Current Culture Information
Aspose.Tasks for .NET allows customizing timescale tier labels according to the system’s CultureInfo. The DateTimeConverter delegate provides control over how dates are rendered in timescale tiers.
 1Project project = new Project("New Project.mpp");
 2
 3// Add task links
 4project.TaskLinks.Add(project.RootTask.Children.Add("Task 1"), project.RootTask.Children.Add("Task 2"));
 5
 6GanttChartView view = (GanttChartView)project.DefaultView;
 7
 8// This code is added for better visualization
 9view.MiddleTimescaleTier.Unit = TimescaleUnit.Months;
10project.Set(Prj.TimescaleStart, new DateTime(2012, 8, 6));
11
12// Customize middle tier dates
13view.MiddleTimescaleTier.DateTimeConverter =
14date => new[] { "Янв.", "Фев.", "Мар.", "Апр.", "Май", "Июнь", "Июль", "Авг.", "Сен.", "Окт.", "Ноя.", "Дек." }[date.Month - 1];
15project.Save("CustomizeTimescaleTierLabels_out.pdf", SaveFileFormat.PDF);This snippet demonstrates how to format timescale labels dynamically, ensuring that localized date formats are respected in exported project views.
Customizing Timescale Settings for a Specific View
The TimescaleTier class lets developers define precise timescale settings for a project view. The example below shows how to adjust bottom and middle tiers and render the project with these settings.
 1	Project project = new Project();
 2	GanttChartView view = (GanttChartView)project.Views.First(v => v.Name == "&Gantt Chart");
 3
 4	// Configure timescale tiers
 5	view.BottomTimescaleTier.Count = 2;
 6	view.BottomTimescaleTier.ShowTicks = false;
 7	view.BottomTimescaleTier.Unit = TimescaleUnit.Days;
 8	view.BottomTimescaleTier.Label = DateLabel.DayDdd;
 9
10	view.MiddleTimescaleTier.Count = 1;
11	view.MiddleTimescaleTier.Unit = TimescaleUnit.Weeks;
12	view.MiddleTimescaleTier.Label = DateLabel.WeekDddDd;
13
14	// Save with custom timescale settings
15	PdfSaveOptions saveOptions = new PdfSaveOptions();
16	saveOptions.ViewSettings = view;
17	saveOptions.Timescale = Timescale.DefinedInView;
18	project.Save("SetTimeScaleCount_out.pdf", saveOptions);
This allows generating project outputs where the time granularity matches reporting requirements.
Support for Text Styling
Text styling can be applied to Gantt Chart views using the TableTextStyle class. The following code demonstrates how to set custom text formatting:
1Project project = new Project("New Project.mpp");
2GanttChartView ganttChartView = project.Views.ToList()[0] as GanttChartView;
3if (ganttChartView != null)
4{
5    ganttChartView.TableTextStyles.Clear();
6    ganttChartView.TableTextStyles.Add(new TableTextStyle(1) { Color = Color.Red, Field = Field.TaskName });
7    ganttChartView.TableTextStyles.Add(new TableTextStyle(1) { Color = Color.Gray, Field = Field.TaskDurationText });
8    ganttChartView.TableTextStyles.Add(new TableTextStyle(2) { Color = Color.Blue, FontStyle = FontStyle.Bold | FontStyle.Italic | FontStyle.Underline });
9}This feature is useful for emphasizing key fields or improving the readability of exported project documents.
Save MPP Using a Specific Project View
Aspose.Tasks allows saving an MPP file into graphical formats using a specific view defined in the project. This feature is handy when multiple views exist and only one of them needs to be exported.
1	Project project = new Project("TestViews.mpp");
2	var view = project.Views.First(v => v.Name == "Customized Resource &Sheet");
3	view.PageInfo.PageSettings.IsPortrait = false;
4
5	PdfSaveOptions saveOptions = new PdfSaveOptions();
6	saveOptions.ViewSettings = view;
7	project.Save("output.pdf", saveOptions);
This ensures flexibility when exporting tailored views for different stakeholders.
Working with Bar Styles of Gantt Chart View
The Gantt Chart view supports both task-specific and category-specific bar styles.
The following code shows how to modify them for better visualization.
 1	Project project = new Project("TestGanttChartView.mpp");
 2	var ganttChartView = (GanttChartView)project.Views.First(v => v.Name == "Gantt &Chart");
 3
 4	PdfSaveOptions saveOptions = new PdfSaveOptions();
 5	saveOptions.ViewSettings = ganttChartView;
 6	saveOptions.Timescale = Timescale.DefinedInView;
 7
 8	// Modify custom bar styles
 9	foreach (GanttBarStyle ganttBarStyle in ganttChartView.CustomBarStyles)
10	{
11		if (ganttBarStyle.ShowForTaskUid == 11)
12		{
13			ganttBarStyle.LeftField = Field.TaskName;
14			ganttBarStyle.InsideBarTextConverter = task => "Hours rem.: " +
15				(int)task.Get(Tsk.RemainingWork).TimeSpan.TotalHours;
16		}
17	}
By customizing bar styles, you can highlight tasks, milestones, and progress indicators in exported project views.
Conclusion
Aspose.Tasks for .NET provides extensive functionality for working with project views. Developers can read and customize Gantt Charts, configure timescale tiers, apply text styles, save MPP files with specific views, and modify bar styles. These features allow creating highly customized reports and ensuring that exported project data meets business and presentation needs.
Quick Links
- Printing Project Pages to Separate Files
- Remove Gap Between Tasks List and Footer
- Rendering Notes When Converting Project Views
FAQ
Q: Do I need Microsoft Project installed to work with views?
- No. Aspose.Tasks for .NET works independently of Microsoft Project.
Q: Can I customize which fields are displayed in a Gantt Chart?
- Yes. You can configure tables to automatically show selected custom fields.
Q: Does Aspose.Tasks support localized timescale labels?
- Yes. Timescale tier labels can be customized according to the current
CultureInfo.
Q: Is it possible to export only one view from a project file?
- Yes. You can select a specific view and export it to PDF, image, or HTML formats.
Q: Can bar styles in Gantt Charts be customized programmatically?
- Yes. Both task-specific and category-specific bar styles can be modified through the API.