LaTeX の表
1. はじめに
表は、学術・ビジネス文書の明瞭さ、構成、視覚的魅力を高める重要な役割を果たします。複雑なデータや比較、関係性を構造化された、わかりやすい形式で提示する強力な手段です。その重要性を簡単にまとめると次の通りです。
データ要約: 表は、複数の段落で説明しなければならない情報を凝縮して示します。大量のデータを簡潔に提示でき、読者が要点を把握しやすくなります。
明快な可視化: 統計数値、調査結果、実験結果などの複雑なデータも、表を使うと効果的に提示できます。列と行の配置により、トレンドやパターン、外れ値を容易に見つけられます。
比較分析: 表は、異なるデータ集合を横に並べて比較できるようにします。製品仕様、財務実績、研究変数などを比較する際に、読者は一目で有意義な結論を導き出せます。
論理的な構成: 行と列にデータを分けることで、カテゴリ別に情報を整理できます。これにより読者は目的の情報をすぐに見つけられます。
データの完全性: 学術・ビジネスの場では、データの正確性が最重要です。表は、生データを直接示すことで、文章での説明による誤解のリスクを減らします。
参照と引用: ラベル付けされた表は、文中で特定の表を指し示す参照ポイントになります。読者は議論に沿って該当表をすぐに確認できます。
視覚的エンゲージメント: デザインの良い表は、テキストの単調さを和らげ、読者の興味を引きつけます。文書全体の美観とプロフェッショナリズムを向上させます。
効率的な情報取得: 忙しい研究者や実務家は、素早く情報を抜き出す必要があります。表は、段落を読むことなく目的のデータや詳細をすぐに見つけられます。
標準化: 学術研究では、実験手法、結果、統計解析などを示す標準化された表が頻繁に使用されます。これにより出版物間の一貫性が保たれ、再現性が向上します。
要するに、表は情報ハブとして機能し、データ主導の洞察を構造化かつ読者フレンドリーに提示します。その情報伝達力とアクセシビリティの高さは、学術・ビジネスコミュニケーションに不可欠です。
次に、LaTeX という強力な組版システムに目を向けましょう。LaTeX は従来のワードプロセッサの限界を超え、特に表組みの処理において高精度・エレガンス・汎用性を提供します。
LaTeX は単なる文書作成ツールではなく、タイポグラフィとテクノロジーが融合した芸術です。学術論文、レポート、プレゼンテーション、書籍の作成において、見た目の美しさと情報の明瞭さを両立させます。特に、複雑な表構造はデータ表現の基盤となります。
LaTeX では、表内情報の配置は単なる格子以上のものです。配置・間隔・スタイルが調和した「交響曲」のようにデータを洗練して提示します。表は視覚的ナラティブとなり、複雑なデータセットや関係性を優雅かつ正確に伝えます。
列幅の制御、セルの罫線・シェーディング、数式や記号の直接埋め込みなど、豊富なツールとパッケージが用意されており、あらゆる目的に合わせた表を作成できます。
美しさだけでなく、LaTeX はクロスリファレンス機構により表を文書内のナビゲーションポイントにし、マルチロウ/マルチカラムレイアウトで高度なデータ提示も可能にします。
このように、LaTeX は科学者・専門家・研究者にとって欠かせないツールです。注目を集め、情報を説得的に提示し、文書全体のインパクトを高める表作成技術を身につけましょう。
2. LaTeX の表の基本
LaTeX における表の根幹は tabular 環境です。ここで列・行・セルの内容を定義し、構造化された視覚的に整った表を作ります。
基本的な構成要素は次のとおりです。
tabular環境の開始: 表はtabular環境で囲みます。この環境で表のレイアウトを指定します。列の指定:
tabular環境内で列数と配置を指定します。l(左揃え)、c(中央揃え)、r(右揃え)が基本です。また、縦線で区切る列や外枠線も指定できます。行の内容: 各行はセルの内容を
&で区切り、行末は\\で終えます。水平線:
\hlineコマンドで行間や外枠に水平線を挿入できます。
簡単な例
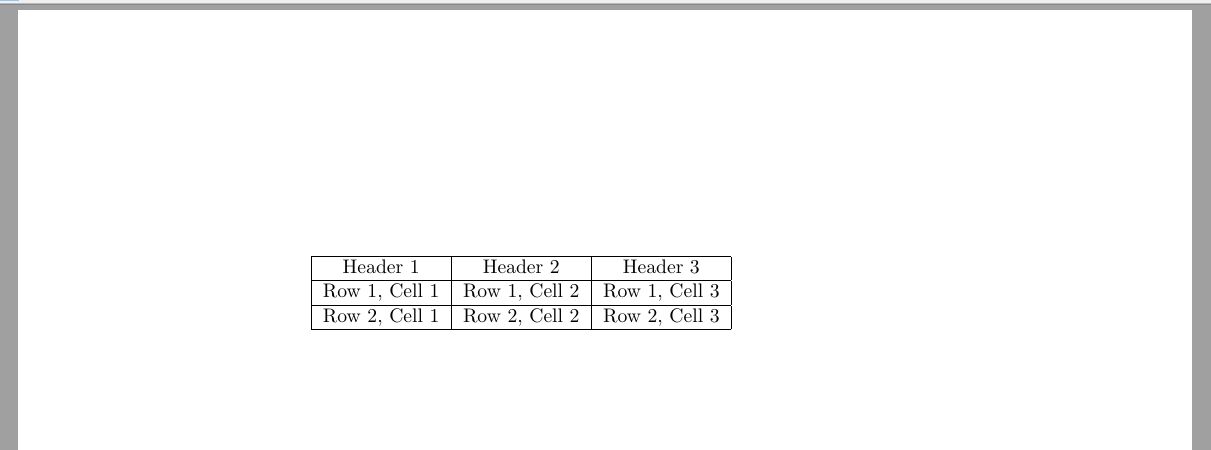
以下は基本的な LaTeX 表の例です。
1\begin{tabular}{|c|c|c|}                             \hline
2    Header 1 & Header 2 & Header 3 \\                \hline
3    Row 1, Cell 1 & Row 1, Cell 2 & Row 1, Cell 3 \\ \hline
4    Row 2, Cell 1 & Row 2, Cell 2 & Row 2, Cell 3 \\ \hline
5\end{tabular}
この例では 3 列の中央揃え表を作成しています。出力は次のとおりです。
次の例は左寄せ・右寄せ列を混在させた表です。
1\begin{tabular}{|l r||}
2  \hline
3  Company & Income \\            \hline \hline
4  Pinapple Computer & \$150M \\
5  Megasoft & \$210M \\
6  General Waters Ltd. & \$98M \\
7  Alphamet & \$2117M \\           \hline
8\end{tabular}
右外枠は二重線、ヘッダーも二重線で区切られ、列間の縦線はありません。

全幅に渡らない水平線も描けます。
1\begin{tabular}{|r|l|}         \hline
2  9D5 & hexadecimal \\
3  4725 & octal \\              \cline{2-2}
4  1001 1101 0101 & binary \\   \hline \hline
5  2517 & decimal \\            \hline
6\end{tabular}
\cline{i-j} は i 列目から j 列目までの線を引くコマンドです。

列幅を固定した「段落」列も作れます。p{幅} を使います。
1\begin{tabular}{|p{3cm}|p{2cm}|}            \hline
2  A short text. & A very very long text. \\ \hline
3  A very very long text. \newline And some more text in a new line. & A short text. \\ \hline
4\end{tabular}
\newline の使用例です。

array パッケージを読み込むと、固定幅列に m{幅}(セル内容を中央揃え)や b{幅}(下揃え)も利用できます。
表を段落中にインラインで入れたい場合、ベースライン位置を指定できます。[t], [c], [b] オプションで上・中央・下揃えを選択します。
1This is the text of the paragraph
2\begin{tabular}[t]{|r|l|}     \hline
3  9D5 & hexadecimal \\
4  4725 & octal \\             \cline{2-2}
5  1001 1101 0101 & binary \\  \hline \hline
6  2517 & decimal \\           \hline
7\end{tabular}
8that include a table.
ここではベースラインを表の下部に合わせています。

複数列の一括指定
同一揃えの列が多数ある場合は *{num}{format} 構文で一括指定できます。
1\begin{tabular}{l*{7}{c}r}
2  Employee   & Sun & Mon & Tue & Wed & Thu & Fri & Sat & Total \\ \hline
3  John Doe   &     &  x  &     &     &     &  x  &     &   2   \\
4  Dean Jones &  x  &     &  x  &     &  x  &     &     &   3   \\
5  Chris Cross&     &     &     &  x  &     &     &     &   1   \\
6  Pete Brad  &     &     &     &     &     &     &  x  &   1
7\end{tabular}
>{\command} と <{\command} を用いた列指定
array パッケージがあると、列要素の前後にコマンドを挿入できます。以下は 2 列を中央揃えにし、左列を太字にする例です。
1\begin{tabular}{>{\centering\textbf\bgroup}p{3.5cm}<{\egroup}>|{\centering}p{3.5cm} }
2  History & Geometry
3  \tabularnewline \hline
4  Ancient & Elementary
5  \tabularnewline
6  Medieval & Affine
7  \tabularnewline
8  Modern & Analytic
9\end{tabular}
3. 表レイアウトのカスタマイズ
LaTeX の表では、間隔調整が重要です。適切な余白は可読性を高め、内容が詰まりすぎるのを防ぎます。主な調整項目は次のとおりです。
列間の間隔
列間の余白はデフォルトで \setlength{\tabcolsep}{value} で変更できます。値を大きくすれば列間が広がります。デフォルトは 6pt。
行間の間隔
行間は \renewcommand{\arraystretch}{value} で調整します。値を大きくすると行が伸び、垂直方向の余白が増えます。デフォルトは 1.0。
行末に \\[skip] と書くことで、特定の行だけスキップ幅を指定することもできます。
1\begin{tabular}{cl} \hline
2  Level & Complexity \\ [1cm]
3  1 & Simple \\
4  2 & Intermediate \\
5  3 & Complex \\ \hline
6\end{tabular}
@ と ! を用いた表現
array パッケージが読み込まれていると、@{...} または !{...} で列区切り文字をカスタマイズできます。@{...} は列間のスペースを置き換え、空にすれば間隔を消せます。
次の基本的な表を例にします。
1\begin{tabular}{|l|l|}
2  \hline
3  1.1 & 1.2 \\ \hline
4  2.1 & 2.2 \\
5  \hline
6\end{tabular}
列記述を変えると次のようになります。

元の間隔を保ちつつ変えたい場合は !{...} を使います。

小数点で揃える例:
1\begin{tabular}{r@{.}l}
2  3 & 14159 \\
3  16 & 2 \\
4  123 & 456 \\
5\end{tabular}
dcolumn パッケージの使用
dcolumn パッケージは小数点で揃える新しい列指定子 d を提供します。以下は基本的な使用例です。
1\usepackage{dcolumn}
2................................................
3\newcolumntype{d}[1]{D{.}{\cdot}{#1} } % #1 は小数点以下の最大桁数
4\begin{tabular}{l r c d{1} }
5  Left&Right&Center&\mathrm{Decimal}\\
6  1&2&3&4\\
7  11&22&33&44\\
8  1.1&2.2&3.3&4.4\\
9\end{tabular}
小数点揃え列は数式モードで組版されるため、ヘッダーには \mathrm を使っています。ヘッダーがテキストの場合は、\multicolumn{1}{c}{Decimal} のように \multicolumn で中央揃えにすると見た目が良くなります。
4. セルの結合
水平・垂直にセルを結合したやや複雑な表を作成できます。
複数列にまたがるセル
セルを複数列に跨げる基本構文は \multicolumn{num_cols}{alignment}{contents} です。num_cols は結合列数、alignment は l, c, r または p{幅}、contents がセルの内容です。
例:
 1\begin{tabular}{|l|l|}
 2  \hline
 3  \multicolumn{2}{|c|}{Available currencies} \\
 4  \hline
 5  CNY & Chinese Yuan \\
 6  JPY & Japanese Yen \\
 7  GBP & Great Britain Pound \\
 8  USD & US Dollar \\
 9  CAD & Canadian Dollar \\
10  EUR & Euro \\
11  \hline
12\end{tabular}
複数行にまたがるセル
multirow パッケージを使用します。構文は \multirow{num_rows}{width}{contents} です。
 1\begin{tabular}{|l|l|l|}
 2  \hline
 3  \multicolumn{3}{ |c| }{Available currencies} \\
 4  \hline
 5  South America & BRL & Brazilian Real \\ \hline
 6  \multirow{3}{*}{Asia} & CNY & Chinese Yuan \\
 7   & JPY & Japanese Yen \\
 8   & HKD & Hong Kong Dollar \\ \hline
 9  \multirow{3}{*}{Europe} & EUR & Euro \\
10   & GBP & Great Britain Pound \\
11   & CHF & Swiss Franc \\ \hline
12  Oceania & AUD & Australian Dollar \\ \hline
13  \multirow{2}{*}{North America} & USD & US Dollar \\
14   & CAD & Canadian Dollar \\
15  \hline
16\end{tabular}
multirow を使う場合、結合対象の下の行では空セルを入れる必要があります。
両方向に跨ぐセル
以下は横方向・縦方向に同時に跨がるセルの例です。
 1\begin{tabular}{cc|c|c|c|c|l}
 2  \cline{3-6}
 3  & & \multicolumn{4}{ c| }{Primes} \\ \cline{3-6}
 4  & & 2 & 3 & 5 & 7 \\ \cline{1-6}
 5  \multicolumn{1}{ |c }{\multirow{2}{*}{Powers} } &
 6    \multicolumn{1}{ |c| }{504} & 3 & 2 & 0 & 1 & \\ \cline{2-6}
 7  \multicolumn{1}{ |c }{} &
 8    \multicolumn{1}{ |c| }{540} & 2 & 3 & 1 & 0 & \\ \cline{1-6}
 9  \multicolumn{1}{ |c }{\multirow{2}{*}{Powers} } &
10    \multicolumn{1}{ |c| }{gcd} & 2 & 2 & 0 & 0 & min \\ \cline{2-6}
11  \multicolumn{1}{ |c }{} &
12    \multicolumn{1}{ |c| }{lcm} & 3 & 3 & 1 & 1 & max \\ \cline{1-6}
13\end{tabular}
\multicolumn{1}{ は左右両端の罫線を描くために使用します。multirow と組み合わせても、最初の行だけ垂直罫線が描かれるので、続く行でも \multicolumn{1}{ を付けて補完します。

5. 表のサイズ調整
graphicx パッケージの \resizebox{width}{height}{object} を使うと、tabular 環境を指定した幅・高さに伸縮できます。以下は幅 12 cm にリサイズし、アスペクト比は保つ例です。
1\resizebox{12cm}{!} {
2  \begin{tabular}{|c|c|c|}                           \hline
3    Header 1 & Header 2 & Header 3 \\                \hline
4    Row 1, Cell 1 & Row 1, Cell 2 & Row 1, Cell 3 \\ \hline
5    Row 2, Cell 1 & Row 2, Cell 2 & Row 2, Cell 3 \\ \hline
6  \end{tabular}
7}
同様に \scalebox{ratio}{object} で比率指定も可能です。
1\scalebox{0.7}{
2  \begin{tabular}...
3  \end{tabular}
4}
6. 表の配置
table 環境に入れるとページ上の配置が簡単に制御できます。
1\begin{table}[positioning_option]
2  \centering
3  \begin{tabular}{...}
4    ...
5  \end{tabular}
6\end{table}
利用できる配置オプションは次のとおりです。
h– ここ におおよそ配置t– ページ 上部 に配置b– ページ 下部 に配置p– 表専用の別ページに配置!– LaTeX の内部パラメータを上書きH– 正確にこの場所 に配置(h!に相当)
table 環境内で \centering を付けると横方向の中央揃えができます。
7. キャプション・ラベル・参照
\caption で表にキャプションを付けられます。出力では「Table N.」という接頭辞が自動付与されます。\label と \ref を使うと、文書中の任意の場所から表を参照できます。
例:
 1Table \ref{table:1} is an example of a referenced \LaTeX{} element.
 2
 3\begin{table}[h!]
 4  \centering
 5  \begin{tabular}{|c|c|c|} \hline
 6    Header 1 & Header 2 & Header 3 \\                \hline
 7    Row 1, Cell 1 & Row 1, Cell 2 & Row 1, Cell 3 \\ \hline
 8    Row 2, Cell 1 & Row 2, Cell 2 & Row 2, Cell 3 \\ \hline
 9  \end{tabular}
10  \caption{A caption for the table.}
11  \label{table:1}
12\end{table}
1 行目の参照は \label が付与した番号に自動置換されます。

8. 表の色付け
行の色を変える
xcolor パッケージに table オプションを付けて読み込むと、行ごとに異なる色を付けられます。\rowcolors{starting_row}{odd_color}{even_color} を tabular 環境の前に置きます。
 1\begin{center}
 2  \rowcolors{2}{green}{pink}
 3
 4  \begin{tabular}{lll}
 5    \multicolumn{3}{c}{The header} \\
 6    odd & odd & odd \\
 7    even & even & even\\
 8    \hiderowcolors odd & odd & odd \\
 9    \showrowcolors even & even & even\\
10     even & even & even\\
11  \end{tabular}
12\end{center}
\hiderowcolors はその行以降のハイライトを停止し、\showrowcolors で再開します。

個別セルの色付け
xcolor で特定セルに色を付けることもできます。
 1\begin{tabular}{|l|l|l|}
 2  \multicolumn{3}{c}{The header} \\
 3  \hline
 4  \cellcolor{red} odd & odd & odd \\
 5  \hline
 6  even & \cellcolor{red} even & even\\
 7  \hline
 8  odd & odd & \cellcolor{red} odd \\
 9  \hline
10\end{tabular}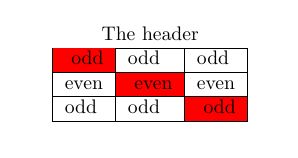
colortbl パッケージの使用
colortbl は \columncolor コマンドで列全体の色を指定できます。array パッケージも同時に読み込む必要があります(xcolor も忘れずに)。
1\begin{tabular}{|>{\columncolor{green}}l|>{\color{white}\columncolor{red}}c|}
2  one & two\\
3  three & four
4\end{tabular}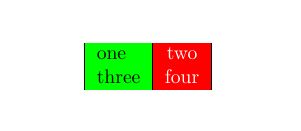
行の色は \rowcolor で指定し、行の先頭で使用します。構文は \columncolor と同じです。
1\begin{tabular}{l|c|}
2  \rowcolor{green} one & two\\
3  \rowcolor{red} three & four
4\end{tabular}
縦罫線にも色を付けられます。
1\setlength{\arrayrulewidth}{2pt}
2\begin{tabular}{!{\color{blue}\vline} l !{\color{blue}\vline} l !{\color{blue}\vline}
3    l !{\color{blue}\vline}}
4  \multicolumn{3}{c}{The header} \\
5  odd & odd & odd \\
6  even & even & even\\
7  odd & odd & odd \\
8\end{tabular}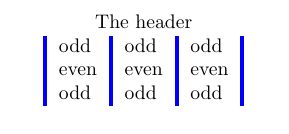
\\arrayrulewidth の設定で罫線の太さを変更できます。
\hline や \cline に色を付けるのはやや手間がかかりますが、\arrayrulecolor を使えば全体または局所的に色を変更できます。
 1\setlength\arrayrulewidth{2pt}
 2%\arrayrulecolor{blue} % すべての罫線を青に
 3\begin{tabular}{|l!{\color{green}\vline}l|l|}
 4  \multicolumn{3}{c}{The header} \\
 5  \hline
 6  odd & odd & odd \\
 7  \arrayrulecolor{blue} \hline
 8  even & even & even\\
 9  \hline
10  odd & odd & odd \\ \arrayrulecolor{red}
11  \hline
12\end{tabular}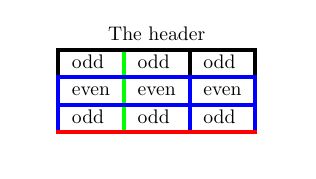
9. 長い表の作成
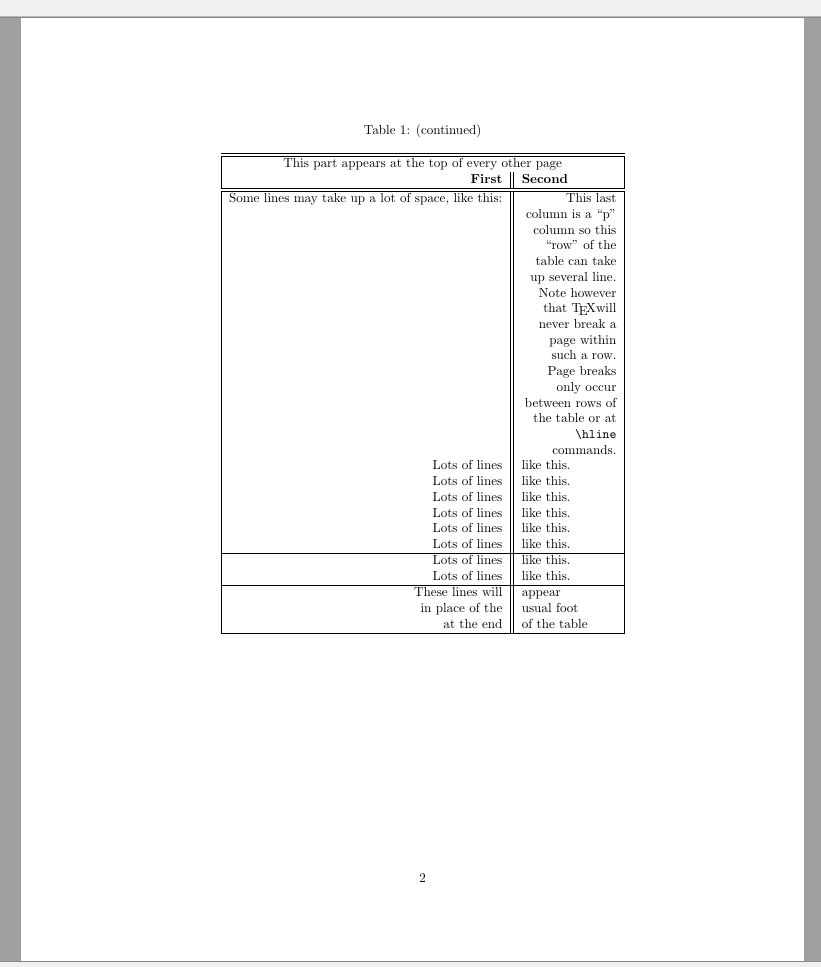
tabular 環境はページ分割ができません。長い表はページ下部で途切れてしまいます。そこで longtable パッケージを使用します。longtable は tabular と同様の構文ですが、ページ跨ぎが可能です。
以下は longtable の主な機能を示す例です。
 1\begin{longtable}{|r||p{1in}|}
 2  \caption[An optional table caption ...]{A long table\label{long}}\\
 3  \hline\hline
 4  \multicolumn{2}{|c|}{This part appears at the top of the table}\\
 5  \textsc{First}&\textsc{Second}\\
 6  \hline\hline
 7  \endfirsthead % 1 ページ目の上部に表示
 8
 9  \caption[]{(continued)}\\
10  \hline\hline
11  \multicolumn{2}{|c|}{This part appears at the top of every other page}\\
12  \textbf{First}&\textbf{Second}\\
13  \hline\hline
14  \endhead % 2 ページ目以降の上部に表示
15
16  \hline
17  This goes at the&bottom.\\
18  \hline
19  \endfoot % 最終ページ以外の下部に表示
20
21  \hline
22  These lines will&appear\\
23  in place of the & usual foot\\
24  at the end& of the table\\
25  \hline
26  \endlastfoot % 最終ページの下部に表示
27
28  \texttt{longtable} columns are specified& in the \\
29  same way as in the \texttt{tabular}& environment.\\
30  \verb!|r||p{1in}|! & inthis case. \\
31  Each row ends with a & \verb|\\| command. \\
32  The \verb|\\| command has an & optional \\
33  argument, just as in & the \\
34  \texttt{tabular} & environment. \\ [10pt]
35  See the effect of \verb|\\[10pt]| & ? \\
36  Lots of lines & like this. \\
37  Lots of lines & like this. \\
38  Lots of lines & like this. \\
39  Also \verb|\hline| may be used, & as in \texttt{tabular}. \\
40  \hline
41  That was a \verb|\hline| & . \\
42  \hline\hline
43  That was a \verb|\hline\hline| & . \\
44  \multicolumn{2}{||c||}
45    {This is a \texttt{\textbackslash multicolumn\{2\}\{||c||\}}} \\
46  If a page break occurs at a \verb|\hline| then & a line is drawn \\
47  at the bottom of one page and at the & top of the next. \\
48  \hline
49  The \texttt{[t] [b] [c]} argument of \texttt{tabular} & cannot be used. \\
50  The optional argument may be one of & \texttt{[l] [r] [c]} \\
51  to specify whether the table should be & adjusted \\
52  to the left, right, & or centrally. \\
53  \hline\hline
54  Lots of lines & like this. \\
55  …(以下同様に多数の行が続く)…
56  Some lines may take up a lot of space, like this: &
57  \raggedleft This last column is a ``p'' column so this ``row'' of the table can take
58  up several lines. Note however that \TeX will never break a page within such a row.
59  Page breaks only occur between rows of the table or at \verb|\hline| commands.
60  \tabularnewline
61  Lots of lines & like this.\\
62  …(省略)…
63\end{longtable}
このコードは 2 ページにわたる出力を生成します。
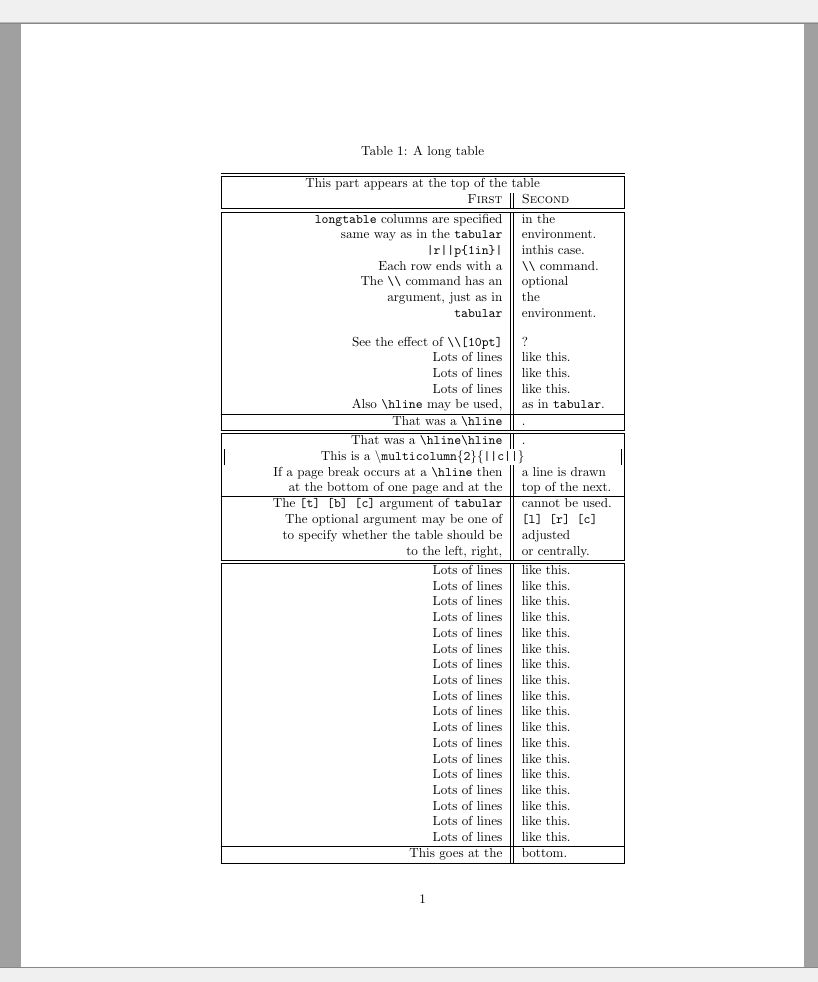
TeX のビルド回数が足りないと期待通りの結果が得られないことがあります。数回のコンパイルが必要です。
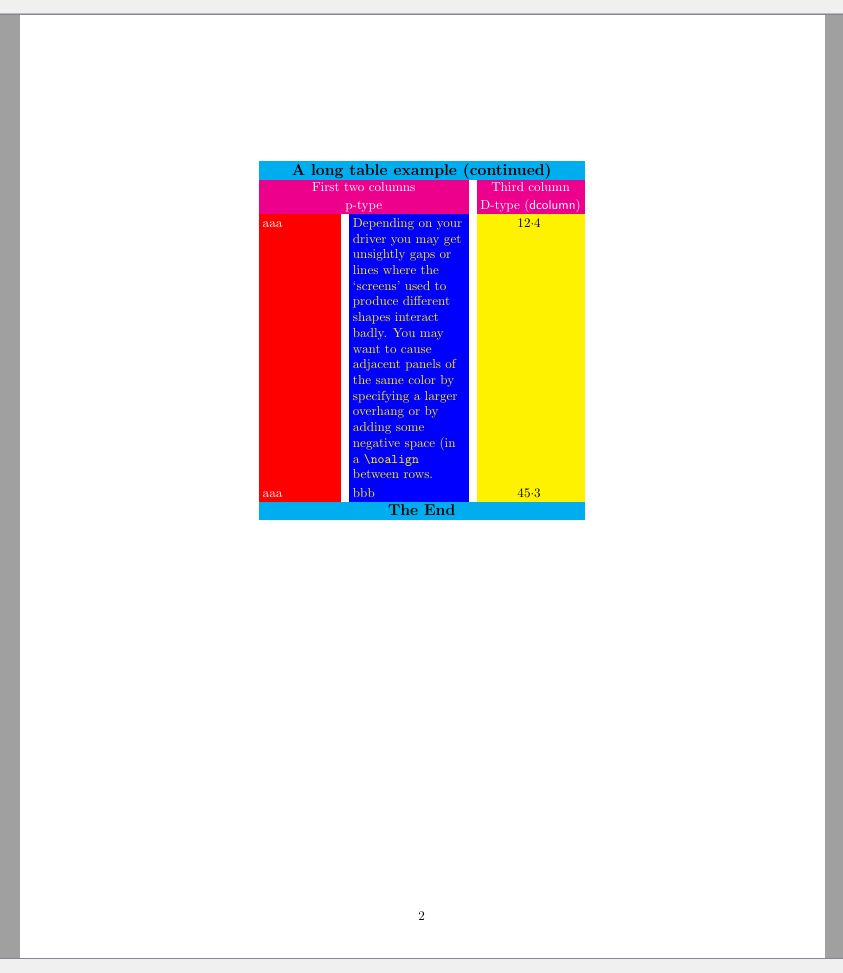
10. 複合的な表の例
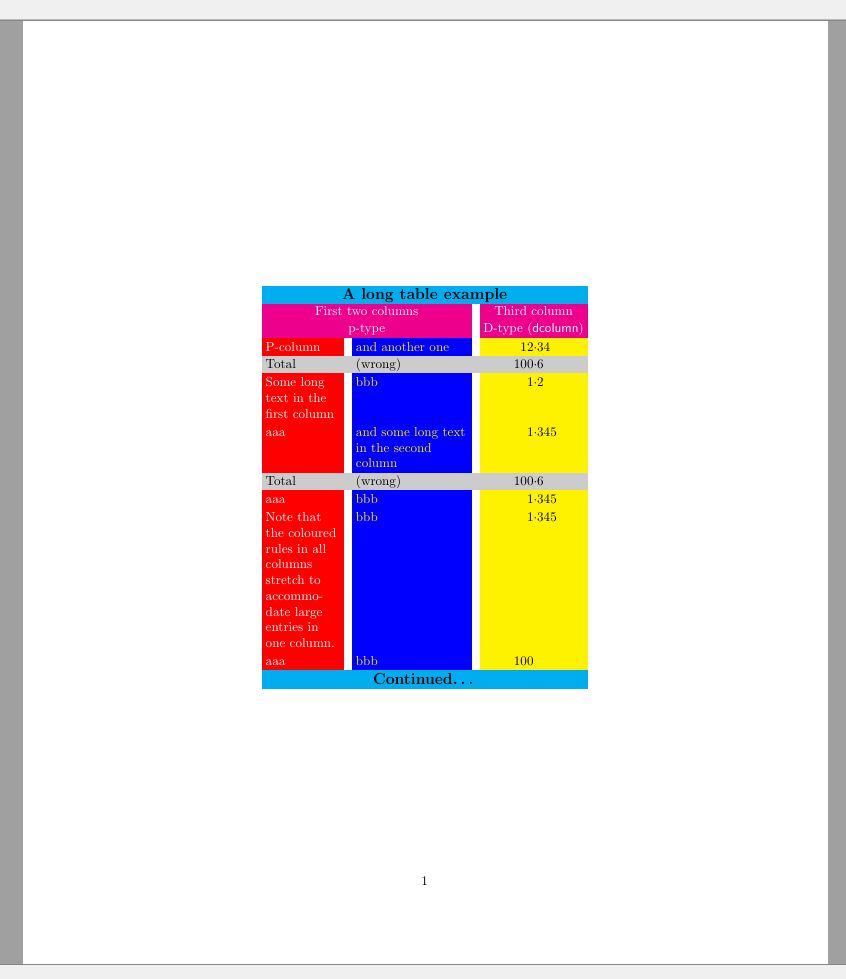
以下は上記機能を多数組み合わせたやや高度な表です。
 1\documentclass{article}
 2  \usepackage{dcolumn}
 3  \usepackage{verbatim}
 4  \usepackage{colortbl}
 5  \usepackage[table]{xcolor}
 6  \usepackage{longtable}
 7\begin{document}
 8  \hbox{}\vspace{100pt} % ページ分割のテスト用
 9
10  \newcolumntype{A}{>{\color{white}\columncolor{red}[.5\tabcolsep]\raggedright}
11    p{2cm}}
12  \newcolumntype{B}{>{\columncolor{blue}[.5\tabcolsep]\color{yellow}\raggedright}
13    p{3cm}}
14  \newcolumntype{C}{>{\columncolor{yellow}[.5\tabcolsep]}D{.}{\cdot}{-1}}
15  \newcolumntype{E}{>{\large\bfseries \columncolor{cyan}[.5\tabcolsep]}c}
16  \newcolumntype{F}{>{\color{white} \columncolor{magenta}[.5\tabcolsep]}c}
17  \newcolumntype{G}{>{\columncolor[gray]{0.8}[.5\tabcolsep][\tabcolsep]}l}
18  \newcolumntype{H}{>{\columncolor[gray]{0.8}}l}
19  \newcolumntype{I}{>{\columncolor[gray]{0.8}[\tabcolsep][.5\tabcolsep]}D{.}{\cdot}
20    {-1}}
21  \setlength\minrowclearance{2pt} %少し余白を
22
23  \begin{longtable}{ABC}
24    \multicolumn{3}{E}{A long table example} \\
25    \multicolumn{2}{F}{First two columns} & \multicolumn{1}{F}{Third column} \\
26    \multicolumn{2}{F}{p-type} & \multicolumn{1}{F}{D-type (\textsf{dcolumn})}
27    \endfirsthead
28
29    \multicolumn{3}{E}{A long table example (continued)} \\
30    \multicolumn{2}{F}{First two columns} & \multicolumn{1}{F}{Third column} \\
31    \multicolumn{2}{F}{p-type} & \multicolumn{1}{F}{D-type (\textsf{dcolumn})}
32    \endhead
33
34    \multicolumn{3}{E}{Continued\ldots}
35    \endfoot
36
37    \multicolumn{3}{E}{The End}
38    \endlastfoot
39
40    P-column & and another one & 12.34 \\
41    \multicolumn{1}{G}{Total} & \multicolumn{1}{H}{(wrong)} &
42      \multicolumn{1}{I}{100.6}\\
43    Some long text in the first column & bbb & 1.2 \\
44    aaa & and some long text in the second column & 1.345 \\
45    \multicolumn{1}{G}{Total} & \multicolumn{1}{H}{(wrong)} &
46      \multicolumn{1}{I}{100.6} \\
47    aaa&bbb & 1.345 \\
48    Note that the colored rules in all columns stretch to accommodate large entries
49      In one column. & bbb & 1.345 \\
50    aaa & bbb & 100 \\
51    aaa & Depending on your driver you may get unsightly gaps or lines
52      where the `screens' used to produce different shapes interact
53      badly. You may want to cause adjacent panels of the same color by
54      specifying a larger overhang or by adding some negative space (in a
55      \verb|\noalign| between rows. & 12.4 \\
56    aaa & bbb & 45.3 \\
57  \end{longtable}
58\end{document}
longtable の前に \newcolumntype で列タイプを定義し、>{...} で色・配置・フォント・幅を指定しています。結果は次のとおりです。
11. ベストプラクティスとヒント
LaTeX で表を組む際のベストプラクティスと実用的なヒントをまとめました。
意味のある列ヘッダーを付ける
- 読者が内容を理解しやすいよう、明確で説明的なヘッダーを使用します。
数値は小数点で揃える
- 数値データは小数点で揃えると読みやすくなります。
dcolumnパッケージが便利です。
- 数値データは小数点で揃えると読みやすくなります。
縦罫線はなるべく使わない
- プロの出版物では縦罫線を避け、水平罫線を最小限に抑えるのが一般的です。
一貫性を保つ
- フォント、サイズ、揃え方など、文書全体で統一したスタイルを維持します。
セルの内容は最小限に
- セルに過剰なテキストを入れないようにし、必要なら行や列を増やします。
キャプションとラベルを付ける
- 表の上下に情報的なキャプションを入れ、
\labelで参照できるようにします。
- 表の上下に情報的なキャプションを入れ、
multirowとmulticolumnは適度に- 結合は便利ですが使いすぎると表が読みにくくなります。
過度に複雑な表は避ける
- データが多すぎる場合は、複数の小さな表に分割するか、グラフなど別の可視化手段を検討します。
間隔は慎重に調整
\setlength{\tabcolsep}{value}と\renewcommand{\arraystretch}{value}で列間・行間の余白を最適化します。
表は入念に校正する
- データの正確性、フォーマット、揃え方をチェックし、誤りがないか確認します。
これらのポイントを守れば、機能的で美しく、プロフェッショナルな表を作成できます。
12. 結論
我々は LaTeX の表構造の奥深さを追求し、同システムの柔軟性と精度を実感してきました。tabular 環境の基本から multirow、longtable といった高度なパッケージまで、表作成に必要なツールとテクニックを網羅しました。表は単なるデータの羅列ではなく、情報を効果的に伝えるデザイン要素です。
ベストプラクティス(意味のあるヘッダー、揃え、適切な間隔、一貫性)を実践すれば、機能的かつ視覚的に魅力ある表が実現できます。
LaTeX の表作成スキルを活かして、学術論文やレポート、プレゼンテーションの質をさらに高めてください。実験・分析・報告のすべての場面で、LaTeX が強力なパートナーとなるでしょう。