ラテックス数学式レンダリング | Aspose.TeX for .NET
ラテックス数学式を PNG にレンダリングする方法
このトピックに関連する API 参照セクションは ここです。実際、ラテックス数学式レンダリング機能を実証する最も簡単な方法は、例から始めることです。ここにあります:
1 // Render LaTeX math formula to PNG image
2
3 // Create rendering options setting the image resolution to 150 dpi.
4 PngMathRendererOptions options = new PngMathRendererOptions();
5 options.Resolution = 150;
6
7 // Specify the preamble.
8 options.Preamble = @"\usepackage{amsmath}
9 \usepackage{amsfonts}
10 \usepackage{amssymb}
11 \usepackage{color}";
12
13 // Specify the scaling factor 300%.
14 options.Scale = 3000;
15
16 // Specify the foreground color.
17 options.TextColor = System.Drawing.Color.Black;
18
19 // Specify the background color.
20 options.BackgroundColor = System.Drawing.Color.White;
21
22 // Specify the output stream for the log file.
23 options.LogStream = new System.IO.MemoryStream();
24
25 // Specify whether to show the terminal output on the console or not.
26 options.ShowTerminal = true;
27
28 // Create the output stream for the formula image.
29 using (System.IO.Stream stream = System.IO.File.Open(
30 System.IO.Path.Combine(OutputDir, "math-formula.png"), System.IO.FileMode.Create))
31 {
32 // Run rendering.
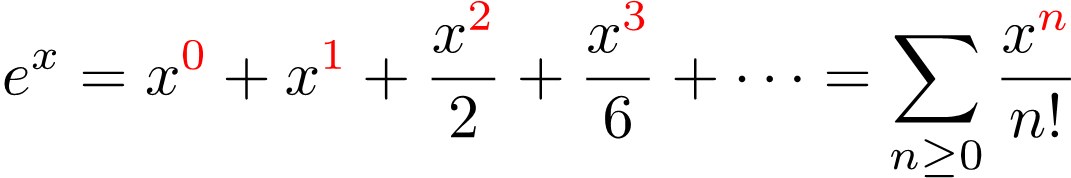
33 System.Drawing.SizeF size = new PngMathRenderer().Render(@"\begin{equation*}
34e^x = x^{\color{red}0} + x^{\color{red}1} + \frac{x^{\color{red}2}}{2} + \frac{x^{\color{red}3}}{6} + \cdots = \sum_{n\geq 0} \frac{x^{\color{red}n}}{n!}
35\end{equation*}", stream, options);
36
37 // Show other results.
38 System.Console.Out.WriteLine(options.ErrorReport);
39 System.Console.Out.WriteLine();
40 System.Console.Out.WriteLine($"Size: {size}"); // Dimensions of the resulting image.
41 }詳細について説明しましょう。まず、Tex/LaTexタイプセットと同様に、 レンダリングオプションインスタンスを作成します。ここでは、出力画像解像度を同時に指定します。
次に、前文を指定します。デフォルトのプリアンブルは次のとおりです。 次に、プリアンブルを指定します。デフォルトのプリアンブルは次のとおりです。
1\usepackage{amssymb}基本的な LaTeX よりもやや高度な数式サポートを提供します。たとえば、コード例で示したように、式で独自のハイライトを使用したい場合は color パッケージを追加できます。
次に、レンダラーに出力を 300% スケーリングするよう指示します。
次の 2 つのオプションは、前景色と背景色を定義します。カスタムハイライトによって覆われていない(「色付き」)式の部分は TextColor で表示されます。
例の次の行はあまり意味がありませんが、ログ出力をストリームに向けられることを示しています。
そして最後のオプション ShowTerminal を使用すると、ターミナル出力の書き込みをコンソールに切り替えることができます。
実際にレンダリングを実行するメソッドは MathRenderer.Render()です。式のサイズをポイントで返します。
そして最後に、MathRenderer.Render() メソッド自体を第 3 引数としてオプションを渡し、式の LaTeX コードを第 1 引数として渡します。
例の最後の行では、数式レンダリングの 2 つの成果物(式のサイズと簡易エラーレポート)を出力します。
以下がレンダリング結果です。
これは LaTeX 数式レンダリング 機能の最も一般的なユースケースです。
Aspose.TeX for .NET API に実装された機能をベースに構築された無料の Web アプリ もぜひご確認ください。
ラテックス数学式を SVG にレンダリングする方法
ほぼ同様に、LaTeX 数式を SVG 形式にレンダリングできます。
 1            // Render LaTeX math formula to SVG image
 2
 3            // Create rendering options.
 4            MathRendererOptions options = new SvgMathRendererOptions();
 5
 6            // Specify the preamble.
 7            options.Preamble = @"\usepackage{amsmath}
 8            \usepackage{amsfonts}
 9            \usepackage{amssymb}
10            \usepackage{color}";
11
12            // Specify the scaling factor 300%.
13            options.Scale = 3000;
14
15            // Specify the foreground color.
16            options.TextColor = System.Drawing.Color.Black;
17
18            // Specify the background color.
19            options.BackgroundColor = System.Drawing.Color.White;
20
21            // Specify the output stream for the log file.
22            options.LogStream = new System.IO.MemoryStream();
23
24            // Specify whether to show the terminal output on the console or not.
25            options.ShowTerminal = true;
26
27            // Create the output stream for the formula image.
28            using (System.IO.Stream stream = System.IO.File.Open(
29                System.IO.Path.Combine(OutputDir, "math-formula.svg"), System.IO.FileMode.Create))
30            {
31                // Run rendering.
32                System.Drawing.SizeF size = new SvgMathRenderer().Render(@"\begin{equation*}
33e^x = x^{\color{red}0} + x^{\color{red}1} + \frac{x^{\color{red}2}}{2} + \frac{x^{\color{red}3}}{6} + \cdots = \sum_{n\geq 0} \frac{x^{\color{red}n}}{n!}
34\end{equation*}", stream, options);
35
36                // Show other results.
37                System.Console.Out.WriteLine(options.ErrorReport);
38                System.Console.Out.WriteLine();
39                System.Console.Out.WriteLine($"Size: {size}"); // Dimensions of the resulting image.
40 }違いは次のとおりです。
SvgMathRendererOptions クラスを PngMathRendererOptions の代わりに使用します。
解像度を指定しません。
SvgMathRenderer クラスを PngMathRenderer の代わりに使用します。
以下が結果です:

Aspose.TeX for .NET API に実装された機能をベースに構築された無料の Web アプリ もぜひご確認ください。