Tables in LaTeX
1. Introduction
表格在提升学术和专业文档的清晰度、组织性以及视觉吸引力方面扮演着重要角色。它们是以结构化且易于消化的方式呈现复杂数据、比较和关系的强大手段。以下是它们重要性的简要概述:
数据摘要:表格提供了信息的浓缩表现,原本可能需要多段文字才能解释的内容可以在表格中简明呈现,使读者更容易把握关键要点。
清晰可视化:诸如统计数字、调查结果和实验发现等复杂数据,通过表格可以更有效地展示。表格格式帮助读者更轻松地识别趋势、模式和异常值。
对比分析:表格使不同数据集能够并排比较。无论是产品规格、财务表现还是研究变量,表格都能帮助读者一眼得出有意义的结论。
逻辑组织:表格提供了将数据划分为行列的逻辑结构。这种组织方式便于展示具有明确类别的数据,使读者能够轻松导航并找到特定信息。
数据完整性:在学术和专业环境中,数据准确性至关重要。表格允许作者直接呈现原始数据,避免了叙述性文字可能导致的误解风险。
参考与引用:当表格标记清晰且引用得当时,它们在文档中会成为有价值的参考点。作者在讨论发现时可以引用具体表格,帮助读者更容易跟随论证。
视觉参与:精心设计的表格打破了纯文字内容的单调,视觉上吸引读者并保持其兴趣。它们提升了文档的整体美感和专业度。
沟通效率:忙碌的专业人士和研究人员常需快速提取信息。表格让他们能够在不必阅读全文的情况下查看数据并找到具体细节。
标准化:在学术研究中,标准化表格常用于呈现实验方法、结果和统计分析。这确保了出版物之间的一致性,并有助于研究的可重复性。
本质上,表格是信息枢纽,以结构化且读者友好的格式高效呈现数据驱动的洞见。它们在传递细节丰富的信息同时保持清晰可达,使其成为学术和专业交流中不可或缺的工具。
现在,让我们转向 LaTeX——这个强大的排版系统,使作者能够将想法转化为精美的文档。LaTeX 超越了传统文字处理器的局限,提供了在处理表格结构时尤为显著的精确、优雅和多功能性。
从根本上说,LaTeX 不仅是文档准备工具,更是一种将排版艺术与技术相结合的形式。无论是撰写学术论文、报告、演示文稿,甚至是书籍,LaTeX 都擅长生成既美观又能以最高清晰度传递信息的文档。它的强大之处在于其对复杂表格结构的无缝集成——这些结构是各领域数据呈现的基石。
在 LaTeX 中,表格的信息排列超越了简单的行列网格。它是一场精心编排的交响乐,排列、间距和样式相互协调,提供精细的数据呈现。LaTeX 中的表格结构成为视觉叙事,以优雅和精准传达复杂数据集、关系和比较。
通过提供大量专用于表格设计的工具和宏包,LaTeX 将数据转化为可视化故事。无论是控制列宽、调整单元格边框和底色,LaTeX 的自定义程度都能让每张表格完美契合文档的目的。对于处理数学、技术或科学内容的作者而言,LaTeX 能在表格单元格中无缝嵌入公式和符号,提升复杂思想的传播。
然而,LaTeX 的力量并不止于美观。它通过交叉引用机制提升了效率,使表格成为文档中的导航标记。此外,LaTeX 的宏包还能创建跨多行或多列的复杂布局,以满足最苛刻的数据呈现需求。
当你深入 LaTeX 的世界,越能体会其细致入微的功能——这些功能使 LaTeX 成为科学家、专业人士和研究者不可或缺的工具。你将掌握设计引人注目、说服力强且对文档整体影响深远的表格艺术。
2. Basics of Tables in LaTeX
LaTeX 中表格的基本概念围绕 tabular 环境展开,你在其中定义列、行及其内容,以结构化且视觉悦目的方式组织和展示数据。
表格的基本结构包括以下组成部分:
开始
tabular环境:要创建表格,需要将表格内容放在tabular环境内。该环境指定表格的布局和结构。列规范:在
tabular环境中,你使用列说明符定义列数和对齐方式。常用说明符包括左对齐的l、居中的c、右对齐的r。你还可以指定哪些列之间要绘制竖线以及是否绘制外侧竖线。行内容:表格的每一行通过指定该行每个单元格的内容来创建。单元格之间用
&符号分隔,每行以\\结束。水平线:你可以使用
\hline命令添加水平线来分隔行以及绘制外侧水平边框。这有助于提升表格的视觉结构。
Simple examples
下面是一个基本的 LaTeX 表格示例:
1\begin{tabular}{|c|c|c|}                             \hline
2    Header 1 & Header 2 & Header 3 \\                \hline
3    Row 1, Cell 1 & Row 1, Cell 2 & Row 1, Cell 3 \\ \hline
4    Row 2, Cell 1 & Row 2, Cell 2 & Row 2, Cell 3 \\ \hline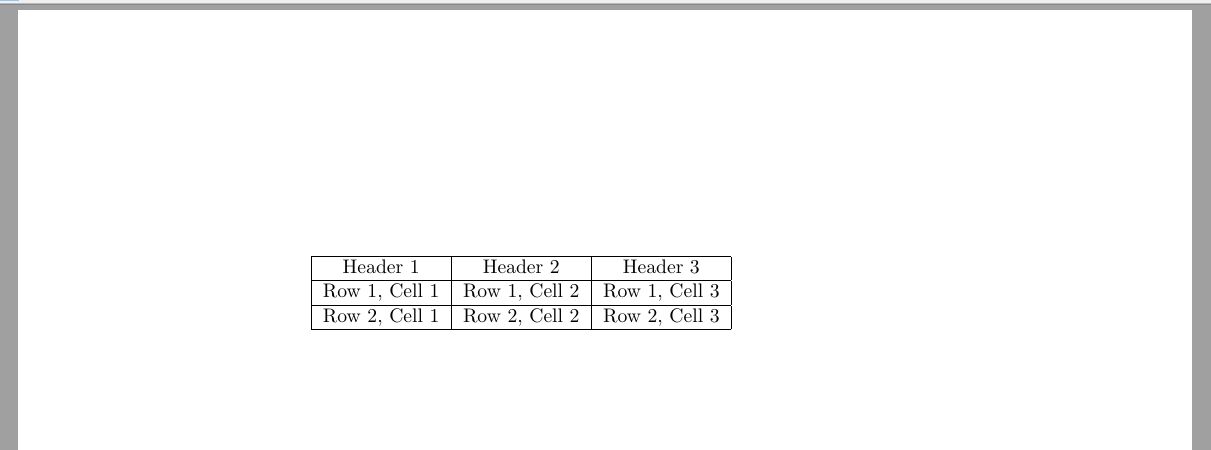
5\end{tabular}在此示例中,tabular 环境用于创建一个三列的表格,每列均居中 (c)。排版结果如下所示:
下面的示例展示了如何创建左对齐和右对齐列的表格。
1\begin{tabular}{|l r||}
2  \hline
3  Company & Income \\            \hline \hline
4  Pinapple Computer & \$150M \\
5  Megasoft & \$210M \\
6  General Waters Ltd. & \$98M \\
7  Alphamet & \$2117M \\           \hline
8\end{tabular}
右侧外框采用双线,表头也通过双线与表体分隔,列之间没有竖线。

你还可以绘制不跨越整张表格的水平线。
1\begin{tabular}{|r|l|}         \hline
2  9D5 & hexadecimal \\
3  4725 & octal \\              \cline{2-2}
4  1001 1101 0101 & binary \\   \hline \hline
5  2517 & decimal \\            \hline
6\end{tabular}这里,\cline{i-j} 命令告诉 LaTeX 在第 i 列到第 j 列之间绘制线条。

表格的列可以设定固定宽度,此时称为 段落 列。创建此类列时使用 p 说明符并在大括号中给出列宽。例如:
1\begin{tabular}{|p{3cm}|p{2cm}|}            \hline
2  A short text. & A very very long text. \\ \hline
3  A very very long text. \newline And some more text in a new line. & A short text. \\ \hline
4\end{tabular}
请注意使用 \newline 命令。

如果引入 array 宏包,还可以使用两种额外的固定宽度列选项:m{width}(与 p{width} 相同,但垂直居中单元格内容);
b{width}(与 p{width} 相同,但垂直底部对齐内容)。
在极少数情况下,需要将表格嵌入段落文本中,此时可以指定表格相对于所在行基线的位置。为此,可使用 t、c(默认)或 b 选项将基线对齐到表格的顶部、居中或底部。例如:
1This is the text of the paragraph
2\begin{tabular}[t]{|r|l|}     \hline
3  9D5 & hexadecimal \\
4  4725 & octal \\             \cline{2-2}
5  1001 1101 0101 & binary \\  \hline \hline
6  2517 & decimal \\           \hline
7\end{tabular}
8that include a table.
这里我们告诉 LaTeX 基线应对齐到表格底部。

Defining multiple columns
当表格包含大量对齐方式相同的列时,可以使用 *{num}{format} 语法一次性定义所有列。这在列数较多的表格中尤其有用。
1\begin{tabular}{l*{7}{c}r}
2  Employee   & Sun & Mon & Tue & Wed & Thu & Fri & Sat & Total \\ \hline
3  John Doe   &     &  x  &     &     &     &  x  &     &   2   \\
4  Dean Jones &  x  &     &  x  &     &  x  &     &     &   3   \\
5  Chris Cross&     &     &     &  x  &     &     &     &   1   \\
6  Pete Brad  &     &     &     &     &     &     &  x  &   1
7\end{tabular}
Column specification using >{\commmand} and <{\command}
另一种指定列的方法是使用 >{\command} 在每列元素前执行命令,或使用 <{\command} 在每列元素后执行命令。该方式需在文档导言区加载 array 宏包。下面的示例使用此语法将两列居中,并将第一列设置为粗体。
1\begin{tabular}{>{\centering\textbf\bgroup}p{3.5cm}<{\egroup}>|{\centering}p{3.5cm} }
2  History & Geometry
3  \tabularnewline \hline
4  Ancient & Elementary
5  \tabularnewline
6  Medieval & Affine
7  \tabularnewline
8  Modern & Analytic
9\end{tabular}
3. Customizing Table Layout
在 LaTeX 表格中,调整间距对于确保表格结构良好且视觉上令人愉悦至关重要。恰当的间距提升可读性,防止内容拥挤。以下是 LaTeX 表格间距调整的几个关键方面:
Inter-column spacing
LaTeX 会自动在列之间留出一些空间。若需调整列间距,可在 tabular 环境之前使用 \setlength{\tabcolsep}{value} 命令。增大该值即可增大列间距。默认值为 6pt。
Inter-row spacing
若需增大行间距,可在 tabular 环境之前使用 \renewcommand{\arraystretch}{value} 命令。增大该值会拉伸行间距。默认值为 1.0。
你也可以在行结束符后显式使用粘连(glue)指定跳过距离。
1\begin{tabular}{cl} \hline
2  Level & Complexity \\ [1cm]
3  1 & Simple \\
4  2 & Intermediate \\
5  3 & Complex \\ \hline
6\end{tabular}
Using @ and ! expressions
在文档导言区加载 array 宏包后,你可以使用 @{...} 或 !{...} 结构指定列分隔符。
它们通常接受一些文本作为参数,并在该列的每个单元格内容前后自动插入该文本。@{...} 命令用参数中的内容替代列间的默认空间。若将参数留空,可抑制列间空白。
下面是一个基本表格的代码:
1\begin{tabular}{|l|l|}
2  \hline
3  1.1 & 1.2 \\ \hline
4  2.1 & 2.2 \\
5  \hline
6\end{tabular}
通过改变列描述,可以得到如下效果:

若需保留初始间距,可使用 !{...}。

下面是一个将浮点数列对齐到小数点的示例:
1\begin{tabular}{r@{.}l}
2  3 & 14159 \\
3  16 & 2 \\
4  123 & 456 \\
5\end{tabular}
Using the dcolumn package
使用 dcolumn 宏包可以将列居中对齐到小数分隔符。该宏包提供了用于浮点数的新列说明符。下面的示例演示了如何使用它:
1\usepackage{dcolumn}
2................................................
3\newcolumntype{d}[1]{D{.}{\cdot}{#1} } % 参数 #1 指定最多保留的小数位数
4\begin{tabular}{l r c d{1} }
5  Left&Right&Center&\mathrm{Decimal}\\
6  1&2&3&4\\
7  11&22&33&44\\
8  1.1&2.2&3.3&4.4\\
9\end{tabular}
请注意,小数对齐的列在数学模式下排版,因此示例中使用了 \mathrm 来设置列标题。另一方面,位于小数对齐列中的文本(例如标题)在小数分隔符左侧会右对齐(假设文本中没有小数点)。如果文本较短或列标题为数字,这种方式可以接受;但在上述示例中显得略显笨拙。解决方案是使用下面描述的 \multicolumn 命令,为该列指定单一列并居中,例如:Left&Right&Center&\multicolumn{1}{c}{Decimal}\\。
4. Merging cells
稍微复杂一点的表格可以通过水平或垂直合并单元格实现。
Cells spanning multiple columns
使单元格跨越多列的通用命令形式为:\multicolumn{num_cols}{alignment}{contents}。其中,num_cols 为要合并的列数;alignment 为 l、c、r 或用于文本换行的 p{width};contents 为放入该单元格的内容。
下面是一个简单示例:
 1\begin{tabular}{|l|l|}
 2  \hline
 3  \multicolumn{2}{|c|}{Available currencies} \\
 4  \hline
 5  CNY & Chinese Yuan \\
 6  JPY & Japanese Yen \\
 7  GBP & Great Britain Pound \\
 8  USD & US Dollar \\
 9  CAD & Canadian Dollar \\
10  EUR & Euro \\
11  \hline
12\end{tabular}
Cells spanning multiple rows
要让单元格跨越多行,需要加载 multirow 宏包。该宏包提供以下命令:\multirow{num_rows}{width}{contents}。
其中,num_rows 为要合并的行数;width 为单元格宽度(* 表示内容的自然宽度),contents 为实际要排版的内容。
 1\begin{tabular}{|l|l|l|}
 2  \hline
 3  \multicolumn{3}{ |c| }{Available currencies} \\
 4  \hline
 5  South America & BRL & Brazilian Real \\ \hline
 6  \multirow{3}{*}{Asia} & CNY & Chinese Yuan \\
 7   & JPY & Japanese Yen \\
 8   & HKD & Hong Kong Dollar \\ \hline
 9  \multirow{3}{*}{Europe} & EUR & Euro \\
10   & GBP & Great Britain Pound \\
11   & CHF & Swiss Franc \\ \hline
12  Oceania & AUD & Australian Dollar \\ \hline
13  \multirow{2}{*}{North America} & USD & US Dollar \\
14   & CAD & Canadian Dollar \\
15  \hline
16\end{tabular}
使用 \multirow 时,需要在每个后续被跨越的行中为相应的单元格插入空白条目。
Spanning cells in both directions
下面的示例演示了如何同时在水平和垂直方向跨越单元格,并正确绘制边框:
 1\begin{tabular}{cc|c|c|c|c|l}
 2  \cline{3-6}
 3  & & \multicolumn{4}{ c| }{Primes} \\ \cline{3-6}
 4  & & 2 & 3 & 5 & 7 \\ \cline{1-6}
 5  \multicolumn{1}{ |c }{\multirow{2}{*}{Powers} } &
 6    \multicolumn{1}{ |c| }{504} & 3 & 2 & 0 & 1 & \\ \cline{2-6}
 7  \multicolumn{1}{ |c }{} &
 8    \multicolumn{1}{ |c| }{540} & 2 & 3 & 1 & 0 & \\ \cline{1-6}
 9  \multicolumn{1}{ |c }{\multirow{2}{*}{Powers} } &
10    \multicolumn{1}{ |c| }{gcd} & 2 & 2 & 0 & 0 & min \\ \cline{2-6}
11  \multicolumn{1}{ |c }{} &
12    \multicolumn{1}{ |c| }{lcm} & 3 & 3 & 1 & 1 & max \\ \cline{1-6}
13\end{tabular}
\multicolumn{1}{ 命令用于绘制左右两侧的垂直边框。虽然它与 \multirow{2}{*}{...} 结合使用,但仍只在第一行绘制垂直边框。为在后续被 \multirow 跨越的行中保持边框,需要在这些行中再次使用 \multicolumn{1}{。

5. Table Size
graphicx 宏包提供了 \resizebox{width}{height}{object} 命令,可与 tabular 环境配合使用,以将表格拉伸或缩小至指定宽高。下面示例将表格宽度调整为 12 cm,保持纵横比不变。
1\resizebox{12cm}{!} {
2  \begin{tabular}{|c|c|c|}                           \hline
3    Header 1 & Header 2 & Header 3 \\                \hline
4    Row 1, Cell 1 & Row 1, Cell 2 & Row 1, Cell 3 \\ \hline
5    Row 2, Cell 1 & Row 2, Cell 2 & Row 2, Cell 3 \\ \hline
6  \end{tabular}
7}
你也可以使用 \scalebox{ratio}{object} 以比例方式缩放表格:
1\scalebox{0.7}{
2  \begin{tabular}...
3  \end{tabular}
4}
6. Positioning Tables
如果将表格放入 table 环境中,就可以轻松控制其在页面上的位置。
1\begin{table}[positioning_option]
2  \centering
3  \begin{tabular}{...}
4    ...
5  \end{tabular}
6\end{table}
可用的定位选项包括:
h – 大致将表格放在这里。
t – 将表格放在页面顶部。
b – 将表格放在页面底部。
p – 将表格放在专门的仅含表格的页面。
! – 覆盖内部 LaTeX 参数。
H – 将表格放在精确的位置(相当于 h!)。
若要水平居中表格,只需在 table 环境内部,在 tabular 环境前使用 \centering 命令。
7. Captions, Labels and References
可以为表格添加标题文字。输出时,标题会自动加上 Table N. 前缀,其中 N 为 LaTeX 自动跟踪的表格编号。使用 \caption 命令完成此操作。还可以为表格指定标签,以便在文档任意位置引用。对应的命令是 \label 与 \ref。示例:
 1Table \ref{table:1} is an example of a referenced \LaTeX{} element.
 2
 3\begin{table}[h!]
 4  \centering
 5  \begin{tabular}{|c|c|c|} \hline
 6    Header 1 & Header 2 & Header 3 \\                \hline
 7    Row 1, Cell 1 & Row 1, Cell 2 & Row 1, Cell 3 \\ \hline
 8    Row 2, Cell 1 & Row 2, Cell 2 & Row 2, Cell 3 \\ \hline
 9  \end{tabular}
10  \caption{A caption for the table.}
11  \label{table:1}
12\end{table}
第一行中的引用会自动替换为 \label 命令指定的数字。

8. Coloring Tables
Altering colors in table rows
xcolor 宏包提供了在表格中使用交替行颜色的命令。需要在加载宏包时使用 table 选项:\usepackage[table]{xcolor}。在 tabular 环境开始前使用命令 \rowcolors{starting_row}{odd_color}{even_color}。
 1\begin{center}
 2  \rowcolors{2}{green}{pink}
 3
 4  \begin{tabular}{lll}
 5    \multicolumn{3}{c}{The header} \\
 6    odd & odd & odd \\
 7    even & even & even\\
 8    \hiderowcolors odd & odd & odd \\
 9    \showrowcolors even & even & even\\
10     even & even & even\\
11  \end{tabular}
12\end{center}\hiderowcolors(由 xcolor 宏包提供)可在其出现的行之后停用高亮。若要重新激活高亮,使用 \showrowcolors。

Coloring individual cells
使用 xcolor 宏包,你还可以为特定单元格指定颜色。
 1\begin{tabular}{|l|l|l|}
 2  \multicolumn{3}{c}{The header} \\
 3  \hline
 4  \cellcolor{red} odd & odd & odd \\
 5  \hline
 6  even & \cellcolor{red} even & even\\
 7  \hline
 8  odd & odd & \cellcolor{red} odd \\
 9  \hline
10\end{tabular}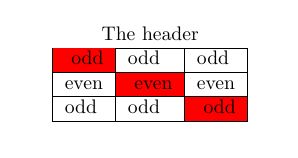
Using the colortbl package
colortbl 宏包提供 \columncolor 命令,可在 tabular 环境的前导 >{...} 构造中为列指定颜色。使用前同样需要加载 array 宏包和 xcolor 包。
1\begin{tabular}{|>{\columncolor{green}}l|>{\color{white}\columncolor{red}}c|}
2  one & two\\
3  three & four
4\end{tabular}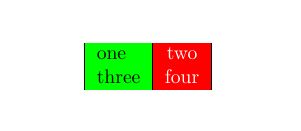
\rowcolor 命令可用于为整行指定颜色,需放在行首。其语法与 \columncolor 相同。
1\begin{tabular}{l|c|}
2  \rowcolor{green} one & two\\
3  \rowcolor{red} three & four
4\end{tabular}
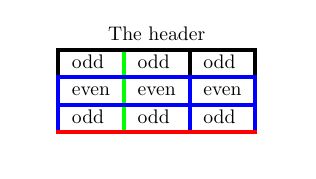
你也可以为竖线着色。例如:
1\setlength{\arrayrulewidth}{2pt}
2\begin{tabular}{!{\color{blue}\vline} l !{\color{blue}\vline} l !{\color{blue}\vline}
3    l !{\color{blue}\vline}}
4  \multicolumn{3}{c}{The header} \\
5  odd & odd & odd \\
6  even & even & even\\
7  odd & odd & odd \\
8\end{tabular}
将产生:
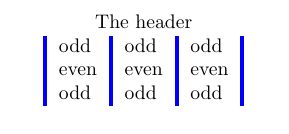
请注意使用 \setlength{\arrayrulewidth}{2pt} 来更改线条粗细。
然而,为 \hline 和 \cline 着色稍显复杂,需要额外命令(这些命令同样适用于竖线)。\arrayrulecolor 命令可全局或局部设置规则颜色;后续所有规则均受其影响。因此,如果想为竖线指定不同颜色,应在表格前导中进行设置。例如:
 1\setlength\arrayrulewidth{2pt}
 2%\arrayrulecolor{blue} % 为所有规则设定颜色
 3\begin{tabular}{|l!{\color{green}\vline}l|l|}
 4  \multicolumn{3}{c}{The header} \\
 5  \hline
 6  odd & odd & odd \\
 7  \arrayrulecolor{blue} \hline
 8  even & even & even\\
 9  \hline
10  odd & odd & odd \\ \arrayrulecolor{red}
11  \hline
12\end{tabular}
产生如下效果:
9. Building Long Tables
tabular 环境的一个主要缺点是无法在页间自动断页。因此,若表格内容过长,会超出页面底部。
幸运的是,longtable 宏包(现已在大多数发行版中提供)定义了 longtable 环境,用于处理此类长表格。该环境在大多数方面与 tabular 相同,但有一些差异。
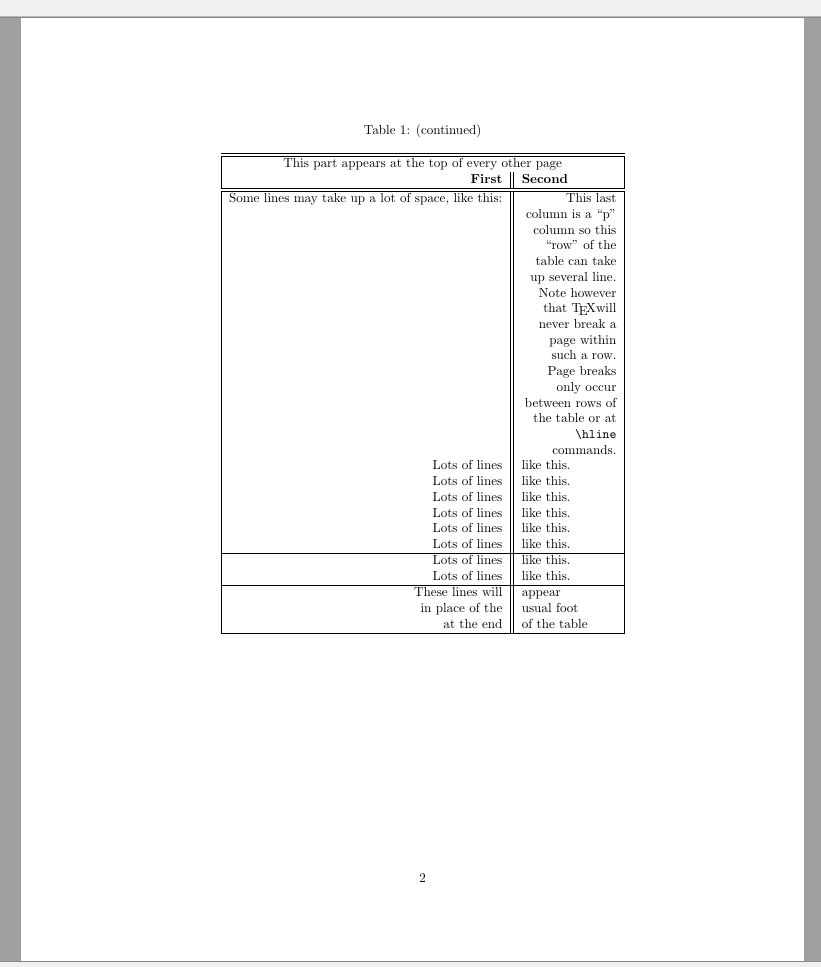
下面的示例演示了 longtable 的多数特性,并包含了使用说明和与 tabular 的区别(示例还使用了 verbatim 宏包来进行部分文本格式化,需要一起加载)。
 1\begin{longtable}{|r||p{1in}|}
 2  \caption[An optional table caption ...]{A long table\label{long}}\\
 3  \hline\hline
 4  \multicolumn{2}{|c|}{This part appears at the top of the table}\\
 5  \textsc{First}&\textsc{Second}\\
 6  \hline\hline
 7  \endfirsthead % 此命令上方的内容将在表格首页的开头出现。
 8
 9  \caption[]{(continued)}\\
10  \hline\hline
11  \multicolumn{2}{|c|}{This part appears at the top of every other page}\\
12  \textbf{First}&\textbf{Second}\\
13  \hline\hline
14  \endhead % 此命令下方、\endfirsthead 之上的内容将在除首页外的每页顶部出现。
15
16  \hline
17  This goes at the&bottom.\\
18  \hline
19  \endfoot % 此命令前的内容将在除最后一页外的每页底部出现。
20
21  \hline
22  These lines will&appear\\
23  in place of the & usual foot\\
24  at the end& of the table\\
25  \hline
26  \endlastfoot % 此命令前的内容将在表格最后一页的底部出现。
27
28  \texttt{longtable} columns are specified& in the \\
29  same way as in the \texttt{tabular}& environment.\\
30  \verb!|r||p{1in}|! & inthis case. \\
31  Each row ends with a & \verb|\\| command. \\
32  The \verb|\\| command has an & optional \\
33  argument, just as in & the \\
34  \texttt{tabular} & environment. \\ [10pt]
35  See the effect of \verb|\\[10pt]| & ? \\
36  Lots of lines & like this. \\
37  Lots of lines & like this. \\
38  Lots of lines & like this. \\
39  Also \verb|\hline| may be used, & as in \texttt{tabular}. \\
40  \hline
41  That was a \verb|\hline| & . \\
42  \hline\hline
43  That was a \verb|\hline\hline| & . \\
44  \multicolumn{2}{||c||}
45    {This is a \texttt{\textbackslash multicolumn\{2\}\{||c||\}}} \\
46  If a page break occurs at a \verb|\hline| then & a line is drawn \\
47  at the bottom of one page and at the & top of the next. \\
48  \hline
49  The \texttt{[t] [b] [c]} argument of \texttt{tabular} & cannot be used. \\
50  The optional argument may be one of & \texttt{[l] [r] [c]} \\
51  to specify whether the table should be & adjusted \\
52  to the left, right, & or centrally. \\
53  \hline\hline
54  Lots of lines & like this. \\
55  Lots of lines & like this. \\
56  Lots of lines & like this. \\
57  Lots of lines & like this. \\
58  Lots of lines & like this. \\
59  Lots of lines & like this. \\
60  Lots of lines & like this. \\
61  Lots of lines & like this. \\
62  Lots of lines & like this. \\
63  Lots of lines & like this. \\
64  Lots of lines & like this. \\
65  Lots of lines & like this. \\
66  Lots of lines & like this. \\
67  Lots of lines & like this. \\
68  Lots of lines & like this. \\
69  Lots of lines & like this. \\
70  Lots of lines & like this. \\
71  Lots of lines & like this. \\
72  Some lines may take up a lot of space, like this: &
73  \raggedleft This last column is a ``p'' column so this ``row'' of the table can take
74  up several lines. Note however that \TeX will never break a page within such a row.
75  Page breaks only occur between rows of the table or at \verb|\hline| commands.
76  \tabularnewline
77  Lots of lines & like this.\\
78  Lots of lines & like this.\\
79  Lots of lines & like this.\\
80  Lots of lines & like this.\\
81  Lots of lines & like this.\\
82  Lots of lines & like this.\\
83  \hline
84  Lots of lines& like this.\\
85  Lots of lines& like this.\\
86\end{longtable}
该代码将产生两页效果:
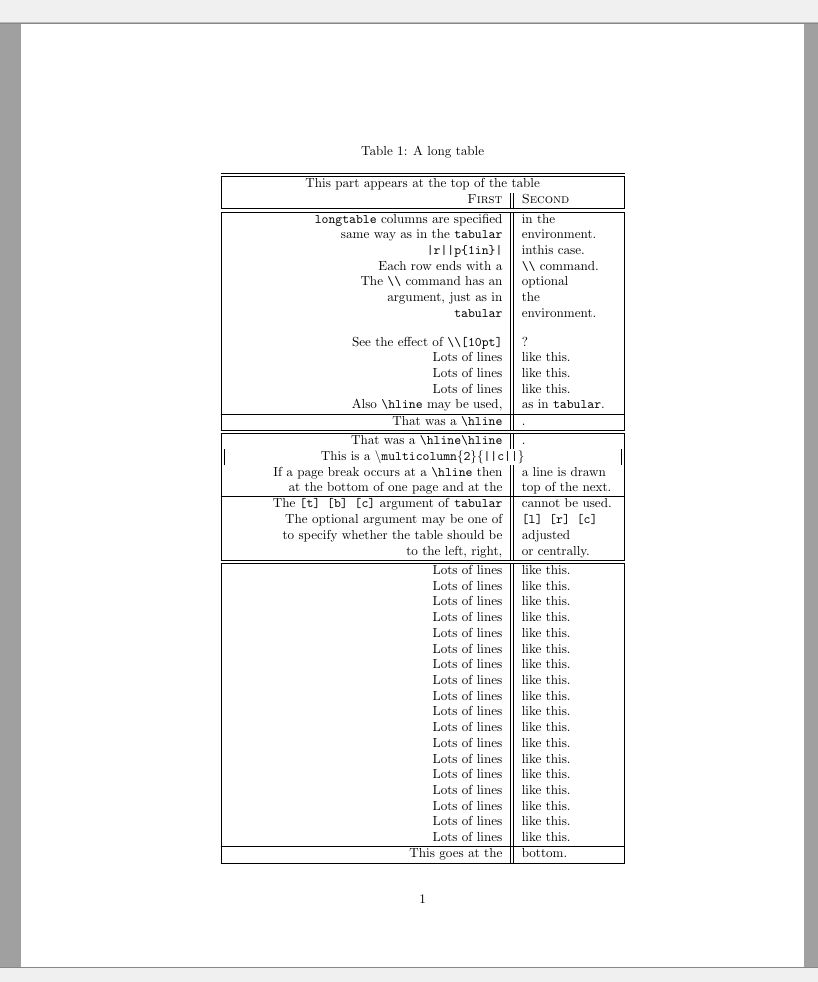
首次编译后若未得到相同结果,请不要惊慌。由于 TeX 的技术限制,可能需要多次编译才能看到图片中的表格。
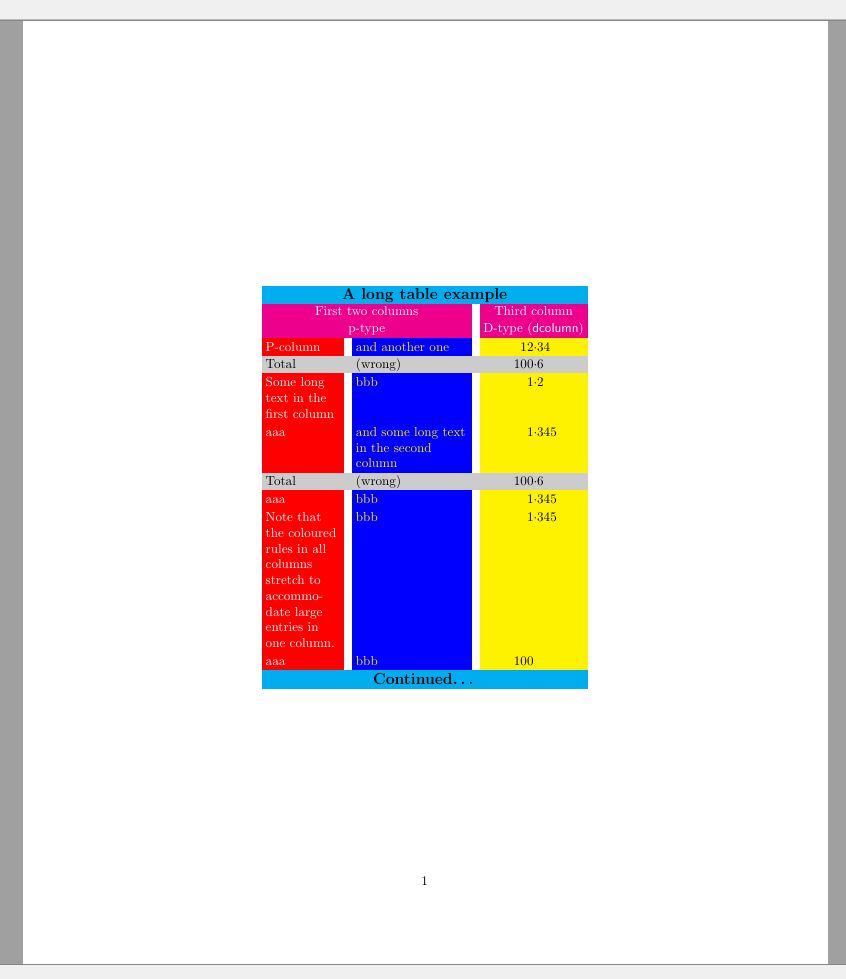
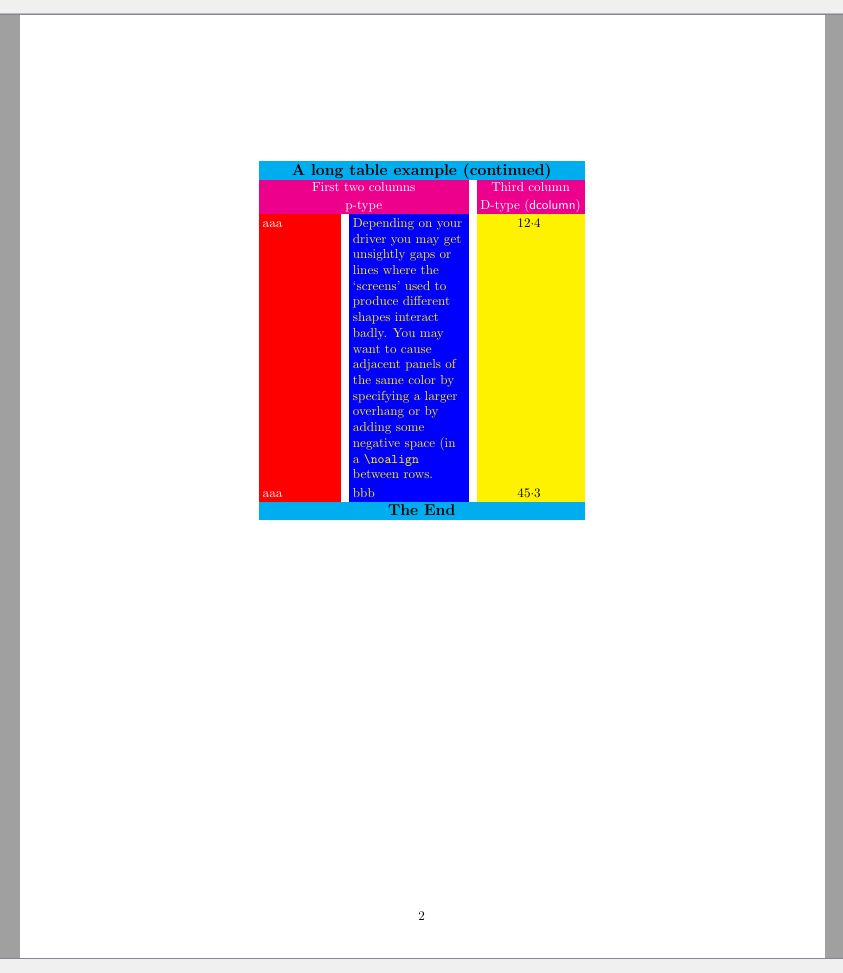
10. A Complex Table Example
下面提供了一个更为复杂的示例,展示了如何将前述多种功能组合在一起。
 1\documentclass{article}
 2  \usepackage{dcolumn}
 3  \usepackage{verbatim}
 4  \usepackage{colortbl}
 5  \usepackage[table]{xcolor}
 6  \usepackage{longtable}
 7\begin{document}
 8  \hbox{}\vspace{100pt} % To make the table break between pages
 9
10  \newcolumntype{A}{>{\color{white}\columncolor{red}[.5\tabcolsep]\raggedright}
11    p{2cm}}
12  \newcolumntype{B}{>{\columncolor{blue}[.5\tabcolsep]\color{yellow}\raggedright}
13    p{3cm}}
14  \newcolumntype{C}{>{\columncolor{yellow}[.5\tabcolsep]}D{.}{\cdot}{-1}}
15  \newcolumntype{E}{>{\large\bfseries \columncolor{cyan}[.5\tabcolsep]}c}
16  \newcolumntype{F}{>{\color{white} \columncolor{magenta}[.5\tabcolsep]}c}
17  \newcolumntype{G}{>{\columncolor[gray]{0.8}[.5\tabcolsep][\tabcolsep]}l}
18  \newcolumntype{H}{>{\columncolor[gray]{0.8}}l}
19  \newcolumntype{I}{>{\columncolor[gray]{0.8}[\tabcolsep][.5\tabcolsep]}D{.}{\cdot}
20    {-1}}
21  \setlength\minrowclearance{2pt} %Before starting give a little space
22
23  \begin{longtable}{ABC}
24    \multicolumn{3}{E}{A long table example} \\
25    \multicolumn{2}{F}{First two columns} & \multicolumn{1}{F}{Third column} \\
26    \multicolumn{2}{F}{p-type} & \multicolumn{1}{F}{D-type (\textsf{dcolumn})}
27    \endfirsthead
28
29    \multicolumn{3}{E}{A long table example (continued)} \\
30    \multicolumn{2}{F}{First two columns} & \multicolumn{1}{F}{Third column} \\
31    \multicolumn{2}{F}{p-type} & \multicolumn{1}{F}{D-type (\textsf{dcolumn})}
32    \endhead
33
34    \multicolumn{3}{E}{Continued\ldots}
35    \endfoot
36
37    \multicolumn{3}{E}{The End}
38    \endlastfoot
39
40    P-column & and another one & 12.34 \\
41    \multicolumn{1}{G}{Total} & \multicolumn{1}{H}{(wrong)} &
42      \multicolumn{1}{I}{100.6}\\
43    Some long text in the first column & bbb & 1.2 \\
44    aaa & and some long text in the second column & 1.345 \\
45    \multicolumn{1}{G}{Total} & \multicolumn{1}{H}{(wrong)} &
46      \multicolumn{1}{I}{100.6} \\
47    aaa&bbb & 1.345 \\
48    Note that the colored rules in all columns stretch to accommodate large entries
49      In one column. & bbb & 1.345 \\
50    aaa & bbb & 100 \\
51    aaa & Depending on your driver you may get unsightly gaps or lines
52      where the `screens' used to produce different shapes interact
53      badly. You may want to cause adjacent panels of the same color by
54      specifying a larger overhang or by adding some negative space (in a
55      \verb|\noalign| between rows. & 12.4 \\
56    aaa & bbb & 45.3 \\
57  \end{longtable}
58\end{document}
在 longtable 环境之前,我们使用 \newcolumntype 命令(由 dcolumn 宏包提供)定义了若干列类型。随后在参数中使用 >{...} 记法来设定列格式。列定义中包含了颜色、对齐、字体以及列宽等指令。longtable 环境本身则是另一项被使用的特性。我们在环境内部使用 \multicolumn 命令水平合并单元格,并结合前面定义的列类型。
所有努力的结果如下所示:
11. Best Practices and Tips
在 LaTeX 中排版表格可能是一项细致的工作,但遵循以下最佳实践和技巧可以帮助你创建清晰、美观且专业的表格。以下是一些宝贵的建议:
使用有意义的列标题:为每一列提供简洁且描述性的标题,帮助读者快速了解内容。
在小数点对齐数值:呈现数值时,将数字对齐至小数点,以提升可读性。可使用
dcolumn宏包实现。避免使用竖线:在专业出版物中,通常建议避免使用竖线分隔列。水平线应适度使用,以保持简洁。
保持一致性:在整篇文档中保持统一的格式,包括字体、字号以及表格内部的对齐方式。
最小化单元格内容:避免在单元格中填充过多信息。如有必要,可将内容拆分到多行或多列。
添加标题和标签:在表格上方或下方加入信息丰富的标题,并使用
\label命令以便在文档中交叉引用。适度使用
multirow与multicolumn:虽然它们对于合并单元格非常有用,但过度使用会导致表格结构复杂,难以阅读。避免过于复杂的表格:如果数据过于庞大,考虑拆分为多个较小的表格,或使用图表等其他可视化方式。
合理使用水平空间:通过
\setlength{\tabcolsep}{value}调整列间距,使用\renewcommand{\arraystretch}{value}调整行间距,以优化表格布局。仔细校对表格:仔细检查表格中的错误,包括数据准确性、格式以及对齐情况。
通过遵循这些最佳实践和技巧,你可以创建既能有效传达数据,又具备视觉美感和专业水准的 LaTeX 表格。
12. Conclusion
我们已踏遍 LaTeX 表格结构的细微世界,领悟到这一排版系统所提供的惊人多样性与精准度。LaTeX 能够将表格无缝嵌入文档,使用户能够以优雅与清晰的方式传递复杂数据、比较与关系。
从 tabular 环境的基础概念,到 multirow 与 longtable 宏包的高级技巧,我们已经探讨了让 LaTeX 成为打造表格强大工具的各种手段。我们了解到 LaTeX 不仅美化表格,还简化了数据呈现,提升了有效沟通的效率。
我们强调了最佳实践:有意义的列标题、对齐方式、恰当的间距以及一致性。这些做法帮助我们创建的表格既功能完善,又具备视觉吸引力与专业度。
在你继续探索 LaTeX 的旅程中,请记住:掌握表格结构既是一门艺术,也是一门科学。它能够显著提升学术论文、报告以及演示文稿的影响力。
因此,凭借对 LaTeX 表格功能的了解,提升你的文档水平。大胆尝试、不断改进、在表格结构的领地中创新,让 LaTeX 成为你创作信息传递、优雅且专业文档的可靠伙伴。