LaTeX 图形渲染 | Aspose.TeX for .NET
有时您可能希望从 LaTeX 文件中提取部分内容作为单独渲染的片段,或者称作 “图形”,而不与页面布局关联。例如,这可以作为您在互联网上发布的插图。您可以使用我们的 API 实现此功能。目标格式有两种选择——PNG 和 SVG。与 LaTeX 数学公式渲染功能相同。值得注意的是,LaTeX 图形渲染是对 LaTeX math formula rendering的概括。
如何将 LaTeX 图形渲染为 PNG
与本主题相关的 API 参考部分位于 此处。与公式渲染一样,我们将从示例开始。代码如下:
1 // Render LaTeX figure to PNG image
2
3 // Create rendering options setting the image resolution to 150 dpi.
4 PngFigureRendererOptions options = new PngFigureRendererOptions();
5 options.Resolution = 150;
6
7 // Specify the preamble.
8 options.Preamble = "\\usepackage{pict2e}";
9
10 // Specify the scaling factor 300%.
11 options.Scale = 3000;
12
13 // Specify the background color.
14 options.BackgroundColor = System.Drawing.Color.White;
15
16 // Specify the output stream for the log file.
17 options.LogStream = new System.IO.MemoryStream();
18
19 // Specify whether to show the terminal output on the console or not.
20 options.ShowTerminal = true;
21
22 // Create the output stream for the figure image.
23 using (System.IO.Stream stream = System.IO.File.Open(
24 System.IO.Path.Combine(OutputDir, "text-and-formula.png"), System.IO.FileMode.Create))
25 {
26 // Run rendering.
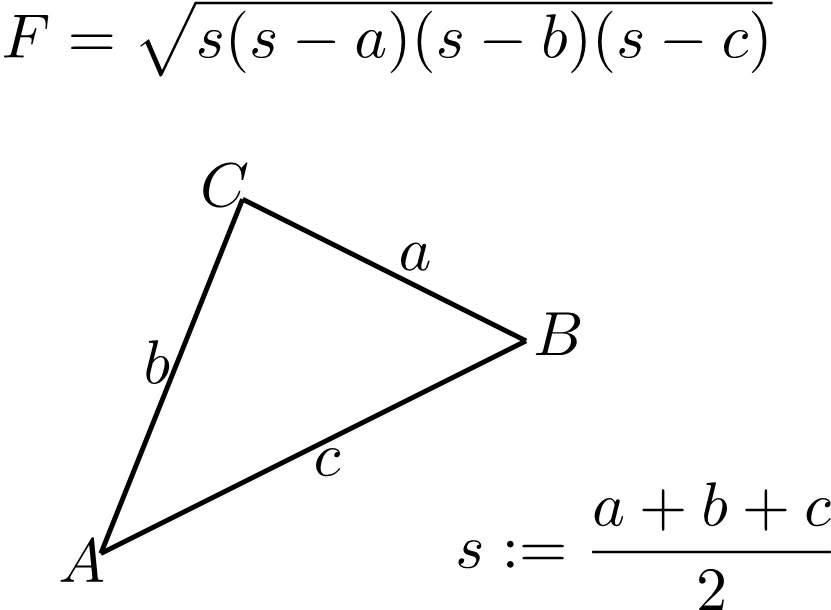
27 System.Drawing.SizeF size = new PngFigureRenderer().Render(@"\setlength{\unitlength}{0.8cm}
28\begin{picture}(6,5)
29\thicklines
30\put(1,0.5){\line(2,1){3}} \put(4,2){\line(-2,1){2}} \put(2,3){\line(-2,-5){1}} \put(0.7,0.3){$A$} \put(4.05,1.9){$B$} \put(1.7,2.95){$C$}
31\put(3.1,2.5){$a$} \put(1.3,1.7){$b$} \put(2.5,1.05){$c$} \put(0.3,4){$F=\sqrt{s(s-a)(s-b)(s-c)}$} \put(3.5,0.4){$\displaystyle s:=\frac{a+b+c}{2}$}
32\end{picture}", stream, options);
33
34 // Show other results.
35 System.Console.Out.WriteLine(options.ErrorReport);
36 System.Console.Out.WriteLine();
37 System.Console.Out.WriteLine($"Size: {size}"); // Dimensions of the resulting image.
38 }首先,我们创建一个 LaTeX figure options实例,并在此同时指定输出图像的分辨率。
接下来,指定前导代码(preamble)。LaTeX 图形渲染没有默认的前导代码,因此如果您要渲染使用 pict2e LaTeX 包绘制的图形,需要在前导代码中声明:
1\usepackage{pict2e}然后,我们指示渲染器将输出按 300% 缩放。
下一个选项定义背景颜色。与数学公式渲染不同,我们不指定前景颜色,因为我们假设颜色完全由 LaTeX 代码控制。事实上,背景颜色也是如此,这只是一个便利选项。
示例中的下一行代码意义不大,仅演示了如何将日志输出定向到某个流。
最后一个选项 ShowTerminal 允许您切换是否将终端输出写入控制台。
实际执行渲染的方式是调用 FigureRenderer.Render()。它返回图形的尺寸(以点为单位)。
渲染方法的第二个参数是用于写入图像的流。我们随后创建该流。
最后,我们调用 FigureRenderer.Render() 方法本身,将选项作为第三个参数传入。图形的 LaTeX 代码作为第一个参数传入。
示例的最后几行会输出两个渲染产出——图形的尺寸以及简要的错误报告(如果有错误)。
以下是渲染结果。
这是 LaTeX 图形渲染 功能最常见的使用场景。
如何将 LaTeX 图形渲染为 SVG
以类似的方式,我们可以将 LaTeX 图形渲染为 SVG 格式。
 1            // Render LaTeX figure to SVG image
 2
 3            // Create rendering options.
 4            FigureRendererOptions options = new SvgFigureRendererOptions();
 5
 6            // Specify the preamble.
 7            options.Preamble = "\\usepackage{pict2e}";
 8
 9            // Specify the scaling factor 300%.
10            options.Scale = 3000;
11
12            // Specify the background color.
13            options.BackgroundColor = System.Drawing.Color.White;
14
15            // Specify the output stream for the log file.
16            options.LogStream = new System.IO.MemoryStream();
17
18            // Specify whether to show the terminal output on the console or not.
19            options.ShowTerminal = true;
20
21            // Create the output stream for the figure image.
22            using (System.IO.Stream stream = System.IO.File.Open(
23               System.IO.Path.Combine(OutputDir, "text-and-formula.svg"), System.IO.FileMode.Create))
24            {
25                // Run rendering.
26                System.Drawing.SizeF size = new SvgFigureRenderer().Render(@"\setlength{\unitlength}{0.8cm}
27\begin{picture}(6,5)
28\thicklines
29\put(1,0.5){\line(2,1){3}} \put(4,2){\line(-2,1){2}} \put(2,3){\line(-2,-5){1}} \put(0.7,0.3){$A$} \put(4.05,1.9){$B$} \put(1.7,2.95){$C$}
30\put(3.1,2.5){$a$} \put(1.3,1.7){$b$} \put(2.5,1.05){$c$} \put(0.3,4){$F=\sqrt{s(s-a)(s-b)(s-c)}$} \put(3.5,0.4){$\displaystyle s:=\frac{a+b+c}{2}$}
31\end{picture}", stream, options);
32
33                // Show other results.
34                System.Console.Out.WriteLine(options.ErrorReport);
35                System.Console.Out.WriteLine();
36                System.Console.Out.WriteLine($"Size: {size}"); // Dimensions of the resulting image.
37 }区别如下:
- 我们使用 SvgFigureRendererOptions类,而不是 PngFigureRendererOptions。
- 不再指定分辨率。
- 使用 SvgFigureRenderer类,而不是 PngFigureRenderer。
以下是渲染结果:
