العمل مع الرسوم البيانية
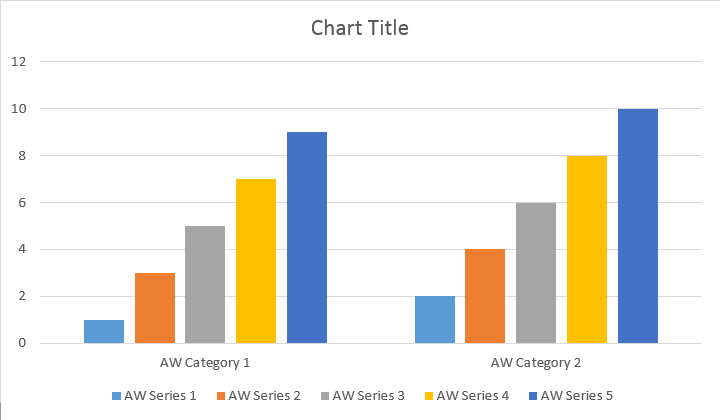
تمت إضافة طريقة insertChart الجديدة إلى فئة DocumentBuilder. لذلك، دعونا نرى كيفية إدراج مخطط عمود بسيط في المستند باستخدام طريقة insertChart.
كيفية إدراج مخطط من الصفر باستخدام Aspose.Words
في هذا القسم سوف نتعلم كيفية إدراج مخطط في مستند.
إدراج مخطط العمود
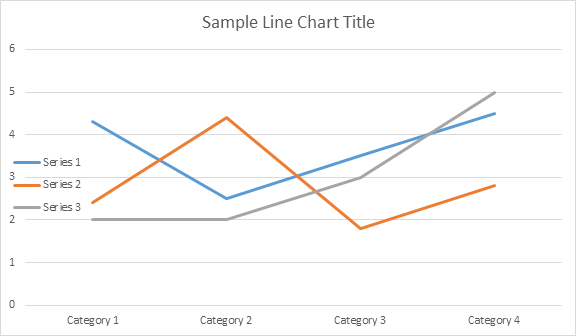
يوضح مثال الكود التالي كيفية إدراج مخطط العمود:
// For complete examples and data files, please go to https://github.com/aspose-words/Aspose.Words-for-Java | |
Document doc = new Document(); | |
DocumentBuilder builder = new DocumentBuilder(doc); | |
// Add chart with default data. You can specify different chart types and sizes. | |
Shape shape = builder.insertChart(ChartType.COLUMN, 432, 252); | |
// Chart property of Shape contains all chart related options. | |
Chart chart = shape.getChart(); | |
// Get chart series collection. | |
ChartSeriesCollection seriesColl = chart.getSeries(); | |
// Delete default generated series. | |
seriesColl.clear(); | |
// Create category names array, in this example we have two categories. | |
String[] categories = new String[]{"AW Category 1", "AW Category 2"}; | |
// Adding new series. Please note, data arrays must not be empty and arrays must be the same size. | |
seriesColl.add("AW Series 1", categories, new double[]{1, 2}); | |
seriesColl.add("AW Series 2", categories, new double[]{3, 4}); | |
seriesColl.add("AW Series 3", categories, new double[]{5, 6}); | |
seriesColl.add("AW Series 4", categories, new double[]{7, 8}); | |
seriesColl.add("AW Series 5", categories, new double[]{9, 10}); | |
doc.save(dataDir + "TestInsertChartColumn1_out.docx"); |
ينتج الكود النتيجة التالية:
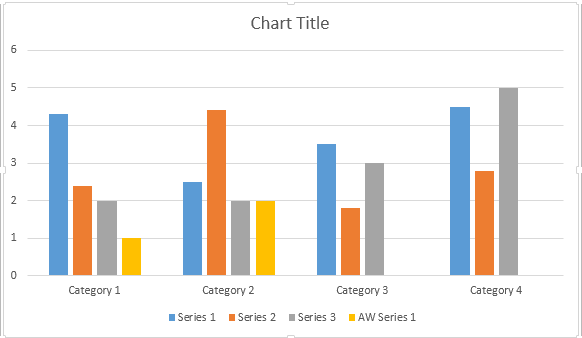
هناك أربعة أحمال زائدة مختلفة لطريقة إضافة السلسلة، والتي تم الكشف عنها لتغطية جميع المتغيرات الممكنة لمصادر البيانات لجميع أنواع المخططات:
// For complete examples and data files, please go to https://github.com/aspose-words/Aspose.Words-for-Java | |
Document doc = new Document(); | |
DocumentBuilder builder = new DocumentBuilder(doc); | |
// Insert Column chart. | |
Shape shape = builder.insertChart(ChartType.COLUMN, 432, 252); | |
Chart chart = shape.getChart(); | |
// Use this overload to add series to any type of Bar, Column, Line and Surface charts. | |
chart.getSeries().add("AW Series 1", new String[]{"AW Category 1", "AW Category 2"}, new double[]{1, 2}); | |
doc.save(dataDir + "TestInsertColumnChart2_out.docx"); |
ينتج الكود النتيجة التالية:
إدراج مخطط مبعثر
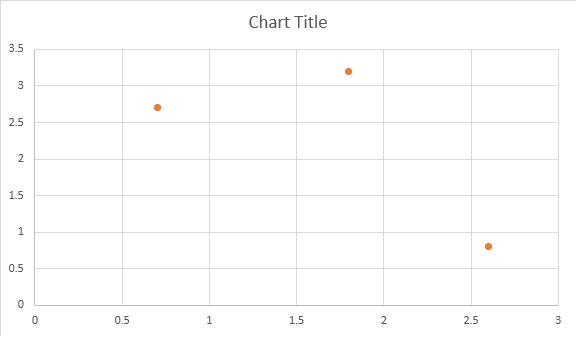
يوضح مثال الكود التالي كيفية إدراج مخطط مبعثر:
// For complete examples and data files, please go to https://github.com/aspose-words/Aspose.Words-for-Java | |
Document doc = new Document(); | |
DocumentBuilder builder = new DocumentBuilder(doc); | |
// Insert Scatter chart. | |
Shape shape = builder.insertChart(ChartType.SCATTER, 432, 252); | |
Chart chart = shape.getChart(); | |
// Use this overload to add series to any type of Scatter charts. | |
chart.getSeries().add("AW Series 1", new double[]{0.7, 1.8, 2.6}, new double[]{2.7, 3.2, 0.8}); | |
doc.save(dataDir + "TestInsertScatterChart_out.docx"); |
ينتج الكود النتيجة التالية:
إدراج مخطط المنطقة
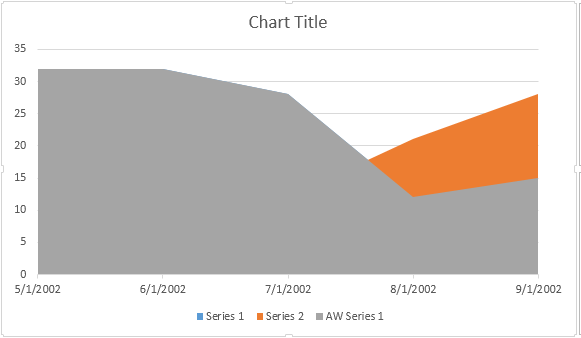
يوضح مثال الكود التالي كيفية إدراج مخطط منطقة:
// For complete examples and data files, please go to https://github.com/aspose-words/Aspose.Words-for-Java | |
Document doc = new Document(); | |
DocumentBuilder builder = new DocumentBuilder(doc); | |
// Insert Area chart. | |
Shape shape = builder.insertChart(ChartType.AREA, 432, 252); | |
Chart chart = shape.getChart(); | |
SimpleDateFormat sdf = new SimpleDateFormat("dd/MM/yyyy"); | |
Date date1 = sdf.parse("01/01/2016"); | |
Date date2 = sdf.parse("02/02/2016"); | |
Date date3 = sdf.parse("03/03/2016"); | |
Date date4 = sdf.parse("04/04/2016"); | |
Date date5 = sdf.parse("05/05/2016"); | |
// Use this overload to add series to any type of Area, Radar and Stock charts. | |
chart.getSeries().add("AW Series 1", new Date[]{date1, date2, date3, date4, date5}, new double[]{32, 32, 28, 12, 15}); | |
doc.save(dataDir + "TestInsertAreaChart_out.docx"); |
ينتج الكود النتيجة التالية:
إدراج الرسم البياني فقاعة
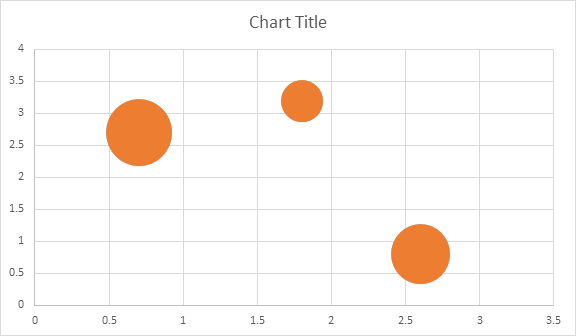
يوضح مثال الكود التالي كيفية إدراج مخطط فقاعي:
// For complete examples and data files, please go to https://github.com/aspose-words/Aspose.Words-for-Java | |
Document doc = new Document(); | |
DocumentBuilder builder = new DocumentBuilder(doc); | |
// Insert Bubble chart. | |
Shape shape = builder.insertChart(ChartType.BUBBLE, 432, 252); | |
Chart chart = shape.getChart(); | |
// Use this overload to add series to any type of Bubble charts. | |
chart.getSeries().add("AW Series 1", new double[]{0.7, 1.8, 2.6}, new double[]{2.7, 3.2, 0.8}, new double[]{10, 4, 8}); | |
doc.save(dataDir + "TestInsertBubbleChart_out.docx"); |
ينتج الكود النتيجة التالية:
العمل مع المخططات من خلال Shape.Chart
كائن
مرة واحدة تم إدراج الرسم البياني ومليئة البيانات، كنت قادرا على تغيير مظهره. Shape.Chart تحتوي الخاصية على جميع الخيارات المتعلقة بالمخطط المتاحة من خلال الجمهور API.
على سبيل المثال، لنغير عنوان المخطط أو سلوك وسيلة الإيضاح:
// For complete examples and data files, please go to https://github.com/aspose-words/Aspose.Words-for-Java | |
Document doc = new Document(); | |
DocumentBuilder builder = new DocumentBuilder(doc); | |
Shape shape = builder.insertChart(ChartType.LINE, 432, 252); | |
Chart chart = shape.getChart(); | |
// Determines whether the title shall be shown for this chart. Default is true. | |
chart.getTitle().setShow(true); | |
// Setting chart Title. | |
chart.getTitle().setText("Sample Line Chart Title"); | |
// Determines whether other chart elements shall be allowed to overlap title. | |
chart.getTitle().setOverlay(false); | |
// Please note if null or empty value is specified as title text, auto generated title will be shown. | |
// Determines how legend shall be shown for this chart. | |
chart.getLegend().setPosition(LegendPosition.LEFT); | |
chart.getLegend().setOverlay(true); | |
doc.save(dataDir + "ChartAppearance_out.docx"); |
رمز يولد النتائج التالية:
كيفية العمل مع ChartSeriesCollection من الرسم البياني
دعونا ننظر في ChartSeries جمع. تتوفر جميع سلاسل المخططات من خلال مجموعة chart.getSeries()، وهي Iterable:
// For complete examples and data files, please go to https://github.com/aspose-words/Aspose.Words-for-Java | |
Document doc = new Document(); | |
DocumentBuilder builder = new DocumentBuilder(doc); | |
Shape shape = builder.insertChart(ChartType.LINE, 432, 252); | |
// Chart property of Shape contains all chart related options. | |
Chart chart = shape.getChart(); | |
// Get chart series collection. | |
ChartSeriesCollection seriesCollection = chart.getSeries(); | |
// Check series count. | |
System.out.println(seriesCollection.getCount()); |
يمكنك إزالة سلسلة واحدة تلو الأخرى أو مسح كل منهم وكذلك إضافة واحدة جديدة إذا لزم الأمر. يحتوي المخطط المدرج حديثا على بعض السلاسل الافتراضية المضافة إلى هذه المجموعة. لإزالتها تحتاج إلى استدعاء طريقة chart.getSeries().clear().
العمل مع فئة واحدة ChartSeries
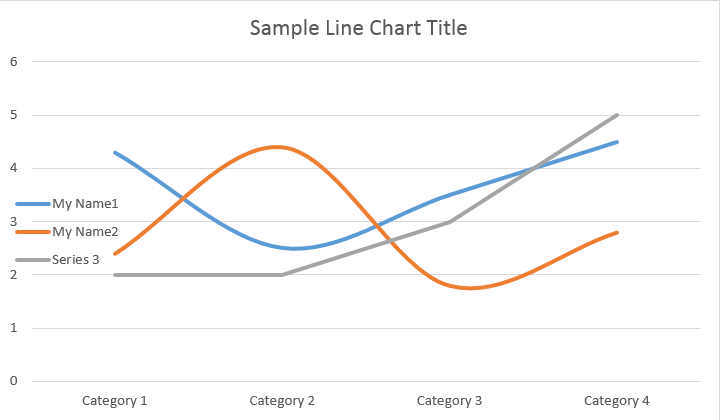
هنا هو كيفية العمل مع سلسلة معينة.
// For complete examples and data files, please go to https://github.com/aspose-words/Aspose.Words-for-Java | |
Document doc = new Document(); | |
DocumentBuilder builder = new DocumentBuilder(doc); | |
Shape shape = builder.insertChart(ChartType.LINE, 432, 252); | |
// Get first series. | |
ChartSeries series0 = shape.getChart().getSeries().get(0); | |
// Get second series. | |
ChartSeries series1 = shape.getChart().getSeries().get(1); | |
// Change first series name. | |
series0.setName("My Name1"); | |
// Change second series name. | |
series1.setName("My Name2"); | |
// You can also specify whether the line connecting the points on the chart shall be smoothed using Catmull-Rom splines. | |
series0.setSmooth(true); | |
series1.setSmooth(true); | |
doc.save(dataDir + "SingleChartSeries_out.docx"); |
يرجى الاطلاع على النتيجة أدناه:
كل واحد ChartSeries لديك خيارات ChartDataPoint الافتراضية، يرجى محاولة استخدام التعليمات البرمجية التالية لتغييرها:
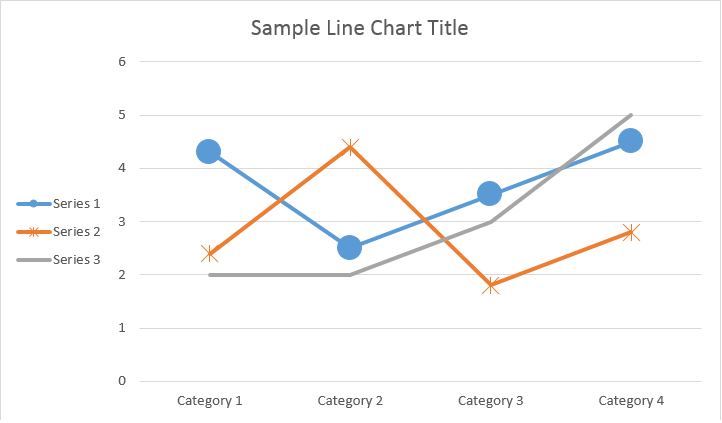
// For complete examples and data files, please go to https://github.com/aspose-words/Aspose.Words-for-Java | |
Document doc = new Document(); | |
DocumentBuilder builder = new DocumentBuilder(doc); | |
Shape shape = builder.insertChart(ChartType.LINE, 432, 252); | |
// Get first series. | |
ChartSeries series0 = shape.getChart().getSeries().get(0); | |
// Get second series. | |
ChartSeries series1 = shape.getChart().getSeries().get(1); | |
// Specifies whether by default the parent element shall inverts its colors if the value is negative. | |
series0.setInvertIfNegative(true); | |
// Set default marker symbol and size. | |
series0.getMarker().setSymbol(MarkerSymbol.CIRCLE); | |
series0.getMarker().setSize(15); | |
series1.getMarker().setSymbol(MarkerSymbol.STAR); | |
series1.getMarker().setSize(10); | |
doc.save(dataDir + "ChartDataPoints_out.docx");// |
كيفية العمل مع واحد ChartDataPoint من ChartSeries
باستخدام ChartDataPoint كنت قادرا على تخصيص تنسيق نقطة بيانات واحدة من سلسلة الرسم البياني:
// For complete examples and data files, please go to https://github.com/aspose-words/Aspose.Words-for-Java | |
Document doc = new Document(); | |
DocumentBuilder builder = new DocumentBuilder(doc); | |
Shape shape = builder.insertChart(ChartType.LINE, 432, 252); | |
// Get first series. | |
ChartSeries series0 = shape.getChart().getSeries().get(0); | |
// Get second series. | |
ChartSeries series1 = shape.getChart().getSeries().get(1); | |
ChartDataPointCollection dataPointCollection = series0.getDataPoints(); | |
// Add data point to the first and second point of the first series. | |
ChartDataPoint dataPoint00 = dataPointCollection.add(0); | |
ChartDataPoint dataPoint01 = dataPointCollection.add(1); | |
// Set explosion. | |
dataPoint00.setExplosion(50); | |
// Set marker symbol and size. | |
dataPoint00.getMarker().setSymbol(MarkerSymbol.CIRCLE); | |
dataPoint00.getMarker().setSize(15); | |
dataPoint01.getMarker().setSymbol(MarkerSymbol.DIAMOND); | |
dataPoint01.getMarker().setSize(20); | |
// Add data point to the third point of the second series. | |
ChartDataPoint dataPoint12 = series1.getDataPoints().add(2); | |
dataPoint12.setInvertIfNegative(true); | |
dataPoint12.getMarker().setSymbol(MarkerSymbol.STAR); | |
dataPoint12.getMarker().setSize(20); | |
doc.save(dataDir + "SingleChartDataPointOfAChartSeries_out.docx"); |
يرجى الاطلاع على النتيجة أدناه:
كيفية العمل مع ChartDataLabel من واحد ChartSeries
باستخدام ChartDataLabel كنت قادرا على تحديد تنسيق تسمية بيانات واحدة من سلسلة الرسم البياني، مثل إظهار / إخفاء LegendKey, CategoryName, SeriesName, قيمة الخ:
// For complete examples and data files, please go to https://github.com/aspose-words/Aspose.Words-for-Java | |
Document doc = new Document(); | |
DocumentBuilder builder = new DocumentBuilder(doc); | |
Shape shape = builder.insertChart(ChartType.BAR, 432, 252); | |
// Get first series. | |
ChartSeries series0 = shape.getChart().getSeries().get(0); | |
series0.hasDataLabels(true); | |
// Set properties. | |
series0.getDataLabels().setShowLegendKey(true); | |
// By default, when you add data labels to the data points in a pie chart, leader lines are displayed for data labels that are | |
// positioned far outside the end of data points. Leader lines create a visual connection between a data label and its | |
// corresponding data point. | |
series0.getDataLabels().setShowLeaderLines(true); | |
series0.getDataLabels().setShowCategoryName(false); | |
series0.getDataLabels().setShowPercentage(false); | |
series0.getDataLabels().setShowSeriesName(true); | |
series0.getDataLabels().setShowValue(true); | |
series0.getDataLabels().setSeparator("/"); | |
series0.getDataLabels().setShowValue(true); | |
doc.save(dataDir + "ChartDataLabelOfASingleChartSeries_out.docx"); |
يرجى الاطلاع على النتيجة أدناه:
كيفية تحديد الخيارات الافتراضية لـ ChartDataLabels من ChartSeries
تحدد فئة ChartDataLabelCollection الخصائص التي يمكن استخدامها لتعيين الخيارات الافتراضية لـ ChartDataLabels للمخطط Series. وتشمل هذه الخصائصsetShowCategoryName, setShowBubbleSize, setShowPercentage, setShowSeriesName, setShowValue الخ:
// For complete examples and data files, please go to https://github.com/aspose-words/Aspose.Words-for-Java | |
Document doc = new Document(); | |
DocumentBuilder builder = new DocumentBuilder(doc); | |
Shape shape = builder.insertChart(ChartType.PIE, 432, 252); | |
Chart chart = shape.getChart(); | |
chart.getSeries().clear(); | |
ChartSeries series = chart.getSeries().add("Series 1", new String[] { "Category1", "Category2", "Category3" }, | |
new double[] { 2.7, 3.2, 0.8 }); | |
ChartDataLabelCollection labels = series.getDataLabels(); | |
labels.setShowPercentage(true); | |
labels.setShowValue(true); | |
labels.setShowLeaderLines(false); | |
labels.setSeparator(" - "); | |
doc.save(dataDir + "Demo.docx"); |
يرجى الاطلاع على النتيجة أدناه:
كيفية تنسيق رقم تسمية بيانات المخطط
باستخدام خاصية NumberFormat، يمكنك تحديد تنسيق رقم تسمية بيانات واحدة للمخطط.
يوضح مثال التعليمات البرمجية التالية كيفية تنسيق عدد من تسمية البيانات:
// For complete examples and data files, please go to https://github.com/aspose-words/Aspose.Words-for-Java | |
Document doc = new Document(); | |
DocumentBuilder builder = new DocumentBuilder(doc); | |
// Add chart with default data. | |
Shape shape = builder.insertChart(ChartType.LINE, 432, 252); | |
Chart chart = shape.getChart(); | |
chart.getTitle().setText("Data Labels With Different Number Format"); | |
// Delete default generated series. | |
chart.getSeries().clear(); | |
// Add new series | |
ChartSeries series0 = chart.getSeries().add("AW Series 0", new String[] { "AW0", "AW1", "AW2" }, | |
new double[] { 2.5, 1.5, 3.5 }); | |
series0.hasDataLabels(true); | |
// Set currency format code. | |
series0.getDataLabels().get(0).getNumberFormat().setFormatCode("\"$\"#,##0.00"); | |
// Set date format code. | |
series0.getDataLabels().get(1).getNumberFormat().setFormatCode("d/mm/yyyy"); | |
// Set percentage format code. | |
series0.getDataLabels().get(2).getNumberFormat().setFormatCode("0.00%"); | |
// Or you can set format code to be linked to a source cell, | |
// in this case NumberFormat will be reset to general and inherited from a | |
// source cell. | |
series0.getDataLabels().get(2).getNumberFormat().isLinkedToSource(true); | |
doc.save(dataDir + "NumberFormat_DataLabel_out.docx"); |
كيفية تعيين خصائص محور الرسم البياني
إذا كنت ترغب في العمل مع وحدات محور المخطط والقياس والعرض لمحور القيمة، فيرجى استخدام فئات ChartAxis و AxisDisplayUnit و AxisScaling.
يوضح مثال الكود التالي كيفية تعريف خصائص المحور س و ص:
// For complete examples and data files, please go to https://github.com/aspose-words/Aspose.Words-for-Java | |
Document doc = new Document(); | |
DocumentBuilder builder = new DocumentBuilder(doc); | |
// Insert chart. | |
Shape shape = builder.insertChart(ChartType.AREA, 432, 252); | |
Chart chart = shape.getChart(); | |
// Clear demo data. | |
chart.getSeries().clear(); | |
// Fill data. | |
chart.getSeries().add("AW Series 1", | |
new Date[]{new Date(2002, 1, 1), new Date(2002, 6, 1), new Date(2015, 7, 1), new Date(2015, 8, 1), new Date(2015, 9, 1)}, | |
new double[]{640, 320, 280, 120, 150}); | |
ChartAxis xAxis = chart.getAxisX(); | |
ChartAxis yAxis = chart.getAxisY(); | |
// Change the X axis to be category instead of date, so all the points will be put with equal interval on the X axis. | |
xAxis.setCategoryType(AxisCategoryType.CATEGORY); | |
// Define X axis properties. | |
xAxis.setCrosses(AxisCrosses.CUSTOM); | |
xAxis.setCrossesAt(3); // measured in display units of the Y axis (hundreds) | |
xAxis.setReverseOrder(true); | |
xAxis.setMajorTickMark(AxisTickMark.CROSS); | |
xAxis.setMinorTickMark(AxisTickMark.OUTSIDE); | |
xAxis.setTickLabelOffset(200); | |
// Define Y axis properties. | |
yAxis.setTickLabelPosition(AxisTickLabelPosition.HIGH); | |
yAxis.setMajorUnit(100); | |
yAxis.setMinorUnit(50); | |
yAxis.getDisplayUnit().setUnit(AxisBuiltInUnit.HUNDREDS); | |
yAxis.getScaling().setMinimum(new AxisBound(100)); | |
yAxis.getScaling().setMaximum(new AxisBound(700)); | |
dataDir = dataDir + "SetAxisProperties_out.docx"; | |
doc.save(dataDir); |
كيفية تعيين DateTime قيمة المحور
يوضح مثال التعليمات البرمجية التالية كيفية تعيين قيم التاريخ / الوقت إلى خصائص المحور:
// For complete examples and data files, please go to https://github.com/aspose-words/Aspose.Words-for-Java | |
Document doc = new Document(); | |
DocumentBuilder builder = new DocumentBuilder(doc); | |
// Insert chart. | |
Shape shape = builder.insertChart(ChartType.COLUMN, 432, 252); | |
Chart chart = shape.getChart(); | |
// Clear demo data. | |
chart.getSeries().clear(); | |
// Fill data. | |
chart.getSeries().add("AW Series 1", | |
new Date[]{new Date(2017, 11, 06), new Date(2017, 11, 9), new Date(2017, 11, 15), | |
new Date(2017, 11, 21), new Date(2017, 11, 25), new Date(2017, 11, 29)}, | |
new double[]{1.2, 0.3, 2.1, 2.9, 4.2, 5.3} | |
); | |
// Set X axis bounds. | |
ChartAxis xAxis = chart.getAxisX(); | |
xAxis.getScaling().setMinimum(new AxisBound(new Date(2017, 11, 5).getTime())); | |
xAxis.getScaling().setMaximum(new AxisBound(new Date(2017, 12, 3).getTime())); | |
// Set major units to a week and minor units to a day. | |
xAxis.setMajorUnit(7); | |
xAxis.setMinorUnit(1); | |
xAxis.setMajorTickMark(AxisTickMark.CROSS); | |
xAxis.setMinorTickMark(AxisTickMark.OUTSIDE); | |
dataDir = dataDir + "SetDateTimeValuesToAxis_out.docx"; | |
doc.save(dataDir); |
كيفية تنسيق قيمة رقم المحور
يوضح مثال التعليمات البرمجية التالية كيفية تغيير تنسيق الأرقام على محور القيمة:
// For complete examples and data files, please go to https://github.com/aspose-words/Aspose.Words-for-Java | |
Document doc = new Document(); | |
DocumentBuilder builder = new DocumentBuilder(doc); | |
// Insert chart. | |
Shape shape = builder.insertChart(ChartType.COLUMN, 432, 252); | |
Chart chart = shape.getChart(); | |
// Clear demo data. | |
chart.getSeries().clear(); | |
// Fill data. | |
chart.getSeries().add("AW Series 1", | |
new String[]{"Item 1", "Item 2", "Item 3", "Item 4", "Item 5"}, | |
new double[]{1900000, 850000, 2100000, 600000, 1500000}); | |
// Set number format. | |
chart.getAxisY().getNumberFormat().setFormatCode("#,##0"); | |
dataDir = dataDir + "FormatAxisNumber_out.docx"; | |
doc.save(dataDir); |
كيفية تعيين حدود المحور
تمثل فئة AxisBound
حدا أدنى أو أقصى لقيم المحور. يمكن تحديد ملزمة كقيمة رقمية أو تاريخ-وقت أو قيمة “تلقائية” خاصة.
يوضح مثال التعليمات البرمجية التالية كيفية تعيين حدود محور:
// For complete examples and data files, please go to https://github.com/aspose-words/Aspose.Words-for-Java | |
Document doc = new Document(); | |
DocumentBuilder builder = new DocumentBuilder(doc); | |
// Insert chart. | |
Shape shape = builder.insertChart(ChartType.COLUMN, 432, 252); | |
Chart chart = shape.getChart(); | |
// Clear demo data. | |
chart.getSeries().clear(); | |
// Fill data. | |
chart.getSeries().add("AW Series 1", | |
new String[]{"Item 1", "Item 2", "Item 3", "Item 4", "Item 5"}, | |
new double[]{1.2, 0.3, 2.1, 2.9, 4.2}); | |
chart.getAxisY().getScaling().setMinimum(new AxisBound(0)); | |
chart.getAxisY().getScaling().setMaximum(new AxisBound(6)); | |
dataDir = dataDir + "SetboundsOfAxis_out.docx"; | |
doc.save(dataDir); |
كيفية تعيين وحدة الفاصل الزمني بين التسميات
يوضح مثال التعليمات البرمجية التالية كيفية تعيين وحدة الفاصل الزمني بين التسميات على محور:
// For complete examples and data files, please go to https://github.com/aspose-words/Aspose.Words-for-Java | |
Document doc = new Document(); | |
DocumentBuilder builder = new DocumentBuilder(doc); | |
// Insert chart. | |
Shape shape = builder.insertChart(ChartType.COLUMN, 432, 252); | |
Chart chart = shape.getChart(); | |
// Clear demo data. | |
chart.getSeries().clear(); | |
// Fill data. | |
chart.getSeries().add("AW Series 1", | |
new String[]{"Item 1", "Item 2", "Item 3", "Item 4", "Item 5"}, | |
new double[]{1.2, 0.3, 2.1, 2.9, 4.2}); | |
chart.getAxisX().setTickLabelSpacing(2); | |
dataDir = dataDir + "SetIntervalUnitBetweenLabelsOnAxis_out.docx"; | |
doc.save(dataDir); |
كيفية إخفاء محور الرسم البياني
إذا كنت تريد إظهار أو إخفاء محور المخطط، يمكنك ببساطة تحقيق ذلك عن طريق تعيين قيمة ChartAxis.Hidden
خاصية.
يوضح مثال الكود التالي كيفية إخفاء المحور الصادي للمخطط:
// For complete examples and data files, please go to https://github.com/aspose-words/Aspose.Words-for-Java | |
Document doc = new Document(); | |
DocumentBuilder builder = new DocumentBuilder(doc); | |
// Insert chart. | |
Shape shape = builder.insertChart(ChartType.COLUMN, 432, 252); | |
Chart chart = shape.getChart(); | |
// Clear demo data. | |
chart.getSeries().clear(); | |
// Fill data. | |
chart.getSeries().add("AW Series 1", | |
new String[]{"Item 1", "Item 2", "Item 3", "Item 4", "Item 5"}, | |
new double[]{1.2, 0.3, 2.1, 2.9, 4.2}); | |
// Hide the Y axis. | |
chart.getAxisY().setHidden(true); | |
dataDir = dataDir + "HideChartAxis_out.docx"; | |
doc.save(dataDir); |
كيفية محاذاة تسمية المخطط
إذا كنت ترغب في تعيين محاذاة نص للتسميات متعددة الأسطر، فيمكنك ببساطة تحقيق ذلك عن طريق تعيين قيمة setTickLabelAlignment() خاصية.
يوضح مثال الكود التالي كيفية تحديد محاذاة التسمية:
// For complete examples and data files, please go to https://github.com/aspose-words/Aspose.Words-for-Java | |
Document doc = new Document(dataDir + "Document.docx"); | |
Shape shape = (Shape) doc.getChild(NodeType.SHAPE, 0, true); | |
ChartAxis axis = shape.getChart().getAxisX(); | |
//This property has effect only for multi-line labels. | |
axis.setTickLabelAlignment(ParagraphAlignment.RIGHT); | |
doc.save(dataDir + "Document_out.docx"); |
كيفية تعيين تنسيق التعبئة والسكتة الدماغية
يمكن تعيين تنسيق التعبئة والسكتة الدماغية لسلسلة المخططات ونقاط البيانات والعلامات. للقيام بذلك، تحتاج إلى استخدام خصائص ChartFormat
اكتب في ChartSeries، ChartDataPoint، و ChartMarker الطبقات، وكذلك الأسماء المستعارة لبعض الخصائص، مثل ForeColor، BackColor، مرئية، والشفافية في فئة Stroke
.
يوضح مثال الكود التالي كيفية تعيين لون السلسلة:
Document doc = new Document();
DocumentBuilder builder = new DocumentBuilder(doc);
Shape shape = builder.InsertChart(ChartType.Column, 432, 252);
Chart chart = shape.Chart;
ChartSeriesCollection seriesColl = chart.Series;
// Delete default generated series.
seriesColl.Clear();
// Create category names array.
string[] categories = new string[] { "AW Category 1", "AW Category 2" };
// Adding new series. Value and category arrays must be the same size.
ChartSeries series1 = seriesColl.Add("AW Series 1", categories, new double[] { 1, 2 });
ChartSeries series2 = seriesColl.Add("AW Series 2", categories, new double[] { 3, 4 });
ChartSeries series3 = seriesColl.Add("AW Series 3", categories, new double[] { 5, 6 });
// Set series color.
series1.Format.Fill.ForeColor = Color.Red;
series2.Format.Fill.ForeColor = Color.Yellow;
series3.Format.Fill.ForeColor = Color.Blue;
doc.Save("ColumnColor.docx");
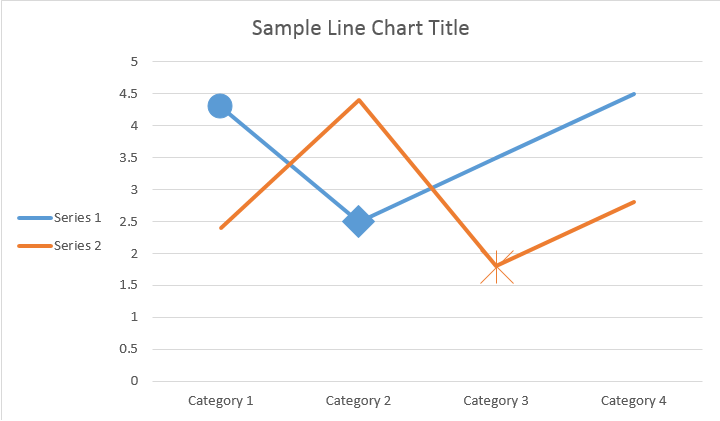
يوضح مثال الكود التالي كيفية تعيين لون الخط ووزنه:
Document doc = new Document();
DocumentBuilder builder = new DocumentBuilder(doc);
Shape shape = builder.InsertChart(ChartType.Line, 432, 252);
Chart chart = shape.Chart;
ChartSeriesCollection seriesColl = chart.Series;
// Delete default generated series.
seriesColl.Clear();
// Adding new series.
ChartSeries series1 = seriesColl.Add("AW Series 1", new double[] { 0.7, 1.8, 2.6 }, new double[] { 2.7, 3.2, 0.8 });
ChartSeries series2 = seriesColl.Add("AW Series 2", new double[] { 0.5, 1.5, 2.5 }, new double[] { 3, 1, 2 });
// Set series color.
series1.Format.Stroke.ForeColor = Color.Red;
series1.Format.Stroke.Weight = 5;
series2.Format.Stroke.ForeColor = Color.LightGreen;
series2.Format.Stroke.Weight = 5;
doc.Save("LineColorAndWeight.docx");