Analyzing your prompt, please hold on...
An error occurred while retrieving the results. Please refresh the page and try again.
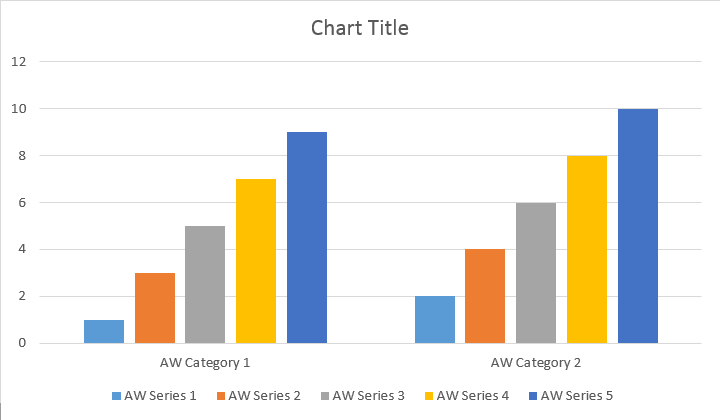
Se agregó un nuevo método InsertChart a la clase DocumentBuilder. Entonces, veamos cómo insertar un gráfico de columnas simple en el documento usando el método InsertChart.
En esta sección aprenderemos cómo insertar un gráfico en un documento.
El siguiente ejemplo de código muestra cómo insertar un gráfico de columnas:
El código produce el siguiente resultado:
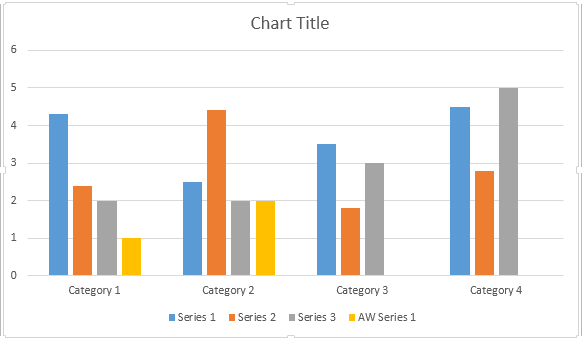
Hay cuatro sobrecargas diferentes para el método Agregar serie, que se expuso para cubrir todas las variantes posibles de fuentes de datos para todos los tipos de gráficos:
El código produce el siguiente resultado:
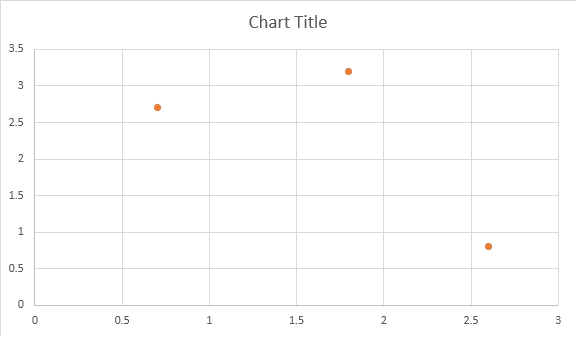
El siguiente ejemplo de código muestra cómo insertar un gráfico de dispersión:
El código produce el siguiente resultado:
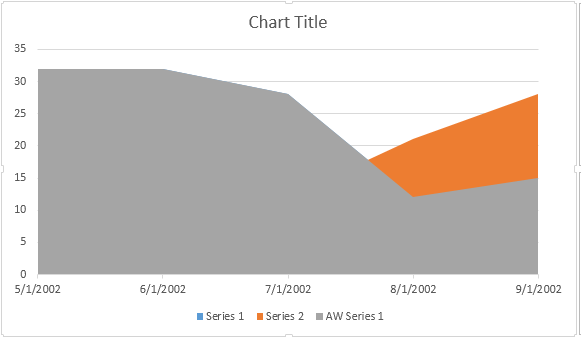
El siguiente ejemplo de código muestra cómo insertar un gráfico de áreas:
El código produce el siguiente resultado:
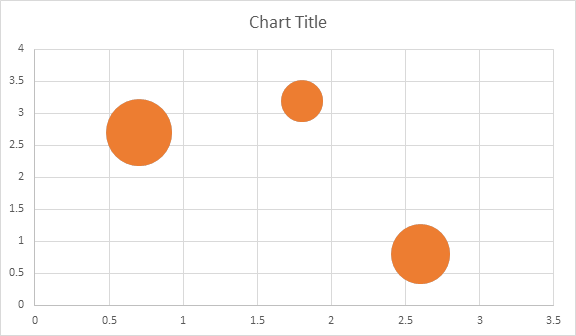
El siguiente ejemplo de código muestra cómo insertar un gráfico de burbujas:
El código produce el siguiente resultado:
Shape.ChartUna vez que el gráfico se insertó y se llenó con datos, podrá cambiar su apariencia. La propiedad Shape.Chart contiene todas las opciones relacionadas con gráficos disponibles a través del API público.
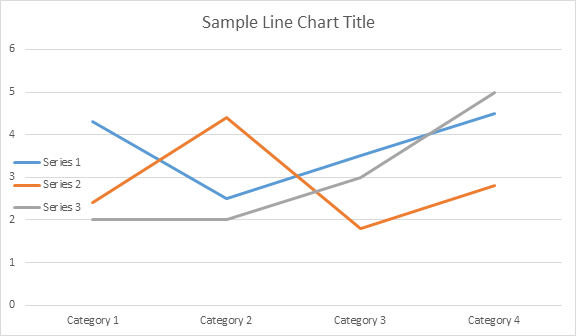
Por ejemplo, cambiemos el título del gráfico o el comportamiento de la leyenda:
El código genera los siguientes resultados:
Echemos un vistazo a la colección ChartSeries. Todas las series de gráficos están disponibles a través de la colección chart.Series, que es IEnumerable:
Puede eliminar series una por una o borrarlas todas, así como agregar una nueva si es necesario. El gráfico recién insertado tiene algunas series predeterminadas agregadas a esta colección. Para eliminarlos es necesario llamar al método gráfico.Series.Clear().
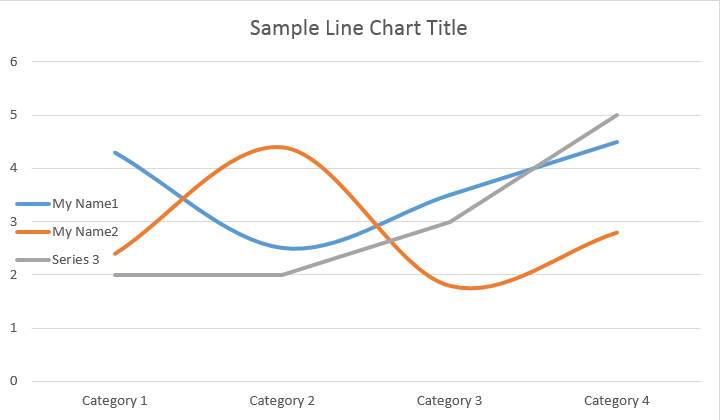
A continuación se explica cómo trabajar con una serie en particular:
Por favor vea el resultado a continuación:
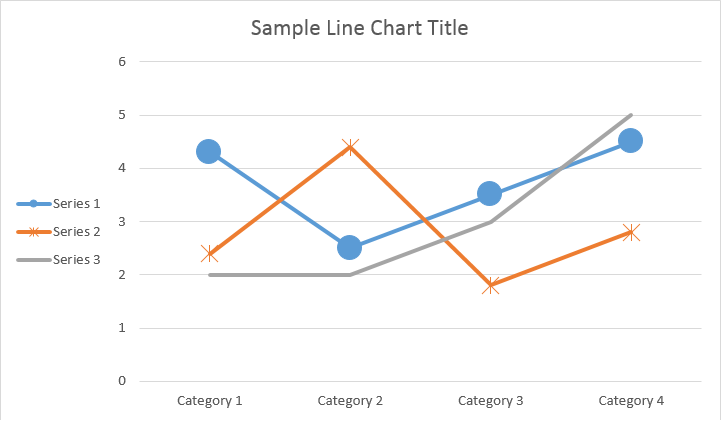
Todos los ChartSeries individuales tienen opciones de ChartDataPoint predeterminadas; intente usar el siguiente código para cambiarlas:
Por favor vea el resultado a continuación:
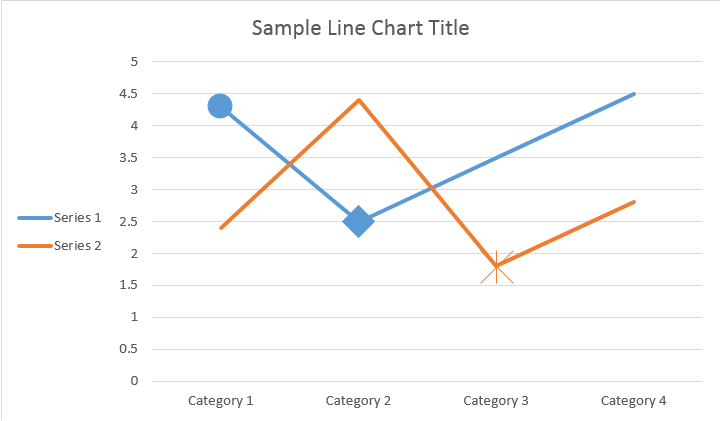
ChartSeriesCon ChartDataPoint puede personalizar el formato de un único punto de datos de la serie de gráficos:
Por favor vea el resultado a continuación:
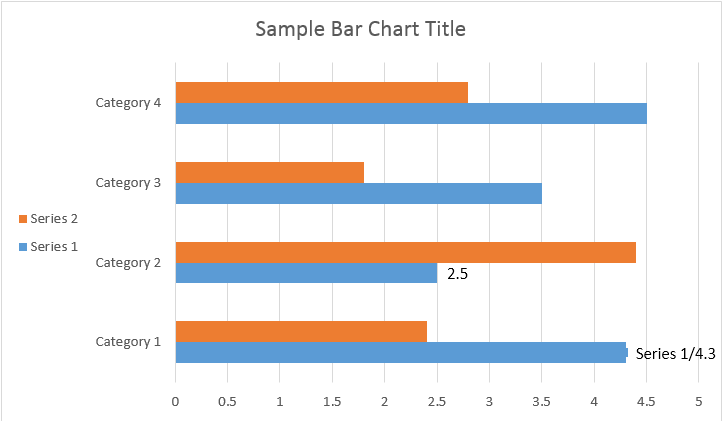
Con ChartDataLabel puede especificar el formato de una única etiqueta de datos de la serie de gráficos, como mostrar/ocultar LegendKey, CategoryName, SeriesName, Value, etc.
Por favor vea el resultado a continuación:
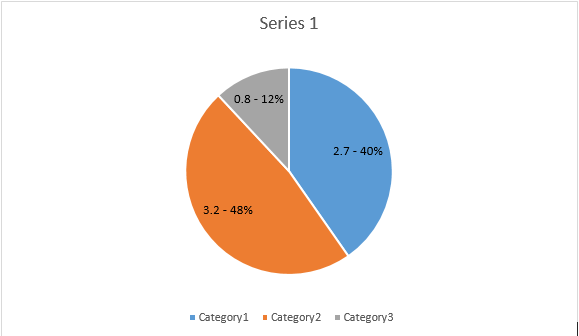
La clase ChartDataLabelCollection define propiedades que se pueden utilizar para establecer opciones predeterminadas para ChartDataLabels para Chart Series. Estas propiedades incluyen ShowCategoryName, ShowBubbleSize, ShowPercentage, ShowSeriesName, ShowValue, etc.:
Por favor vea el resultado a continuación:
Con NumberFormat puede especificar el formato numérico de una única etiqueta de datos del gráfico.
El siguiente ejemplo de código muestra cómo formatear un número de la etiqueta de datos:
Si desea trabajar con el eje del gráfico, la escala y las unidades de visualización para el eje de valores, utilice las clases ChartAxis, AxisDisplayUnit y AxisScaling.
El siguiente ejemplo de código muestra cómo definir las propiedades de los ejes X e Y:
El siguiente ejemplo de código muestra cómo establecer valores de fecha/hora en las propiedades del eje:
El siguiente ejemplo de código muestra cómo cambiar el formato de los números en el eje de valores:
La clase AxisBound representa un límite mínimo o máximo de valores de eje. El límite se puede especificar como un valor numérico, de fecha y hora o un valor “automático” especial.
El siguiente ejemplo de código muestra cómo establecer los límites de un eje:
El siguiente ejemplo de código muestra cómo configurar la unidad de intervalo entre etiquetas en un eje:
Si desea mostrar u ocultar el eje del gráfico, simplemente puede lograrlo estableciendo el valor de la propiedad ChartAxis.Hidden.
El siguiente ejemplo de código muestra cómo ocultar el eje Y del gráfico:
Si desea establecer una alineación de texto para etiquetas de varias líneas, simplemente puede lograrlo estableciendo el valor de la propiedad TickLabels.Alignment.
El siguiente ejemplo de código muestra cómo marcar la alineación de la etiqueta:
Se puede configurar el formato de relleno y trazo para series de gráficos, puntos de datos y marcadores. Para hacer esto, necesita usar las propiedades del tipo ChartFormat en las clases ChartSeries, ChartDataPoint y ChartMarker, así como alias para algunas propiedades, como ForeColor, BackColor, Visible y Transparency en la clase Stroke.
El siguiente ejemplo de código muestra cómo configurar el color de la serie:
Document doc = new Document();
DocumentBuilder builder = new DocumentBuilder(doc);

Shape shape = builder.InsertChart(ChartType.Column, 432, 252);

Chart chart = shape.Chart;
ChartSeriesCollection seriesColl = chart.Series;

// Delete default generated series.
seriesColl.Clear();

// Create category names array.
string[] categories = new string[] { "AW Category 1", "AW Category 2" };

// Adding new series. Value and category arrays must be the same size.
ChartSeries series1 = seriesColl.Add("AW Series 1", categories, new double[] { 1, 2 });
ChartSeries series2 = seriesColl.Add("AW Series 2", categories, new double[] { 3, 4 });
ChartSeries series3 = seriesColl.Add("AW Series 3", categories, new double[] { 5, 6 });

// Set series color.
series1.Format.Fill.ForeColor = Color.Red;
series2.Format.Fill.ForeColor = Color.Yellow;
series3.Format.Fill.ForeColor = Color.Blue;

doc.Save(dir + "ColumnColor.docx");
El siguiente ejemplo de código muestra cómo establecer el color y el grosor de la línea:
Document doc = new Document();
DocumentBuilder builder = new DocumentBuilder(doc);

Shape shape = builder.InsertChart(ChartType.Line, 432, 252);

Chart chart = shape.Chart;
ChartSeriesCollection seriesColl = chart.Series;

// Delete default generated series.
seriesColl.Clear();

// Adding new series.
ChartSeries series1 = seriesColl.Add("AW Series 1", new double[] { 0.7, 1.8, 2.6 },
	new double[] { 2.7, 3.2, 0.8 });
ChartSeries series2 = seriesColl.Add("AW Series 2", new double[] { 0.5, 1.5, 2.5 },
	new double[] { 3, 1, 2 });

// Set series color.
series1.Format.Stroke.ForeColor = Color.Red;
series1.Format.Stroke.Weight = 5;
series2.Format.Stroke.ForeColor = Color.LightGreen;
series2.Format.Stroke.Weight = 5;

doc.Save(dir + "LineColorAndWeight.docx");
Analyzing your prompt, please hold on...
An error occurred while retrieving the results. Please refresh the page and try again.