- For a chart of another type, add a single `x` tag to the chart title after the corresponding `foreach` tag. An x-value expression has the following restrictions depending on a chart type: - For a scatter, bubble, or histogram chart, an x-value expression must return a numeric value. - For a treemap or sunburst chart, an x-value expression corresponds to leaves and must return a string value. - For a chart of another type, an x-value expression must return a numeric, date, or string value. 1. For a treemap or sunburst chart, add `x2` and `x3` tags (corresponding to stems and branches respectively) to the chart title as follows. {{< highlight csharp >}}<
{{< highlight csharp >}}<
{{< highlight csharp >}}<
**Note –** A closing `foreach` tag is not used for a chart. While composing expressions for `x`, `x2`, `x3`, `y`, and `size` tags, you can normally reference an iteration variable declared at the corresponding `foreach` tag in a chart title in the same way as if you intended to output results of expressions within a data band. **Note –** You can normally use charts with dynamic data within data bands. During runtime, a chart with a `foreach` tag in its title is processed by the engine as follows: 1. A sequence expression declared at the `foreach` tag is evaluated and iterated. 1. For every sequence item, expressions declared at `x`, `x2`, `x3`, `y`, and `size` tags are evaluated. 1. Results of these expressions are used to populate corresponding chart series. 1. All `foreach`, `x`, `x2`, `x3`, `y`, and `size` tags are removed from the chart title and chart series’ names. Consider the following example. Assume that you have the `Manager` and `Contract` classes defined in your application as follows. {{< highlight csharp >}} public class Manager { public String getName getName() { ... } public Iterable
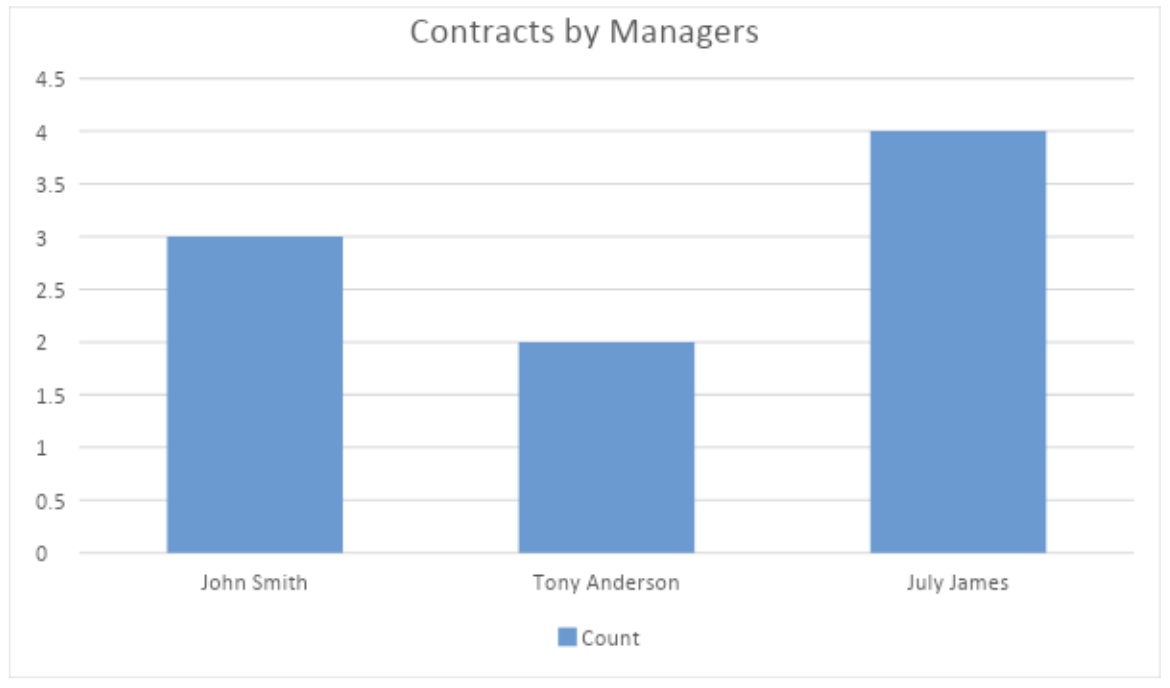
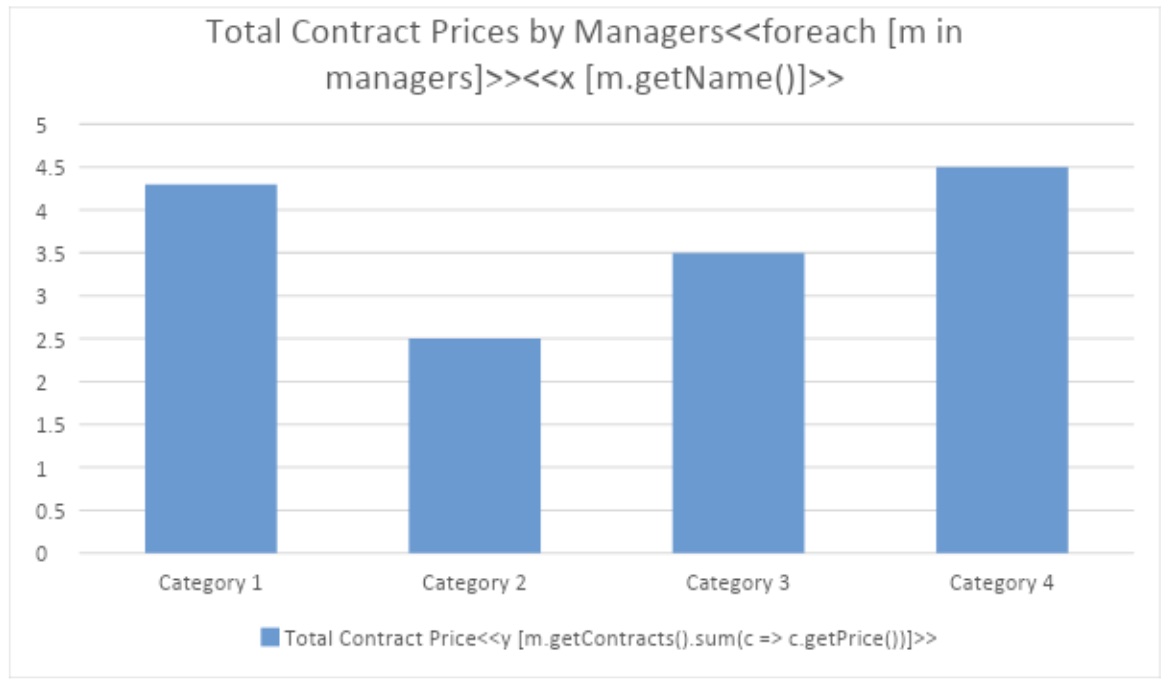 In this case, the engine produces a report as follows.
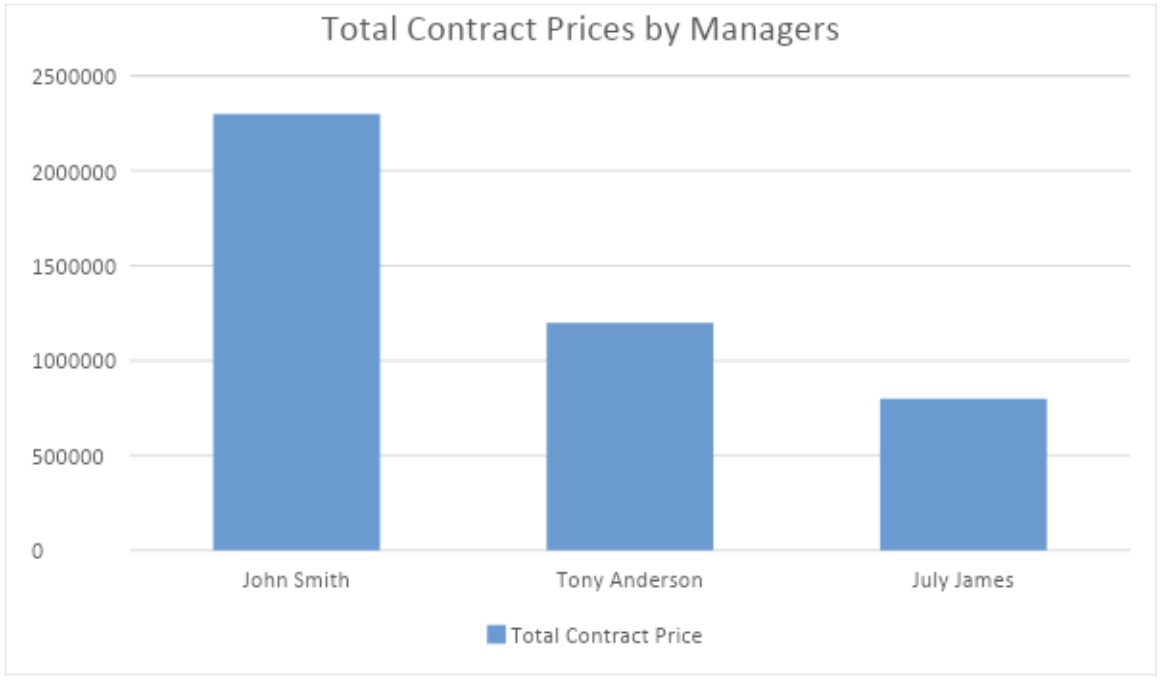 For more examples of templates for typical scenarios involving charts, see “ REF typicalTemplates Appendix C. Typical Templates”.
## Including Chart Series Dynamically
For a chart with dynamic data, you can select which series to include into it dynamically based upon conditions. In particular, this feature is useful when you need to restrict access to sensitive data in chart series for some users of your application. To use the feature, do the following steps:
1. Declare a chart with dynamic data in the usual way.
1. For series to be removed from the chart based upon conditions dynamically, define the conditions in names of these series using `removeif` tags having the following syntax.
{{< highlight csharp >}}
<
For more examples of templates for typical scenarios involving charts, see “ REF typicalTemplates Appendix C. Typical Templates”.
## Including Chart Series Dynamically
For a chart with dynamic data, you can select which series to include into it dynamically based upon conditions. In particular, this feature is useful when you need to restrict access to sensitive data in chart series for some users of your application. To use the feature, do the following steps:
1. Declare a chart with dynamic data in the usual way.
1. For series to be removed from the chart based upon conditions dynamically, define the conditions in names of these series using `removeif` tags having the following syntax.
{{< highlight csharp >}}
<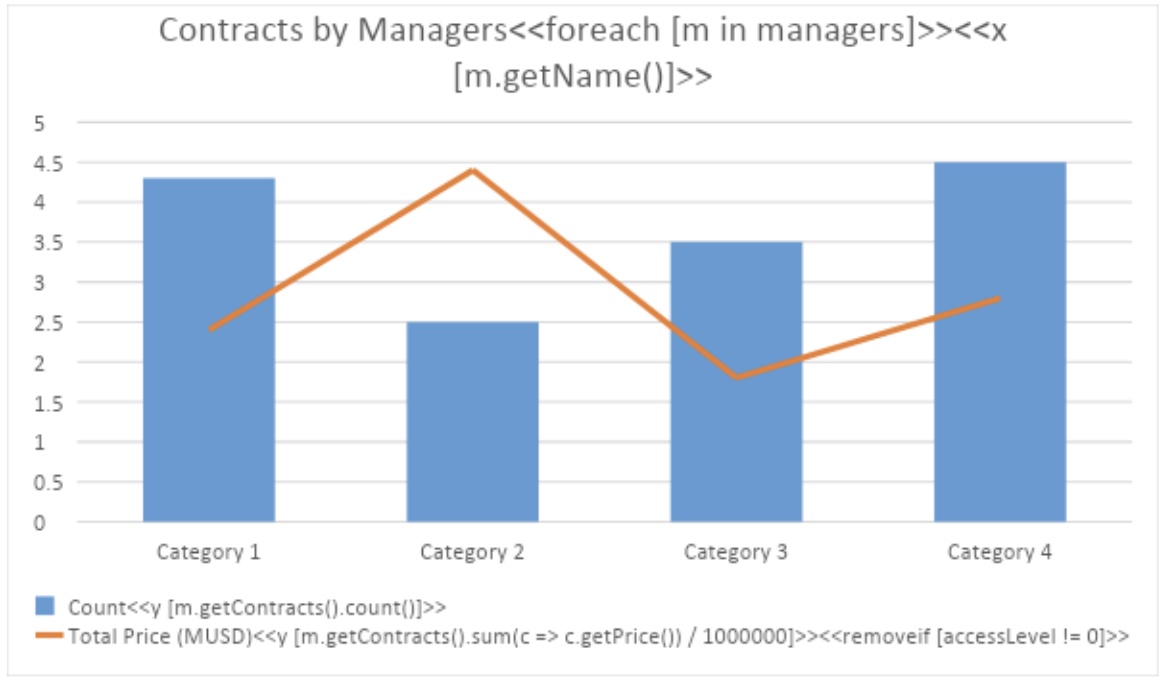 If `accessLevel` is equal to zero, the engine produces a report as follows.
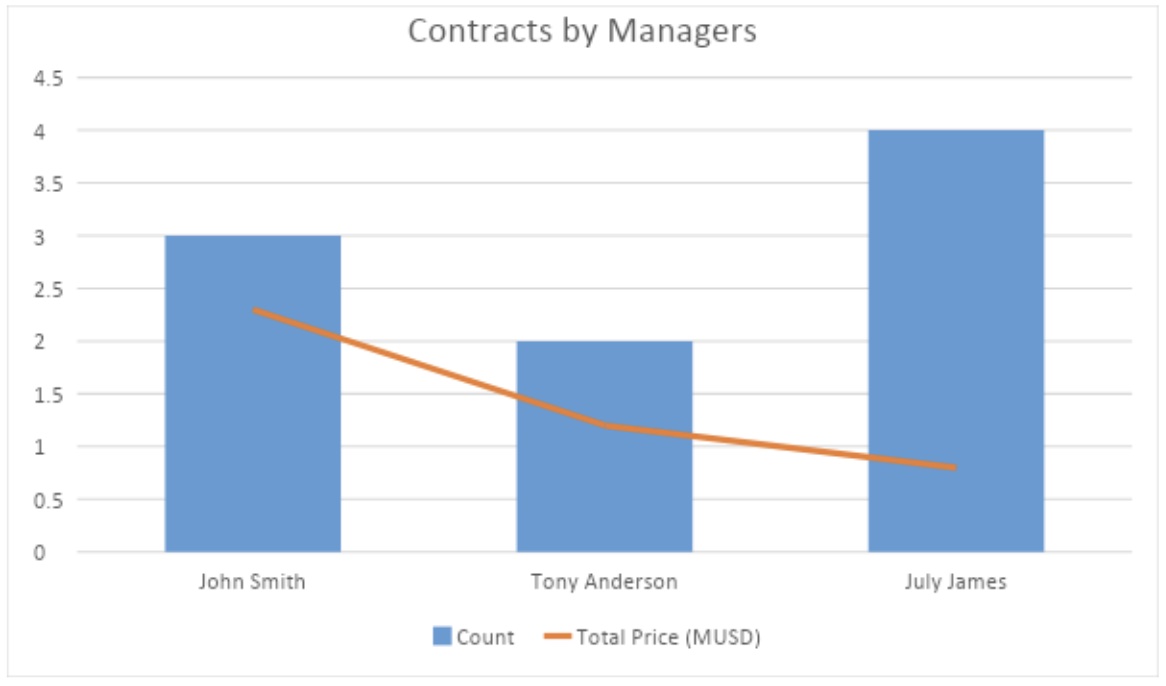 If `accessLevel` is not equal to zero, the engine produces a report as follows.
 ## Setting Chart Series Colors Dynamically
For a chart with dynamic data, you can set colors of chart series dynamically based upon expressions. To use the feature, do the following steps:
1. Declare a chart with dynamic data in the usual way.
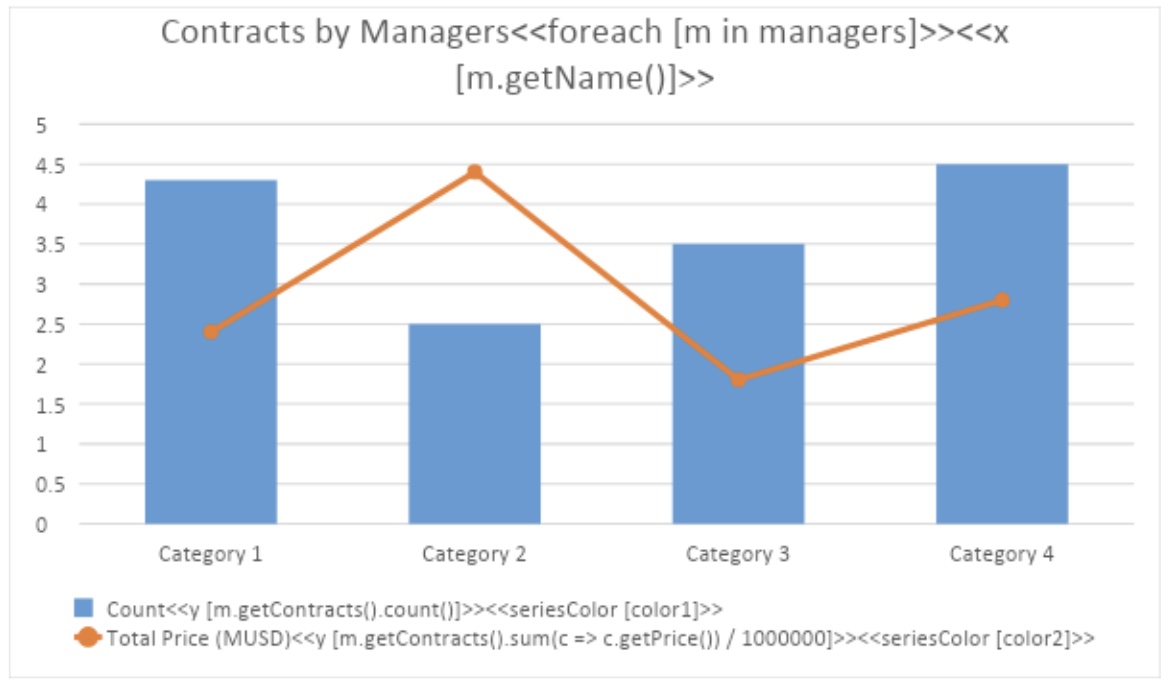
1. For chart series to be colored dynamically, define corresponding color expressions in names of these series using `seriesColor` tags having the following syntax.
{{< highlight csharp >}}
<
## Setting Chart Series Colors Dynamically
For a chart with dynamic data, you can set colors of chart series dynamically based upon expressions. To use the feature, do the following steps:
1. Declare a chart with dynamic data in the usual way.
1. For chart series to be colored dynamically, define corresponding color expressions in names of these series using `seriesColor` tags having the following syntax.
{{< highlight csharp >}}
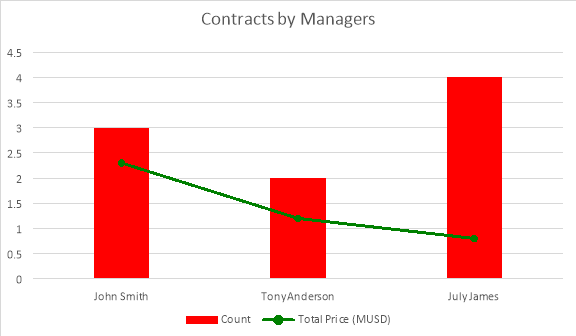
< In this case, the engine produces a report as follows.
 ## Setting Chart Series Point Colors Dynamically
For a chart with dynamic data, you can set colors of individual chart series points dynamically based upon expressions. To use the feature, do the following steps:
1. Declare a chart with dynamic data in the usual way.
1. For chart series with points to be colored dynamically, define corresponding color expressions in names of these series using `pointColor` tags having the following syntax.
{{< highlight csharp >}}<
## Setting Chart Series Point Colors Dynamically
For a chart with dynamic data, you can set colors of individual chart series points dynamically based upon expressions. To use the feature, do the following steps:
1. Declare a chart with dynamic data in the usual way.
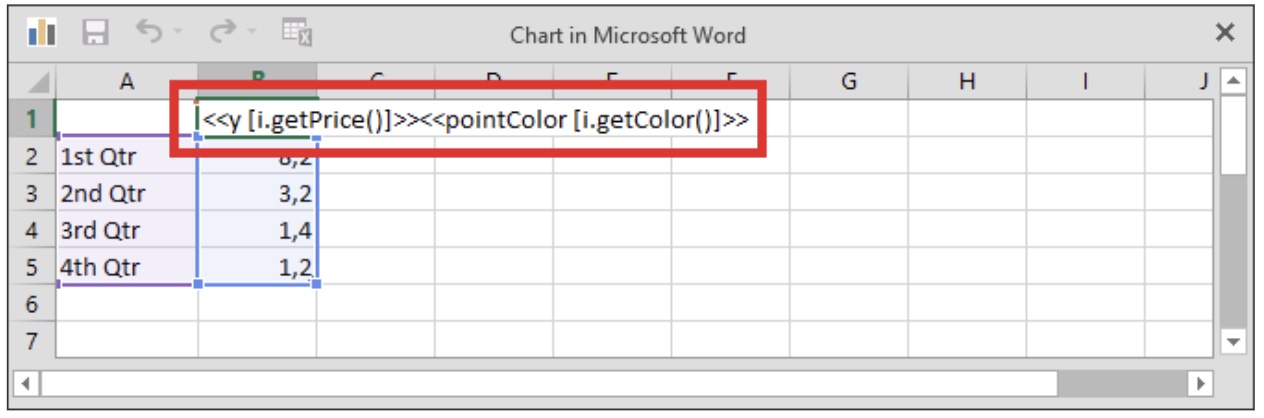
1. For chart series with points to be colored dynamically, define corresponding color expressions in names of these series using `pointColor` tags having the following syntax.
{{< highlight csharp >}}<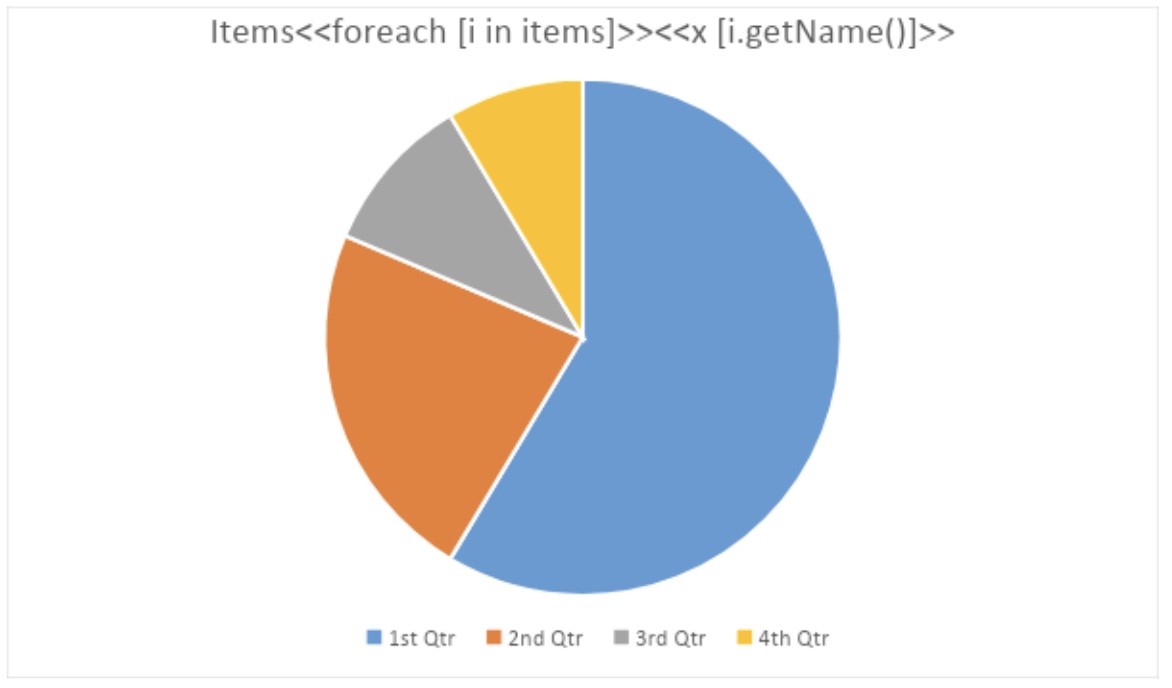 The series name for the template chart is defined as follows.
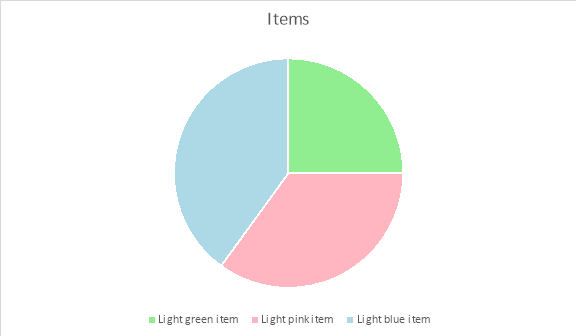
 In this case, the engine produces a report as follows.
## Setting Chart Title, Series Names, and Axis Titles Dynamically
You can normally use common expression tags in chart titles, series names, and axis titles, thus forming their contents dynamically. This feature can be used for any chart defined in a template even for the one that is not populated with data dynamically like in the following example.
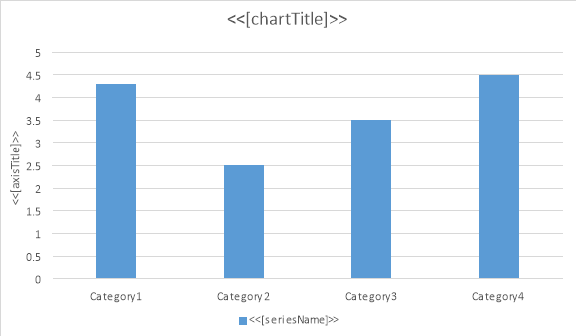
Given that `chartTitle`, `seriesName`, and `axisName` are strings taking values “Chart Title”, “Series Name”, and “Axis Title” respectively, you can use the following chart template to set the chart’s title, series name, and axis title dynamically.
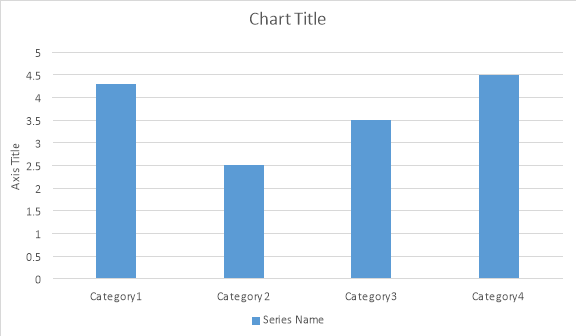
In this case, the engine produces a report as follows.
**Note –** You can normally apply this approach to a chart dynamically populated with data.
In this case, the engine produces a report as follows.

## Setting Chart Title, Series Names, and Axis Titles Dynamically
You can normally use common expression tags in chart titles, series names, and axis titles, thus forming their contents dynamically. This feature can be used for any chart defined in a template even for the one that is not populated with data dynamically like in the following example.
Given that `chartTitle`, `seriesName`, and `axisName` are strings taking values “Chart Title”, “Series Name”, and “Axis Title” respectively, you can use the following chart template to set the chart’s title, series name, and axis title dynamically.

In this case, the engine produces a report as follows.

**Note –** You can normally apply this approach to a chart dynamically populated with data.