Analyzing your prompt, please hold on...
An error occurred while retrieving the results. Please refresh the page and try again.
新的insertChart方法被添加到DocumentBuilder类中。 所以,让我们看看如何使用insertChart方法将简单的柱形图插入到文档中。
在本节中,我们将学习如何将图表插入到文档中。
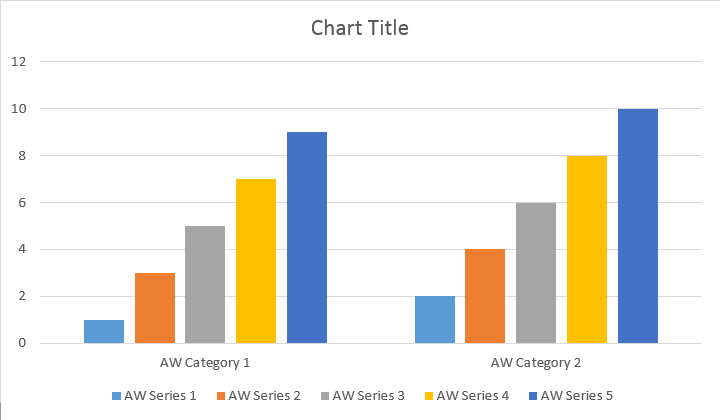
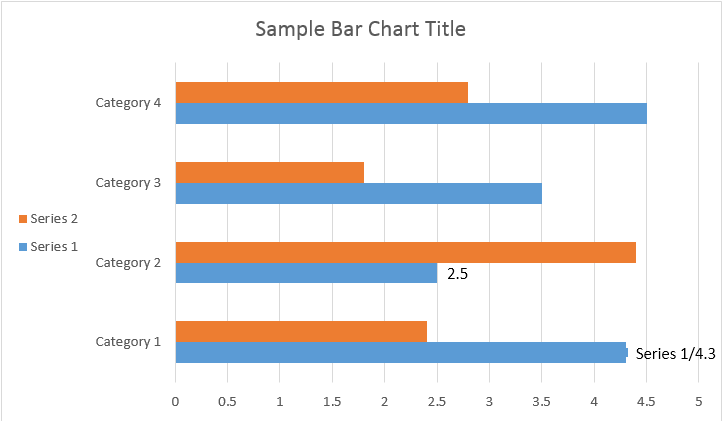
下面的代码示例演示如何插入柱形图:
代码产生以下结果:
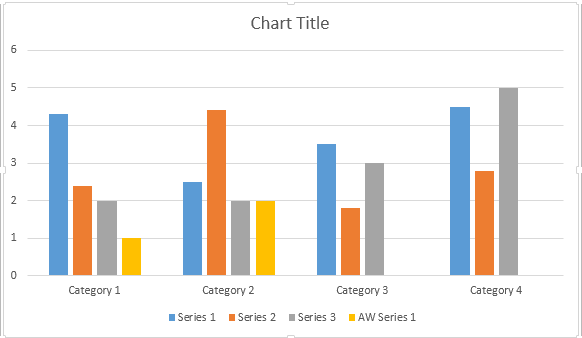
Series Add方法有四种不同的重载,这些重载被公开以涵盖所有图表类型的数据源的所有可能变体:
代码产生以下结果:
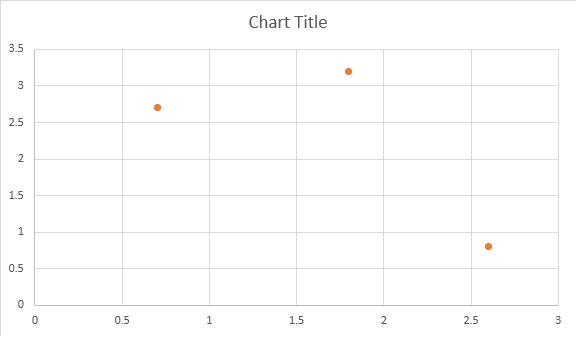
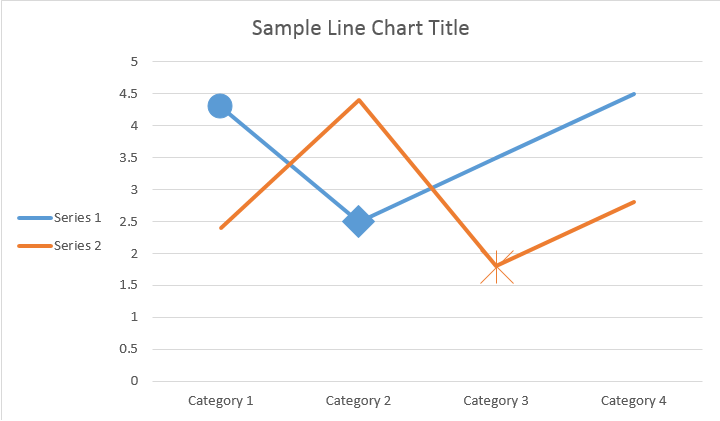
下面的代码示例演示如何插入散点图:
代码产生以下结果:
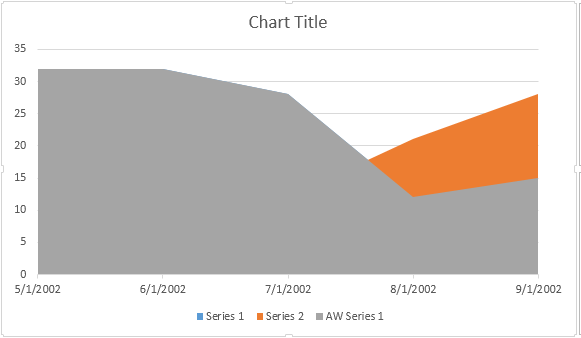
下面的代码示例演示如何插入面积图:
代码产生以下结果:
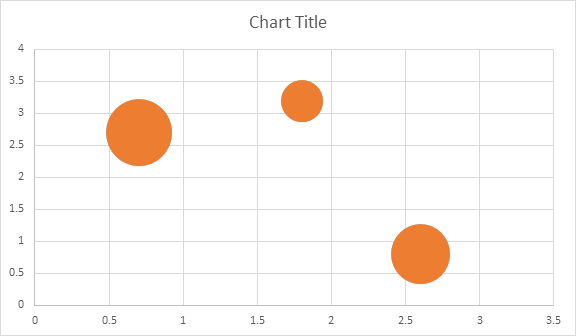
下面的代码示例演示如何插入气泡图:
代码产生以下结果:
Shape.Chart对象处理图表一旦图表被插入并填充了数据,您就可以改变它的外观。 Shape.Chart属性包含通过公共API提供的所有图表相关选项。
例如,让我们更改图表标题或图例行为:
代码生成如下结果:
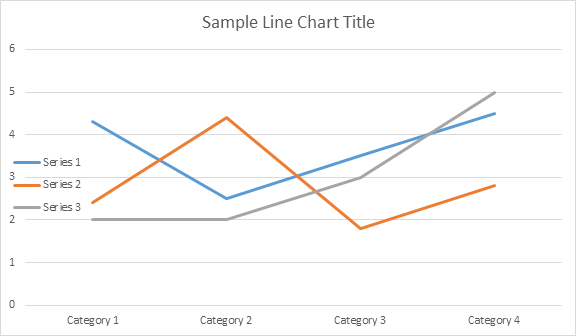
让我们来看看ChartSeries集合。 所有图表系列都可以通过chart.getSeries()集合获得,即Iterable:
您可以逐个删除系列或清除所有系列,并在需要时添加新系列。 新插入的图表有一些默认序列添加到此集合中。 要删除它们,您需要调用**chart.getSeries().clear()**方法。
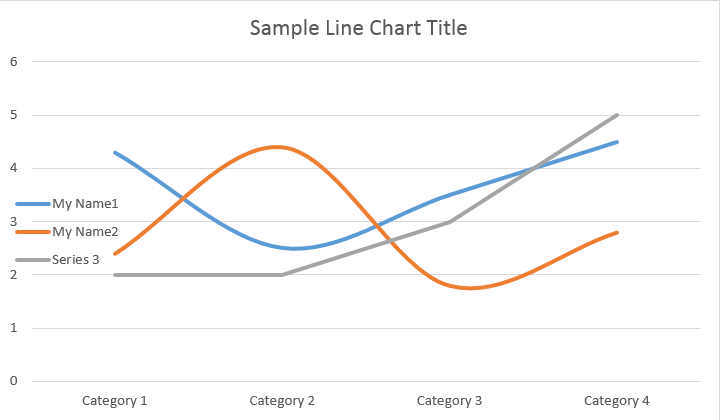
以下是如何使用特定系列。
请参阅下面的结果:
所有单个ChartSeries都有默认的ChartDataPoint选项,请尝试使用以下代码更改它们:
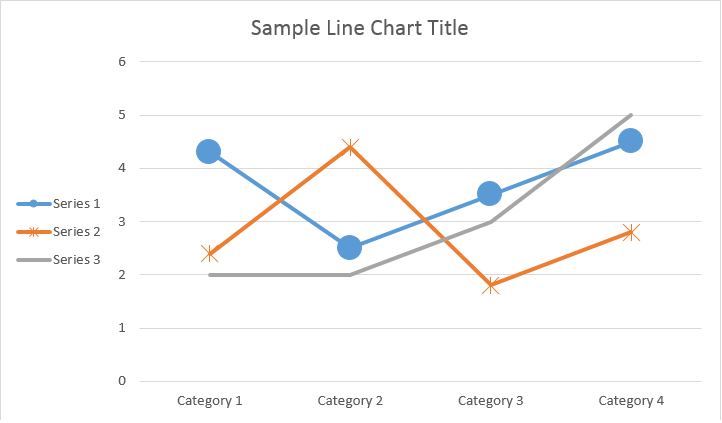
ChartSeries的单个ChartDataPoint使用ChartDataPoint,您可以自定义图表系列的单个数据点的格式:
请参阅下面的结果:
使用ChartDataLabel,您可以指定图表系列的单个数据标签的格式,如显示/隐藏LegendKey, CategoryName, SeriesName, 价值等:
请参阅下面的结果:
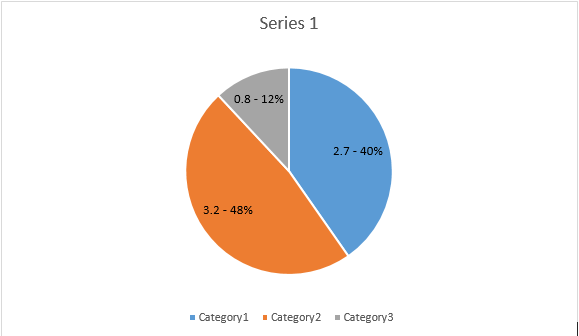
ChartDataLabelCollection类定义可用于为图表Series设置ChartDataLabels的默认选项的属性。 这些属性包括setShowCategoryName, setShowBubbleSize, setShowPercentage, setShowSeriesName, setShowValue 等:
请参阅下面的结果:
使用NumberFormat属性,可以指定图表的单个数据标签的数字格式。
下面的代码示例演示如何格式化数据标签的数字:
如果要为值轴处理图表轴、缩放和显示单位,请使用ChartAxis、AxisDisplayUnit和AxisScaling类。
下面的代码示例演示如何定义X和Y轴属性:
下面的代码示例演示如何将日期/时间值设置为轴属性:
下面的代码示例演示如何更改值轴上的数字格式:
AxisBound类表示轴值的最小值或最大值。 绑定可以指定为数字,日期时间或特殊的"自动"值。
下面的代码示例演示如何设置轴的边界:
下面的代码示例演示如何设置轴上标签之间的间隔单位:
如果要显示或隐藏图表轴,只需通过设置ChartAxis.Hidden属性的值即可实现此目的。
下面的代码示例演示如何隐藏图表的Y轴:
如果要为多行标签设置文本对齐方式,可以通过设置setTickLabelAlignment()属性的值来简单地实现这一点。
下面的代码示例演示如何勾选标签对齐:
可以为图表系列、数据点和标记设置填充和笔画格式。 为此,您需要在ChartSeries,ChartDataPoint和ChartMarker类中使用ChartFormat类型的属性,以及某些属性的别名,例如ForeColor,BackColor,可见和Stroke类中的透明度。
下面的代码示例演示如何设置系列颜色:
Document doc = new Document();
DocumentBuilder builder = new DocumentBuilder(doc);

Shape shape = builder.InsertChart(ChartType.Column, 432, 252);

Chart chart = shape.Chart;
ChartSeriesCollection seriesColl = chart.Series;

// Delete default generated series.
seriesColl.Clear();

// Create category names array.
string[] categories = new string[] { "AW Category 1", "AW Category 2" };

// Adding new series. Value and category arrays must be the same size.
ChartSeries series1 = seriesColl.Add("AW Series 1", categories, new double[] { 1, 2 });
ChartSeries series2 = seriesColl.Add("AW Series 2", categories, new double[] { 3, 4 });
ChartSeries series3 = seriesColl.Add("AW Series 3", categories, new double[] { 5, 6 });

// Set series color.
series1.Format.Fill.ForeColor = Color.Red;
series2.Format.Fill.ForeColor = Color.Yellow;
series3.Format.Fill.ForeColor = Color.Blue;

doc.Save("ColumnColor.docx");
下面的代码示例演示如何设置线条颜色和权重:
Document doc = new Document();
DocumentBuilder builder = new DocumentBuilder(doc);

Shape shape = builder.InsertChart(ChartType.Line, 432, 252);

Chart chart = shape.Chart;
ChartSeriesCollection seriesColl = chart.Series;

// Delete default generated series.
seriesColl.Clear();

// Adding new series.
ChartSeries series1 = seriesColl.Add("AW Series 1", new double[] { 0.7, 1.8, 2.6 }, new double[] { 2.7, 3.2, 0.8 });
ChartSeries series2 = seriesColl.Add("AW Series 2", new double[] { 0.5, 1.5, 2.5 }, new double[] { 3, 1, 2 });

// Set series color.
series1.Format.Stroke.ForeColor = Color.Red;
series1.Format.Stroke.Weight = 5;
series2.Format.Stroke.ForeColor = Color.LightGreen;
series2.Format.Stroke.Weight = 5;

doc.Save("LineColorAndWeight.docx");
Analyzing your prompt, please hold on...
An error occurred while retrieving the results. Please refresh the page and try again.