Working with Graphs
What is Graph
The main purpose of the graph is to show numerical facts in visual form so that they can be understood quickly, easily and clearly. Thus graphs are visual representations of data collected. Data can also be presented in the form of a table; however a graphical presentation is easier to understand. This is true in particular when there is a trend or comparison to be shown.
Adding graphs to PDF documents is a very common task for developers while working with Adobe Acrobat Writer or other PDF processing applications. There are many types of graphs that can be used in PDF applications. The graphics operators used in PDF content streams describe the appearance of pages that are to be reproduced on a raster output device.
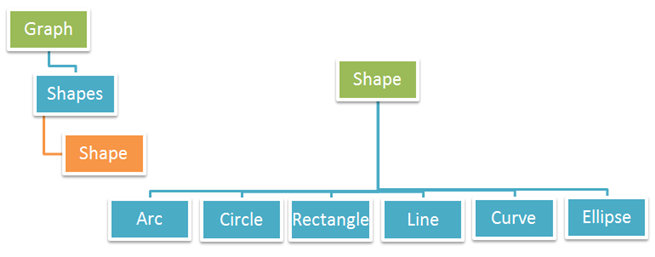
Aspose.PDF for Java also supports adding graphs to PDF documents. For this purpose, the Graph class is provided. Graph is a paragraph level element and it can be added to the Paragraphs collection in a Page instance. A Graph instance contains a collection of Shapes.
The following types of shapes are supported by the Graph class:
- Arc - sometimes also called a flag is an ordered pair of adjacent vertices, but sometimes also called a directed line.
- Circle - displays data using a circle divided into sectors. We use a circle graph (also called a pie chart) to show how data represent portions of one whole or one group.
- Curve - is a connected union of projective lines, each line meeting three others in ordinary double points.
- Line - line graphs are used to display continuous data and can be useful in predicting future events when they show trends over time.
- Rectangle - is one of the many fundamental shapes you’ll see in graphs, its can be very useful in helping you solve a problem.
- Ellipse - is a set of points on a plane, creating an oval, curved shape.
The above details are also depicted in the figures below: