العمل مع الرسوم البيانية
تمت إضافة طريقة InsertChart جديدة إلى فئة DocumentBuilder. لذلك، دعونا نرى كيفية إدراج مخطط عمودي بسيط في المستند باستخدام طريقة InsertChart.
كيفية إدراج مخطط
سنتعلم في هذا القسم كيفية إدراج مخطط في مستند.
إدراج مخطط عمودي
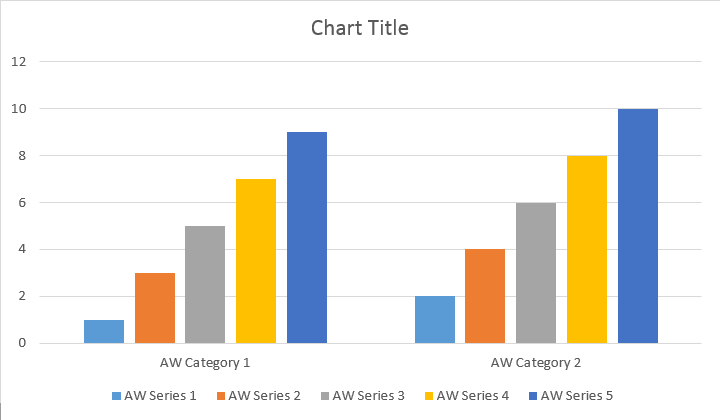
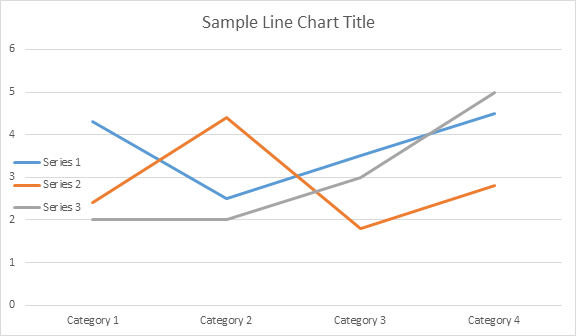
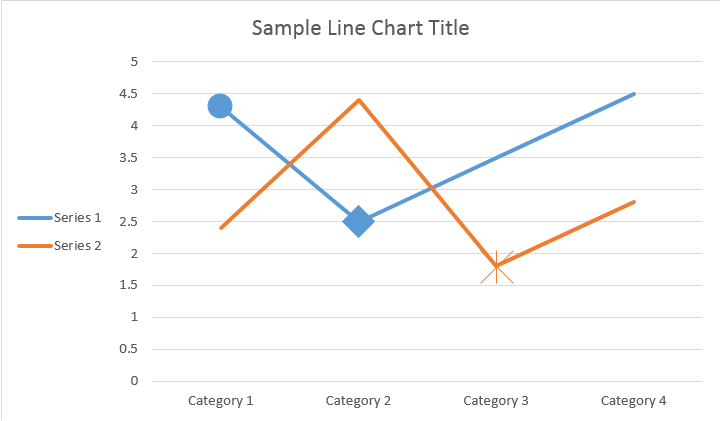
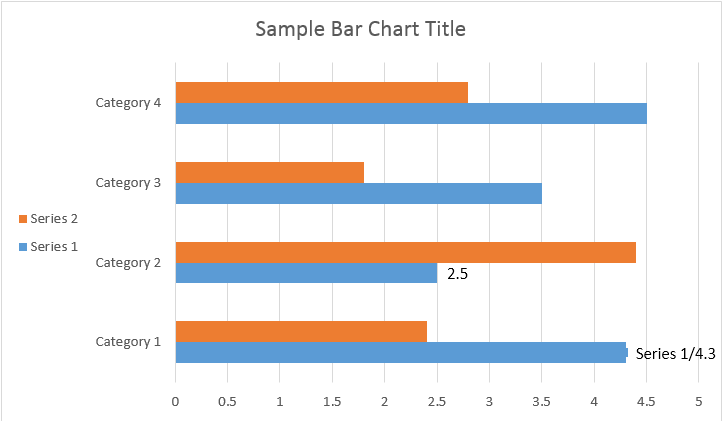
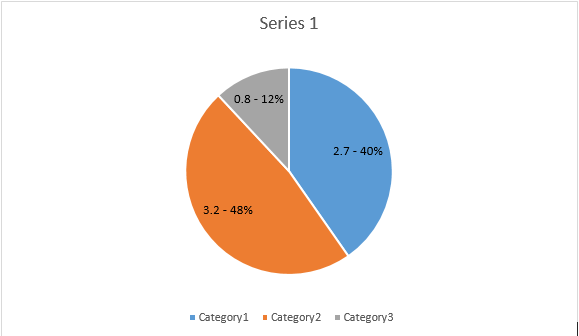
يوضح مثال التعليمات البرمجية التالي كيفية إدراج مخطط عمودي:
// For complete examples and data files, please go to https://github.com/aspose-words/Aspose.Words-for-.NET | |
Document doc = new Document(); | |
DocumentBuilder builder = new DocumentBuilder(doc); | |
// Add chart with default data. You can specify different chart types and sizes. | |
Shape shape = builder.InsertChart(ChartType.Column, 432, 252); | |
// Chart property of Shape contains all chart related options. | |
Chart chart = shape.Chart; | |
// Get chart series collection. | |
ChartSeriesCollection seriesColl = chart.Series; | |
// Check series count. | |
Console.WriteLine(seriesColl.Count); | |
// Delete default generated series. | |
seriesColl.Clear(); | |
// Create category names array, in this example we have two categories. | |
string[] categories = new string[] { "AW Category 1", "AW Category 2" }; | |
// Adding new series. Please note, data arrays must not be empty and arrays must be the same size. | |
seriesColl.Add("AW Series 1", categories, new double[] { 1, 2 }); | |
seriesColl.Add("AW Series 2", categories, new double[] { 3, 4 }); | |
seriesColl.Add("AW Series 3", categories, new double[] { 5, 6 }); | |
seriesColl.Add("AW Series 4", categories, new double[] { 7, 8 }); | |
seriesColl.Add("AW Series 5", categories, new double[] { 9, 10 }); | |
dataDir = dataDir + @"TestInsertSimpleChartColumn_out.doc"; | |
doc.Save(dataDir); |
الكود يعطي النتيجة التالية:
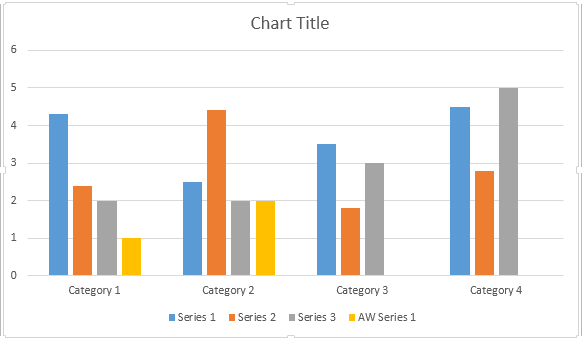
هناك أربعة حمولات زائدة مختلفة لطريقة إضافة السلسلة، والتي تم عرضها لتغطية جميع المتغيرات المحتملة لمصادر البيانات لجميع أنواع المخططات:
// For complete examples and data files, please go to https://github.com/aspose-words/Aspose.Words-for-.NET | |
Document doc = new Document(); | |
DocumentBuilder builder = new DocumentBuilder(doc); | |
// Insert Column chart. | |
Shape shape = builder.InsertChart(ChartType.Column, 432, 252); | |
Chart chart = shape.Chart; | |
// Use this overload to add series to any type of Bar, Column, Line and Surface charts. | |
chart.Series.Add("AW Series 1", new string[] { "AW Category 1", "AW Category 2" }, new double[] { 1, 2 }); | |
dataDir = dataDir + @"TestInsertChartColumn_out.doc"; | |
doc.Save(dataDir); |
الكود يعطي النتيجة التالية:
إدراج مخطط مبعثر
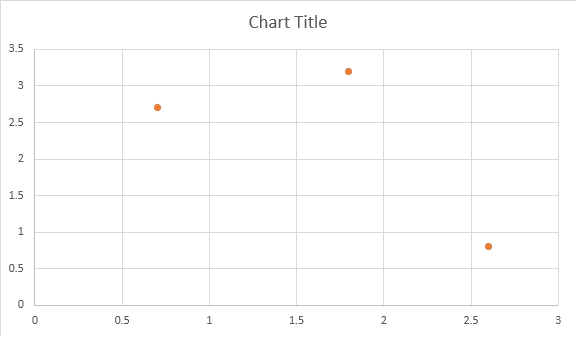
يوضح مثال التعليمات البرمجية التالي كيفية إدراج مخطط مبعثر:
// For complete examples and data files, please go to https://github.com/aspose-words/Aspose.Words-for-.NET | |
// The path to the documents directory. | |
string dataDir = RunExamples.GetDataDir_WorkingWithCharts(); | |
Document doc = new Document(); | |
DocumentBuilder builder = new DocumentBuilder(doc); | |
// Insert Scatter chart. | |
Shape shape = builder.InsertChart(ChartType.Scatter, 432, 252); | |
Chart chart = shape.Chart; | |
// Use this overload to add series to any type of Scatter charts. | |
chart.Series.Add("AW Series 1", new double[] { 0.7, 1.8, 2.6 }, new double[] { 2.7, 3.2, 0.8 }); | |
dataDir = dataDir + "TestInsertScatterChart_out.docx"; | |
doc.Save(dataDir); |
الكود يعطي النتيجة التالية:
إدراج مخطط مساحي
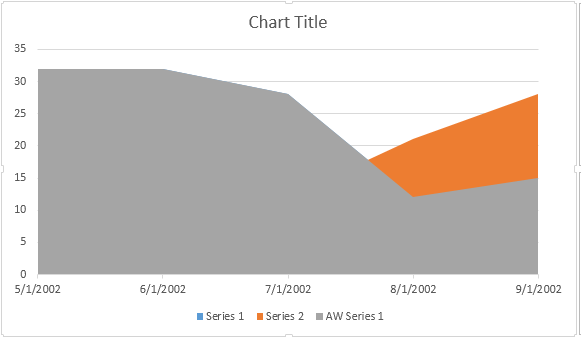
يوضح مثال التعليمات البرمجية التالي كيفية إدراج مخطط مساحي:
// For complete examples and data files, please go to https://github.com/aspose-words/Aspose.Words-for-.NET | |
// The path to the documents directory. | |
string dataDir = RunExamples.GetDataDir_WorkingWithCharts(); | |
Document doc = new Document(); | |
DocumentBuilder builder = new DocumentBuilder(doc); | |
// Insert Area chart. | |
Shape shape = builder.InsertChart(ChartType.Area, 432, 252); | |
Chart chart = shape.Chart; | |
// Use this overload to add series to any type of Area, Radar and Stock charts. | |
chart.Series.Add("AW Series 1", new DateTime[] { | |
new DateTime(2002, 05, 01), | |
new DateTime(2002, 06, 01), | |
new DateTime(2002, 07, 01), | |
new DateTime(2002, 08, 01), | |
new DateTime(2002, 09, 01)}, | |
new double[] { 32, 32, 28, 12, 15 }); | |
dataDir = dataDir + @"TestInsertAreaChart_out.docx"; | |
doc.Save(dataDir); |
الكود يعطي النتيجة التالية:
إدراج مخطط فقاعي
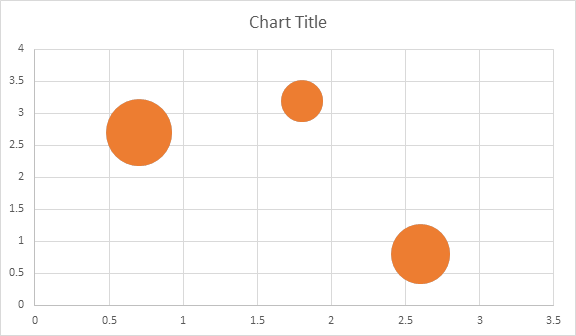
يوضح مثال التعليمات البرمجية التالي كيفية إدراج مخطط فقاعي:
// For complete examples and data files, please go to https://github.com/aspose-words/Aspose.Words-for-.NET | |
// The path to the documents directory. | |
string dataDir = RunExamples.GetDataDir_WorkingWithCharts(); | |
Document doc = new Document(); | |
DocumentBuilder builder = new DocumentBuilder(doc); | |
// Insert Bubble chart. | |
Shape shape = builder.InsertChart(ChartType.Bubble, 432, 252); | |
Chart chart = shape.Chart; | |
// Use this overload to add series to any type of Bubble charts. | |
chart.Series.Add("AW Series 1", new double[] { 0.7, 1.8, 2.6 }, new double[] { 2.7, 3.2, 0.8 }, new double[] { 10, 4, 8 }); | |
dataDir = dataDir + @"TestInsertBubbleChart_out.docx"; | |
doc.Save(dataDir); |
الكود يعطي النتيجة التالية:
العمل مع المخططات من خلال كائن Shape.Chart
بمجرد إدراج المخطط وملؤه بالبيانات، يمكنك تغيير مظهره. تحتوي خاصية Shape.Chart
على جميع الخيارات المتعلقة بالمخطط المتاحة من خلال API العام.
على سبيل المثال، لنغير عنوان المخطط أو سلوك وسيلة الإيضاح:
// For complete examples and data files, please go to https://github.com/aspose-words/Aspose.Words-for-.NET | |
// The path to the documents directory. | |
string dataDir = RunExamples.GetDataDir_WorkingWithCharts(); | |
Document doc = new Document(); | |
DocumentBuilder builder = new DocumentBuilder(doc); | |
Shape shape = builder.InsertChart(ChartType.Line, 432, 252); | |
Chart chart = shape.Chart; | |
// Determines whether the title shall be shown for this chart. Default is true. | |
chart.Title.Show = true; | |
// Setting chart Title. | |
chart.Title.Text = "Sample Line Chart Title"; | |
// Determines whether other chart elements shall be allowed to overlap title. | |
chart.Title.Overlay = false; | |
// Please note if null or empty value is specified as title text, auto generated title will be shown. | |
// Determines how legend shall be shown for this chart. | |
chart.Legend.Position = LegendPosition.Left; | |
chart.Legend.Overlay = true; | |
dataDir = dataDir + @"SimpleLineChart_out.docx"; | |
doc.Save(dataDir); |
يُنشئ الكود النتائج التالية:
كيفية العمل مع مجموعة ChartSeries من الرسم البياني
دعونا نلقي نظرة على مجموعة ChartSeries. جميع سلاسل الرسوم البيانية متاحة من خلال مجموعة chart.Series، وهي IEnumerable:
// For complete examples and data files, please go to https://github.com/aspose-words/Aspose.Words-for-.NET | |
// Get chart series collection. | |
ChartSeriesCollection seriesColl = chart.Series; | |
// Check series count. | |
Console.WriteLine(seriesColl.Count); |
يمكنك إزالة السلسلة واحدة تلو الأخرى أو مسحها جميعًا بالإضافة إلى إضافة سلسلة جديدة إذا لزم الأمر. يحتوي المخطط المدرج حديثًا على بعض السلاسل الافتراضية المضافة إلى هذه المجموعة. لإزالتها تحتاج إلى استدعاء طريقة مخطط.سلسلة.واضح().
العمل مع فئة ChartSeries واحدة
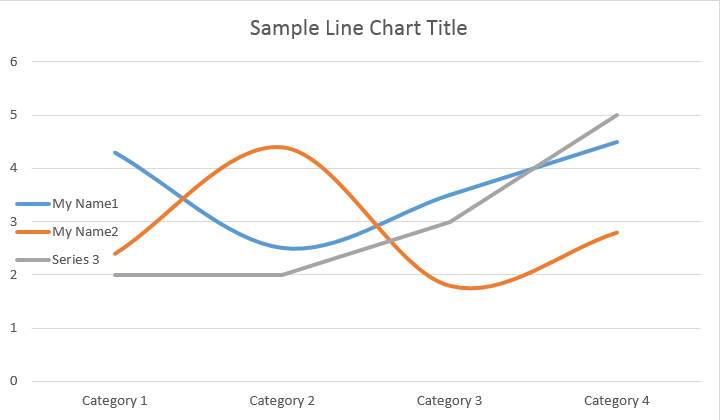
إليك كيفية العمل مع سلسلة معينة:
// For complete examples and data files, please go to https://github.com/aspose-words/Aspose.Words-for-.NET | |
// Get first series. | |
ChartSeries series0 = shape.Chart.Series[0]; | |
// Get second series. | |
ChartSeries series1 = shape.Chart.Series[1]; | |
// Change first series name. | |
series0.Name = "My Name1"; | |
// Change second series name. | |
series1.Name = "My Name2"; | |
// You can also specify whether the line connecting the points on the chart shall be smoothed using Catmull-Rom splines. | |
series0.Smooth = true; | |
series1.Smooth = true; |
يرجى الاطلاع على النتيجة أدناه:
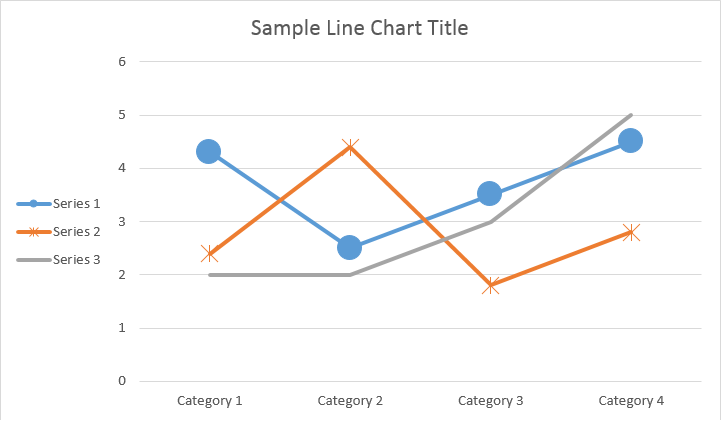
تحتوي جميع ملفات ChartSeries المنفردة على خيارات ChartDataPoint افتراضية، يرجى محاولة استخدام الكود التالي لتغييرها:
// For complete examples and data files, please go to https://github.com/aspose-words/Aspose.Words-for-.NET | |
// Specifies whether by default the parent element shall inverts its colors if the value is negative. | |
series0.InvertIfNegative = true; | |
// Set default marker symbol and size. | |
series0.Marker.Symbol = MarkerSymbol.Circle; | |
series0.Marker.Size = 15; | |
series1.Marker.Symbol = MarkerSymbol.Star; | |
series1.Marker.Size = 10; |
يرجى الاطلاع على النتيجة أدناه:
كيفية العمل مع ChartDataPoint واحد لـ ChartSeries
باستخدام ChartDataPoint، يمكنك تخصيص تنسيق نقطة بيانات واحدة في سلسلة المخططات:
// For complete examples and data files, please go to https://github.com/aspose-words/Aspose.Words-for-.NET | |
// The path to the documents directory. | |
string dataDir = RunExamples.GetDataDir_WorkingWithCharts(); | |
Document doc = new Document(); | |
DocumentBuilder builder = new DocumentBuilder(doc); | |
Shape shape = builder.InsertChart(ChartType.Line, 432, 252); | |
Chart chart = shape.Chart; | |
// Get first series. | |
ChartSeries series0 = shape.Chart.Series[0]; | |
// Get second series. | |
ChartSeries series1 = shape.Chart.Series[1]; | |
ChartDataPointCollection dataPointCollection = series0.DataPoints; | |
// Add data point to the first and second point of the first series. | |
ChartDataPoint dataPoint00 = dataPointCollection.Add(0); | |
ChartDataPoint dataPoint01 = dataPointCollection.Add(1); | |
// Set explosion. | |
dataPoint00.Explosion = 50; | |
// Set marker symbol and size. | |
dataPoint00.Marker.Symbol = MarkerSymbol.Circle; | |
dataPoint00.Marker.Size = 15; | |
dataPoint01.Marker.Symbol = MarkerSymbol.Diamond; | |
dataPoint01.Marker.Size = 20; | |
// Add data point to the third point of the second series. | |
ChartDataPoint dataPoint12 = series1.DataPoints.Add(2); | |
dataPoint12.InvertIfNegative = true; | |
dataPoint12.Marker.Symbol = MarkerSymbol.Star; | |
dataPoint12.Marker.Size = 20; | |
dataDir = dataDir + @"SingleChartDataPoint_out.docx"; | |
doc.Save(dataDir); |
يرجى الاطلاع على النتيجة أدناه:
كيفية العمل مع ChartDataLabel لسلسلة ChartSeries واحدة
باستخدام ChartDataLabel، يمكنك تحديد تنسيق تسمية بيانات واحدة لسلسلة المخططات، مثل إظهار/إخفاء LegendKey وCategoryName وSeriesName وValue وما إلى ذلك:
// For complete examples and data files, please go to https://github.com/aspose-words/Aspose.Words-for-.NET | |
Document doc = new Document(); | |
DocumentBuilder builder = new DocumentBuilder(doc); | |
Shape shape = builder.InsertChart(ChartType.Bar, 432, 252); | |
Chart chart = shape.Chart; | |
// Get first series. | |
ChartSeries series0 = shape.Chart.Series[0]; | |
ChartDataLabelCollection labels = series0.DataLabels; | |
// Set properties. | |
labels.ShowLegendKey = true; | |
// By default, when you add data labels to the data points in a pie chart, leader lines are displayed for data labels that are | |
// Positioned far outside the end of data points. Leader lines create a visual connection between a data label and its | |
// Corresponding data point. | |
labels.ShowLeaderLines = true; | |
labels.ShowCategoryName = false; | |
labels.ShowPercentage = false; | |
labels.ShowSeriesName = true; | |
labels.ShowValue = true; | |
labels.Separator = "/"; | |
labels.ShowValue = true; | |
dataDir = dataDir + "SimpleBarChart_out.docx"; | |
doc.Save(dataDir); |
يرجى الاطلاع على النتيجة أدناه:
كيفية تحديد الخيارات الافتراضية لـ ChartDataLabels في ChartSeries
تحدد فئة ChartDataLabelCollection الخصائص التي يمكن استخدامها لتعيين الخيارات الافتراضية لـ ChartDataLabels لـ Chart Series. تتضمن هذه الخصائص ShowCategoryName وShowBubbleSize وShowPercentage وShowSeriesName وShowValue وما إلى ذلك:
// For complete examples and data files, please go to https://github.com/aspose-words/Aspose.Words-for-.NET | |
Document doc = new Document(); | |
DocumentBuilder builder = new DocumentBuilder(doc); | |
Shape shape = builder.InsertChart(ChartType.Pie, 432, 252); | |
Chart chart = shape.Chart; | |
chart.Series.Clear(); | |
ChartSeries series = chart.Series.Add("Series 1", | |
new string[] { "Category1", "Category2", "Category3" }, | |
new double[] { 2.7, 3.2, 0.8 }); | |
ChartDataLabelCollection labels = series.DataLabels; | |
labels.ShowPercentage = true; | |
labels.ShowValue = true; | |
labels.ShowLeaderLines = false; | |
labels.Separator = " - "; | |
doc.Save(dataDir + "Demo.docx"); |
يرجى الاطلاع على النتيجة أدناه:
كيفية تنسيق عدد تسمية بيانات المخطط
باستخدام NumberFormat، يمكنك تحديد تنسيق الأرقام لتسمية بيانات واحدة للمخطط.
يوضح مثال التعليمات البرمجية التالي كيفية تنسيق عدد من تسمية البيانات:
// For complete examples and data files, please go to https://github.com/aspose-words/Aspose.Words-for-.NET | |
Document doc = new Document(); | |
DocumentBuilder builder = new DocumentBuilder(doc); | |
// Add chart with default data. | |
Shape shape = builder.InsertChart(ChartType.Line, 432, 252); | |
Chart chart = shape.Chart; | |
chart.Title.Text = "Data Labels With Different Number Format"; | |
// Delete default generated series. | |
chart.Series.Clear(); | |
// Add new series | |
ChartSeries series1 = chart.Series.Add("AW Series 1", | |
new string[] { "AW0", "AW1", "AW2" }, | |
new double[] { 2.5, 1.5, 3.5 }); | |
series1.HasDataLabels = true; | |
series1.DataLabels.ShowValue = true; | |
series1.DataLabels[0].NumberFormat.FormatCode = "\"$\"#,##0.00"; | |
series1.DataLabels[1].NumberFormat.FormatCode = "dd/mm/yyyy"; | |
series1.DataLabels[2].NumberFormat.FormatCode = "0.00%"; | |
// Or you can set format code to be linked to a source cell, | |
// in this case NumberFormat will be reset to general and inherited from a source cell. | |
series1.DataLabels[2].NumberFormat.IsLinkedToSource = true; | |
dataDir = dataDir + @"NumberFormat_DataLabel_out.docx"; | |
doc.Save(dataDir); |
كيفية تعيين خصائص محور المخطط
إذا كنت تريد العمل مع محور المخطط ووحدات القياس والعرض لمحور القيمة، فيرجى استخدام فئات ChartAxis وAxisDisplayUnit وAxisScaling.
يوضح مثال التعليمات البرمجية التالي كيفية تعريف خصائص المحور X وY:
// For complete examples and data files, please go to https://github.com/aspose-words/Aspose.Words-for-.NET | |
Document doc = new Document(); | |
DocumentBuilder builder = new DocumentBuilder(doc); | |
// Insert chart. | |
Shape shape = builder.InsertChart(ChartType.Area, 432, 252); | |
Chart chart = shape.Chart; | |
// Clear demo data. | |
chart.Series.Clear(); | |
// Fill data. | |
chart.Series.Add("AW Series 1", | |
new DateTime[] { new DateTime(2002, 01, 01), new DateTime(2002, 06, 01), new DateTime(2002, 07, 01), new DateTime(2002, 08, 01), new DateTime(2002, 09, 01) }, | |
new double[] { 640, 320, 280, 120, 150 }); | |
ChartAxis xAxis = chart.AxisX; | |
ChartAxis yAxis = chart.AxisY; | |
// Change the X axis to be category instead of date, so all the points will be put with equal interval on the X axis. | |
xAxis.CategoryType = AxisCategoryType.Category; | |
// Define X axis properties. | |
xAxis.Crosses = AxisCrosses.Custom; | |
xAxis.CrossesAt = 3; // measured in display units of the Y axis (hundreds) | |
xAxis.ReverseOrder = true; | |
xAxis.MajorTickMark = AxisTickMark.Cross; | |
xAxis.MinorTickMark = AxisTickMark.Outside; | |
xAxis.TickLabelOffset = 200; | |
// Define Y axis properties. | |
yAxis.TickLabelPosition = AxisTickLabelPosition.High; | |
yAxis.MajorUnit = 100; | |
yAxis.MinorUnit = 50; | |
yAxis.DisplayUnit.Unit = AxisBuiltInUnit.Hundreds; | |
yAxis.Scaling.Minimum = new AxisBound(100); | |
yAxis.Scaling.Maximum = new AxisBound(700); | |
dataDir = dataDir + @"SetAxisProperties_out.docx"; | |
doc.Save(dataDir); |
كيفية تعيين القيمة الزمنية للمحور Date
يوضح مثال التعليمات البرمجية التالي كيفية تعيين قيم التاريخ/الوقت لخصائص المحور:
// For complete examples and data files, please go to https://github.com/aspose-words/Aspose.Words-for-.NET | |
Document doc = new Document(); | |
DocumentBuilder builder = new DocumentBuilder(doc); | |
// Insert chart. | |
Shape shape = builder.InsertChart(ChartType.Column, 432, 252); | |
Chart chart = shape.Chart; | |
// Clear demo data. | |
chart.Series.Clear(); | |
// Fill data. | |
chart.Series.Add("AW Series 1", | |
new DateTime[] { new DateTime(2017, 11, 06), new DateTime(2017, 11, 09), new DateTime(2017, 11, 15), | |
new DateTime(2017, 11, 21), new DateTime(2017, 11, 25), new DateTime(2017, 11, 29) }, | |
new double[] { 1.2, 0.3, 2.1, 2.9, 4.2, 5.3 }); | |
// Set X axis bounds. | |
ChartAxis xAxis = chart.AxisX; | |
xAxis.Scaling.Minimum = new AxisBound((new DateTime(2017, 11, 05)).ToOADate()); | |
xAxis.Scaling.Maximum = new AxisBound((new DateTime(2017, 12, 03)).ToOADate()); | |
// Set major units to a week and minor units to a day. | |
xAxis.MajorUnit = 7; | |
xAxis.MinorUnit = 1; | |
xAxis.MajorTickMark = AxisTickMark.Cross; | |
xAxis.MinorTickMark = AxisTickMark.Outside; | |
dataDir = dataDir + @"SetDateTimeValuesToAxis_out.docx"; | |
doc.Save(dataDir); |
كيفية تنسيق قيمة الرقم للمحور
يوضح مثال التعليمات البرمجية التالي كيفية تغيير تنسيق الأرقام على محور القيمة:
// For complete examples and data files, please go to https://github.com/aspose-words/Aspose.Words-for-.NET | |
Document doc = new Document(); | |
DocumentBuilder builder = new DocumentBuilder(doc); | |
// Insert chart. | |
Shape shape = builder.InsertChart(ChartType.Column, 432, 252); | |
Chart chart = shape.Chart; | |
// Clear demo data. | |
chart.Series.Clear(); | |
// Fill data. | |
chart.Series.Add("AW Series 1", | |
new string[] { "Item 1", "Item 2", "Item 3", "Item 4", "Item 5" }, | |
new double[] { 1900000, 850000, 2100000, 600000, 1500000 }); | |
// Set number format. | |
chart.AxisY.NumberFormat.FormatCode = "#,##0"; | |
dataDir = dataDir + @"FormatAxisNumber_out.docx"; | |
doc.Save(dataDir); |
كيفية تعيين حدود المحور
تمثل فئة AxisBound
الحد الأدنى أو الأقصى لقيم المحور. يمكن تحديد المنضم كقيمة رقمية أو تاريخ/وقت أو قيمة “تلقائية” خاصة.
يوضح مثال التعليمات البرمجية التالي كيفية تعيين حدود المحور:
// For complete examples and data files, please go to https://github.com/aspose-words/Aspose.Words-for-.NET | |
Document doc = new Document(); | |
DocumentBuilder builder = new DocumentBuilder(doc); | |
// Insert chart. | |
Shape shape = builder.InsertChart(ChartType.Column, 432, 252); | |
Chart chart = shape.Chart; | |
// Clear demo data. | |
chart.Series.Clear(); | |
// Fill data. | |
chart.Series.Add("AW Series 1", | |
new string[] { "Item 1", "Item 2", "Item 3", "Item 4", "Item 5" }, | |
new double[] { 1.2, 0.3, 2.1, 2.9, 4.2 }); | |
chart.AxisY.Scaling.Minimum = new AxisBound(0); | |
chart.AxisY.Scaling.Maximum = new AxisBound(6); | |
dataDir = dataDir + @"SetboundsOfAxis_out.docx"; | |
doc.Save(dataDir); |
كيفية ضبط وحدة الفاصل الزمني بين التسميات
يوضح مثال التعليمات البرمجية التالي كيفية تعيين وحدة الفاصل الزمني بين التسميات على المحور:
// For complete examples and data files, please go to https://github.com/aspose-words/Aspose.Words-for-.NET | |
Document doc = new Document(); | |
DocumentBuilder builder = new DocumentBuilder(doc); | |
// Insert chart. | |
Shape shape = builder.InsertChart(ChartType.Column, 432, 252); | |
Chart chart = shape.Chart; | |
// Clear demo data. | |
chart.Series.Clear(); | |
// Fill data. | |
chart.Series.Add("AW Series 1", | |
new string[] { "Item 1", "Item 2", "Item 3", "Item 4", "Item 5" }, | |
new double[] { 1.2, 0.3, 2.1, 2.9, 4.2 }); | |
chart.AxisX.TickLabelSpacing = 2; | |
dataDir = dataDir + @"SetIntervalUnitBetweenLabelsOnAxis_out.docx"; | |
doc.Save(dataDir); |
كيفية إخفاء محور الرسم البياني
إذا كنت تريد إظهار أو إخفاء محور المخطط، فيمكنك ببساطة تحقيق ذلك عن طريق تعيين قيمة خاصية ChartAxis.Hidden
.
يوضح مثال التعليمات البرمجية التالي كيفية إخفاء المحور Y للمخطط:
// For complete examples and data files, please go to https://github.com/aspose-words/Aspose.Words-for-.NET | |
Document doc = new Document(); | |
DocumentBuilder builder = new DocumentBuilder(doc); | |
// Insert chart. | |
Shape shape = builder.InsertChart(ChartType.Column, 432, 252); | |
Chart chart = shape.Chart; | |
// Clear demo data. | |
chart.Series.Clear(); | |
// Fill data. | |
chart.Series.Add("AW Series 1", | |
new string[] { "Item 1", "Item 2", "Item 3", "Item 4", "Item 5" }, | |
new double[] { 1.2, 0.3, 2.1, 2.9, 4.2 }); | |
// Hide the Y axis. | |
chart.AxisY.Hidden = true; | |
dataDir = dataDir + @"HideChartAxis_out.docx"; | |
doc.Save(dataDir); |
كيفية محاذاة تسمية المخطط
إذا كنت تريد تعيين محاذاة النص للتسميات متعددة الأسطر، فيمكنك ببساطة تحقيق ذلك عن طريق تعيين قيمة خاصية TickLabels.تنسيق.
يوضح مثال التعليمات البرمجية التالي كيفية تحديد محاذاة التسمية:
// For complete examples and data files, please go to https://github.com/aspose-words/Aspose.Words-for-.NET | |
Document doc = new Document(dataDir + "Document.docx"); | |
Shape shape = (Shape)doc.GetChild(NodeType.Shape, 0, true); | |
ChartAxis axis = shape.Chart.AxisX; | |
//This property has effect only for multi-line labels. | |
axis.TickLabelAlignment = ParagraphAlignment.Right; | |
doc.Save(dataDir + "Document_out.docx"); |
كيفية ضبط تنسيق التعبئة والحد
يمكن تعيين تنسيق التعبئة والحد لسلسلة المخططات ونقاط البيانات والعلامات. للقيام بذلك، تحتاج إلى استخدام خصائص نوع ChartFormat في فئات ChartSeries وChartDataPoint وChartMarker، بالإضافة إلى الأسماء المستعارة لبعض الخصائص، مثل ForeColor وBackColor وVisible وTransparency في فئة Stroke
.
يوضح مثال التعليمات البرمجية التالي كيفية تعيين لون السلسلة:
Document doc = new Document();
DocumentBuilder builder = new DocumentBuilder(doc);
Shape shape = builder.InsertChart(ChartType.Column, 432, 252);
Chart chart = shape.Chart;
ChartSeriesCollection seriesColl = chart.Series;
// Delete default generated series.
seriesColl.Clear();
// Create category names array.
string[] categories = new string[] { "AW Category 1", "AW Category 2" };
// Adding new series. Value and category arrays must be the same size.
ChartSeries series1 = seriesColl.Add("AW Series 1", categories, new double[] { 1, 2 });
ChartSeries series2 = seriesColl.Add("AW Series 2", categories, new double[] { 3, 4 });
ChartSeries series3 = seriesColl.Add("AW Series 3", categories, new double[] { 5, 6 });
// Set series color.
series1.Format.Fill.ForeColor = Color.Red;
series2.Format.Fill.ForeColor = Color.Yellow;
series3.Format.Fill.ForeColor = Color.Blue;
doc.Save(dir + "ColumnColor.docx");
يوضح مثال التعليمات البرمجية التالي كيفية تعيين لون الخط ووزنه:
Document doc = new Document();
DocumentBuilder builder = new DocumentBuilder(doc);
Shape shape = builder.InsertChart(ChartType.Line, 432, 252);
Chart chart = shape.Chart;
ChartSeriesCollection seriesColl = chart.Series;
// Delete default generated series.
seriesColl.Clear();
// Adding new series.
ChartSeries series1 = seriesColl.Add("AW Series 1", new double[] { 0.7, 1.8, 2.6 },
new double[] { 2.7, 3.2, 0.8 });
ChartSeries series2 = seriesColl.Add("AW Series 2", new double[] { 0.5, 1.5, 2.5 },
new double[] { 3, 1, 2 });
// Set series color.
series1.Format.Stroke.ForeColor = Color.Red;
series1.Format.Stroke.Weight = 5;
series2.Format.Stroke.ForeColor = Color.LightGreen;
series2.Format.Stroke.Weight = 5;
doc.Save(dir + "LineColorAndWeight.docx");