Работа с графики
Нов InsertChart метод е добавен в DocumentBuilder Клас. И така, нека видим как да вкараме проста колона в документа с помощта на InsertChart метод.
Как да въведете диаграма
В този раздел ще се научим как да вкараме диаграма в документ.
Вмъкване на колона
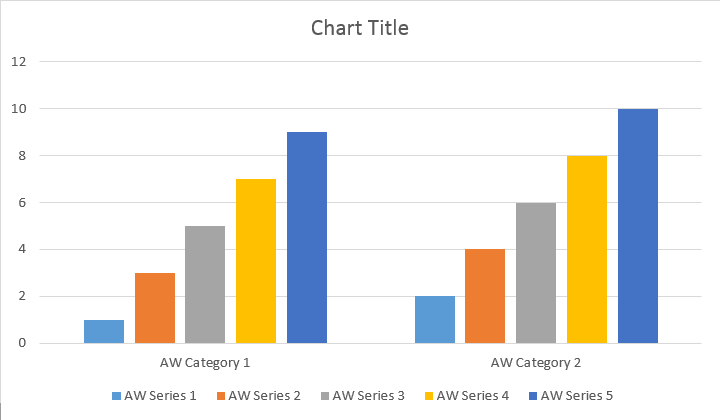
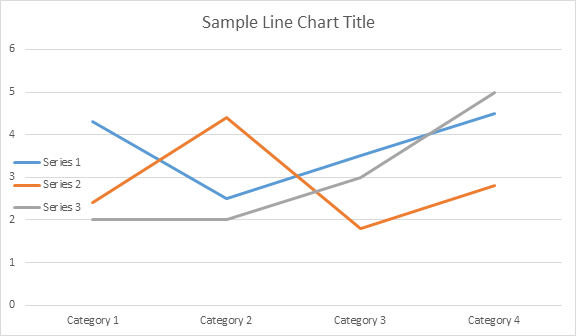
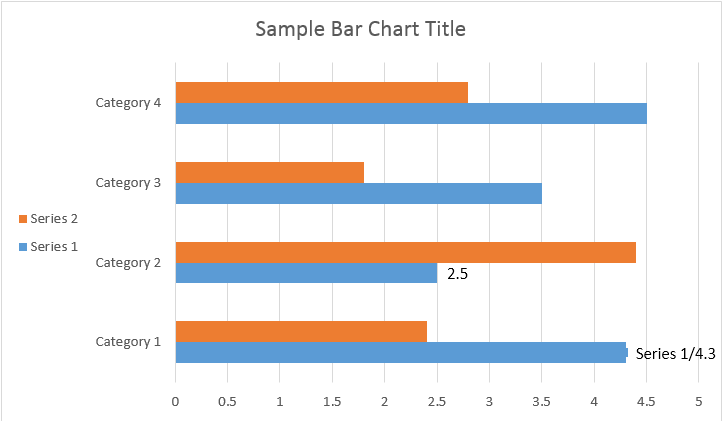
Следният пример за код показва как да се вмъкне колона диаграма:
// For complete examples and data files, please go to https://github.com/aspose-words/Aspose.Words-for-.NET | |
Document doc = new Document(); | |
DocumentBuilder builder = new DocumentBuilder(doc); | |
// Add chart with default data. You can specify different chart types and sizes. | |
Shape shape = builder.InsertChart(ChartType.Column, 432, 252); | |
// Chart property of Shape contains all chart related options. | |
Chart chart = shape.Chart; | |
// Get chart series collection. | |
ChartSeriesCollection seriesColl = chart.Series; | |
// Check series count. | |
Console.WriteLine(seriesColl.Count); | |
// Delete default generated series. | |
seriesColl.Clear(); | |
// Create category names array, in this example we have two categories. | |
string[] categories = new string[] { "AW Category 1", "AW Category 2" }; | |
// Adding new series. Please note, data arrays must not be empty and arrays must be the same size. | |
seriesColl.Add("AW Series 1", categories, new double[] { 1, 2 }); | |
seriesColl.Add("AW Series 2", categories, new double[] { 3, 4 }); | |
seriesColl.Add("AW Series 3", categories, new double[] { 5, 6 }); | |
seriesColl.Add("AW Series 4", categories, new double[] { 7, 8 }); | |
seriesColl.Add("AW Series 5", categories, new double[] { 9, 10 }); | |
dataDir = dataDir + @"TestInsertSimpleChartColumn_out.doc"; | |
doc.Save(dataDir); |
Кодът дава следния резултат:
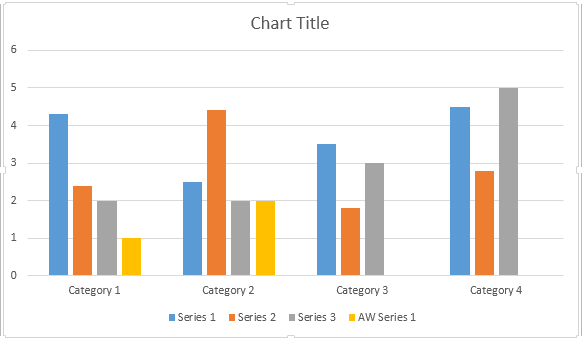
Има четири различни претоварване за серия Добавете метод, който е бил изложен на покритие на всички възможни варианти на източници на данни за всички видове карти:
// For complete examples and data files, please go to https://github.com/aspose-words/Aspose.Words-for-.NET | |
Document doc = new Document(); | |
DocumentBuilder builder = new DocumentBuilder(doc); | |
// Insert Column chart. | |
Shape shape = builder.InsertChart(ChartType.Column, 432, 252); | |
Chart chart = shape.Chart; | |
// Use this overload to add series to any type of Bar, Column, Line and Surface charts. | |
chart.Series.Add("AW Series 1", new string[] { "AW Category 1", "AW Category 2" }, new double[] { 1, 2 }); | |
dataDir = dataDir + @"TestInsertChartColumn_out.doc"; | |
doc.Save(dataDir); |
Кодът дава следния резултат:
Вмъкване на скатер Графика
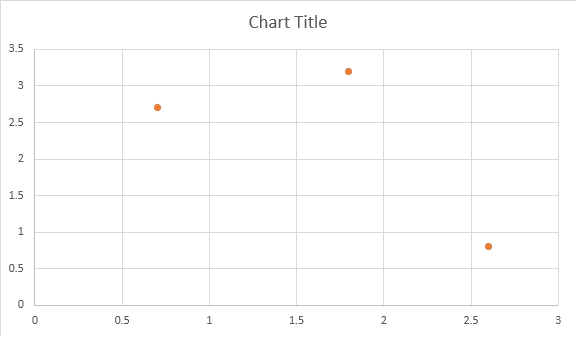
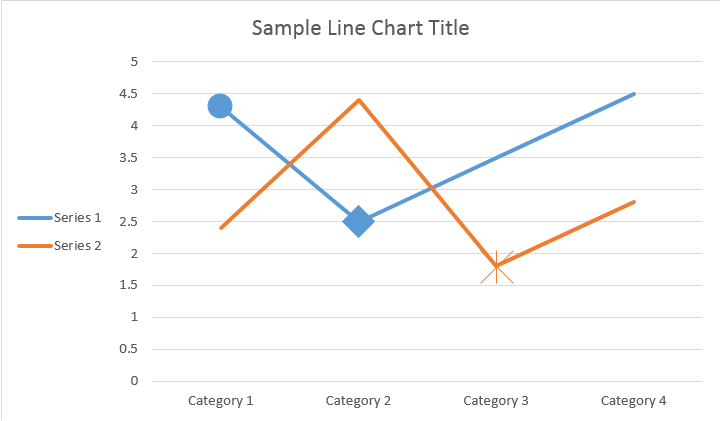
Следният пример с код показва как да се постави схема за разсейване:
// For complete examples and data files, please go to https://github.com/aspose-words/Aspose.Words-for-.NET | |
// The path to the documents directory. | |
string dataDir = RunExamples.GetDataDir_WorkingWithCharts(); | |
Document doc = new Document(); | |
DocumentBuilder builder = new DocumentBuilder(doc); | |
// Insert Scatter chart. | |
Shape shape = builder.InsertChart(ChartType.Scatter, 432, 252); | |
Chart chart = shape.Chart; | |
// Use this overload to add series to any type of Scatter charts. | |
chart.Series.Add("AW Series 1", new double[] { 0.7, 1.8, 2.6 }, new double[] { 2.7, 3.2, 0.8 }); | |
dataDir = dataDir + "TestInsertScatterChart_out.docx"; | |
doc.Save(dataDir); |
Кодът дава следния резултат:
Вмъкване на зона Графика
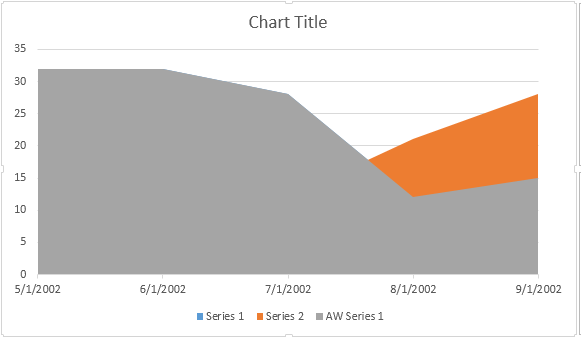
Следният пример с код показва как да се постави диаграма на областта:
// For complete examples and data files, please go to https://github.com/aspose-words/Aspose.Words-for-.NET | |
// The path to the documents directory. | |
string dataDir = RunExamples.GetDataDir_WorkingWithCharts(); | |
Document doc = new Document(); | |
DocumentBuilder builder = new DocumentBuilder(doc); | |
// Insert Area chart. | |
Shape shape = builder.InsertChart(ChartType.Area, 432, 252); | |
Chart chart = shape.Chart; | |
// Use this overload to add series to any type of Area, Radar and Stock charts. | |
chart.Series.Add("AW Series 1", new DateTime[] { | |
new DateTime(2002, 05, 01), | |
new DateTime(2002, 06, 01), | |
new DateTime(2002, 07, 01), | |
new DateTime(2002, 08, 01), | |
new DateTime(2002, 09, 01)}, | |
new double[] { 32, 32, 28, 12, 15 }); | |
dataDir = dataDir + @"TestInsertAreaChart_out.docx"; | |
doc.Save(dataDir); |
Кодът дава следния резултат:
Вмъкване на таблицата с мехурчета
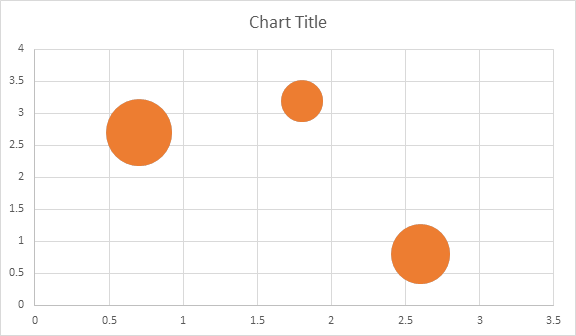
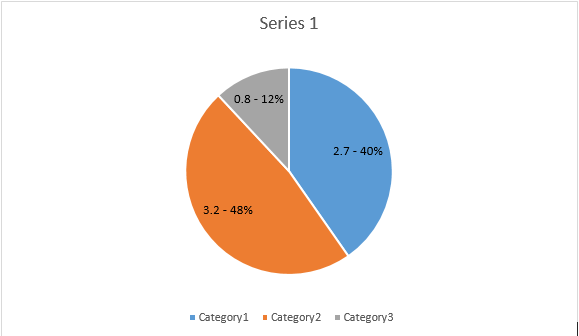
Следният пример за код показва как да се вмъкне диаграма балон:
// For complete examples and data files, please go to https://github.com/aspose-words/Aspose.Words-for-.NET | |
// The path to the documents directory. | |
string dataDir = RunExamples.GetDataDir_WorkingWithCharts(); | |
Document doc = new Document(); | |
DocumentBuilder builder = new DocumentBuilder(doc); | |
// Insert Bubble chart. | |
Shape shape = builder.InsertChart(ChartType.Bubble, 432, 252); | |
Chart chart = shape.Chart; | |
// Use this overload to add series to any type of Bubble charts. | |
chart.Series.Add("AW Series 1", new double[] { 0.7, 1.8, 2.6 }, new double[] { 2.7, 3.2, 0.8 }, new double[] { 10, 4, 8 }); | |
dataDir = dataDir + @"TestInsertBubbleChart_out.docx"; | |
doc.Save(dataDir); |
Кодът дава следния резултат:
Работа с карти чрез Shape.Chart
Обект
След като диаграмата е поставена и изпълнена с данни, вие сте в състояние да промени външния си вид. Shape.Chart
имотът съдържа всички опции, свързани с графиката, достъпни чрез обществеността API.
Например, нека се променим. Заглавие или поведение на легенда:
// For complete examples and data files, please go to https://github.com/aspose-words/Aspose.Words-for-.NET | |
// The path to the documents directory. | |
string dataDir = RunExamples.GetDataDir_WorkingWithCharts(); | |
Document doc = new Document(); | |
DocumentBuilder builder = new DocumentBuilder(doc); | |
Shape shape = builder.InsertChart(ChartType.Line, 432, 252); | |
Chart chart = shape.Chart; | |
// Determines whether the title shall be shown for this chart. Default is true. | |
chart.Title.Show = true; | |
// Setting chart Title. | |
chart.Title.Text = "Sample Line Chart Title"; | |
// Determines whether other chart elements shall be allowed to overlap title. | |
chart.Title.Overlay = false; | |
// Please note if null or empty value is specified as title text, auto generated title will be shown. | |
// Determines how legend shall be shown for this chart. | |
chart.Legend.Position = LegendPosition.Left; | |
chart.Legend.Overlay = true; | |
dataDir = dataDir + @"SimpleLineChart_out.docx"; | |
doc.Save(dataDir); |
Кодът генерира следните резултати:
Как да работите с ChartSeriesCollection of Chart
Нека да погледнем в ChartSeries Колекция. Всички серии карти са достъпни чрез chart.Series събиране, което е IEnumerable:
// For complete examples and data files, please go to https://github.com/aspose-words/Aspose.Words-for-.NET | |
// Get chart series collection. | |
ChartSeriesCollection seriesColl = chart.Series; | |
// Check series count. | |
Console.WriteLine(seriesColl.Count); |
Можете да премахнете серия една по една или да изчистите всички от тях, както и да добавите нова, ако е необходимо. Нововградената диаграма има някои добавени серии по подразбиране към тази колекция. За да ги премахнете, трябва да се обадите на диаграма.серии.чисти() метод.
Работа с единни карти клас
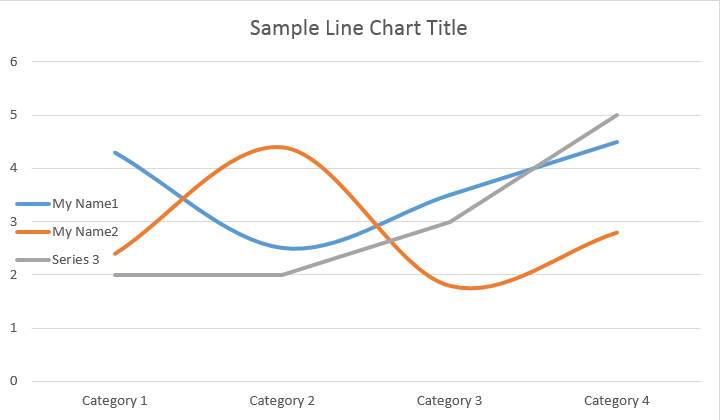
Ето как се работи с определена серия:
// For complete examples and data files, please go to https://github.com/aspose-words/Aspose.Words-for-.NET | |
// Get first series. | |
ChartSeries series0 = shape.Chart.Series[0]; | |
// Get second series. | |
ChartSeries series1 = shape.Chart.Series[1]; | |
// Change first series name. | |
series0.Name = "My Name1"; | |
// Change second series name. | |
series1.Name = "My Name2"; | |
// You can also specify whether the line connecting the points on the chart shall be smoothed using Catmull-Rom splines. | |
series0.Smooth = true; | |
series1.Smooth = true; |
Моля, вижте резултата по-долу:
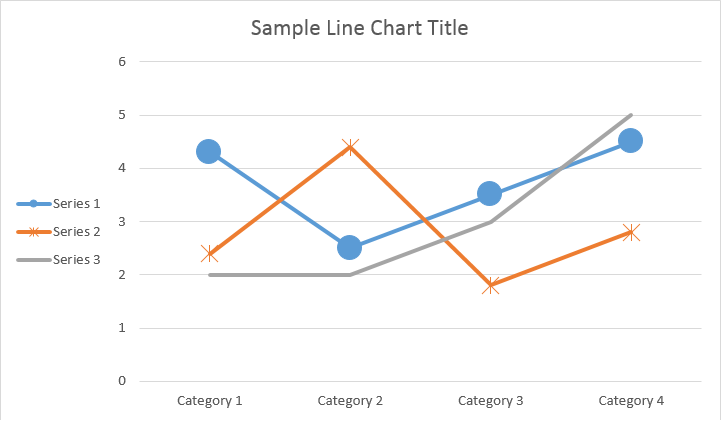
Всички необвързани ChartSeries е по подразбиране ChartDataPoint опции, моля опитайте се да използвате следния код, за да ги промените:
// For complete examples and data files, please go to https://github.com/aspose-words/Aspose.Words-for-.NET | |
// Specifies whether by default the parent element shall inverts its colors if the value is negative. | |
series0.InvertIfNegative = true; | |
// Set default marker symbol and size. | |
series0.Marker.Symbol = MarkerSymbol.Circle; | |
series0.Marker.Size = 15; | |
series1.Marker.Symbol = MarkerSymbol.Star; | |
series1.Marker.Size = 10; |
Моля, вижте резултата по-долу:
Как да работите с единична графикаDataPoint на a ChartSeries
Използване ChartDataPoint Вие сте в състояние да персонализирате форматирането на една точка от данните на серията диаграма:
// For complete examples and data files, please go to https://github.com/aspose-words/Aspose.Words-for-.NET | |
// The path to the documents directory. | |
string dataDir = RunExamples.GetDataDir_WorkingWithCharts(); | |
Document doc = new Document(); | |
DocumentBuilder builder = new DocumentBuilder(doc); | |
Shape shape = builder.InsertChart(ChartType.Line, 432, 252); | |
Chart chart = shape.Chart; | |
// Get first series. | |
ChartSeries series0 = shape.Chart.Series[0]; | |
// Get second series. | |
ChartSeries series1 = shape.Chart.Series[1]; | |
ChartDataPointCollection dataPointCollection = series0.DataPoints; | |
// Add data point to the first and second point of the first series. | |
ChartDataPoint dataPoint00 = dataPointCollection.Add(0); | |
ChartDataPoint dataPoint01 = dataPointCollection.Add(1); | |
// Set explosion. | |
dataPoint00.Explosion = 50; | |
// Set marker symbol and size. | |
dataPoint00.Marker.Symbol = MarkerSymbol.Circle; | |
dataPoint00.Marker.Size = 15; | |
dataPoint01.Marker.Symbol = MarkerSymbol.Diamond; | |
dataPoint01.Marker.Size = 20; | |
// Add data point to the third point of the second series. | |
ChartDataPoint dataPoint12 = series1.DataPoints.Add(2); | |
dataPoint12.InvertIfNegative = true; | |
dataPoint12.Marker.Symbol = MarkerSymbol.Star; | |
dataPoint12.Marker.Size = 20; | |
dataDir = dataDir + @"SingleChartDataPoint_out.docx"; | |
doc.Save(dataDir); |
Моля, вижте резултата по-долу:
Как да работите с ChartDataLabel на единични карти
Използване ChartDataLabel Вие сте в състояние да посочи форматирането на един етикет на данните от серията диаграма, като шоу / скрий ЛегендКей, Категория Име, Серия име, Стойност и т.н.:
// For complete examples and data files, please go to https://github.com/aspose-words/Aspose.Words-for-.NET | |
Document doc = new Document(); | |
DocumentBuilder builder = new DocumentBuilder(doc); | |
Shape shape = builder.InsertChart(ChartType.Bar, 432, 252); | |
Chart chart = shape.Chart; | |
// Get first series. | |
ChartSeries series0 = shape.Chart.Series[0]; | |
ChartDataLabelCollection labels = series0.DataLabels; | |
// Set properties. | |
labels.ShowLegendKey = true; | |
// By default, when you add data labels to the data points in a pie chart, leader lines are displayed for data labels that are | |
// Positioned far outside the end of data points. Leader lines create a visual connection between a data label and its | |
// Corresponding data point. | |
labels.ShowLeaderLines = true; | |
labels.ShowCategoryName = false; | |
labels.ShowPercentage = false; | |
labels.ShowSeriesName = true; | |
labels.ShowValue = true; | |
labels.Separator = "/"; | |
labels.ShowValue = true; | |
dataDir = dataDir + "SimpleBarChart_out.docx"; | |
doc.Save(dataDir); |
Моля, вижте резултата по-долу:
Как да определите настройките по подразбиране за ChartDataLabels на ChartSeries
На ChartDataLabelCollection клас определя свойства, които могат да бъдат използвани за задаване на опции по подразбиране за ChartDataLabels за диаграма Series. Тези свойства включват ShowCategoryName, ShowBubbleSize, ShowPrentage, ShowSeriesName, Show Стойност и т.н.:
// For complete examples and data files, please go to https://github.com/aspose-words/Aspose.Words-for-.NET | |
Document doc = new Document(); | |
DocumentBuilder builder = new DocumentBuilder(doc); | |
Shape shape = builder.InsertChart(ChartType.Pie, 432, 252); | |
Chart chart = shape.Chart; | |
chart.Series.Clear(); | |
ChartSeries series = chart.Series.Add("Series 1", | |
new string[] { "Category1", "Category2", "Category3" }, | |
new double[] { 2.7, 3.2, 0.8 }); | |
ChartDataLabelCollection labels = series.DataLabels; | |
labels.ShowPercentage = true; | |
labels.ShowValue = true; | |
labels.ShowLeaderLines = false; | |
labels.Separator = " - "; | |
doc.Save(dataDir + "Demo.docx"); |
Моля, вижте резултата по-долу:
Как да форматираме номер на табелката с данните
Използване NumberFormat Вие сте в състояние да посочи номер форматиране на един етикет данни на диаграмата.
Следният пример за код показва как да се форматира редица от етикета на данните:
// For complete examples and data files, please go to https://github.com/aspose-words/Aspose.Words-for-.NET | |
Document doc = new Document(); | |
DocumentBuilder builder = new DocumentBuilder(doc); | |
// Add chart with default data. | |
Shape shape = builder.InsertChart(ChartType.Line, 432, 252); | |
Chart chart = shape.Chart; | |
chart.Title.Text = "Data Labels With Different Number Format"; | |
// Delete default generated series. | |
chart.Series.Clear(); | |
// Add new series | |
ChartSeries series1 = chart.Series.Add("AW Series 1", | |
new string[] { "AW0", "AW1", "AW2" }, | |
new double[] { 2.5, 1.5, 3.5 }); | |
series1.HasDataLabels = true; | |
series1.DataLabels.ShowValue = true; | |
series1.DataLabels[0].NumberFormat.FormatCode = "\"$\"#,##0.00"; | |
series1.DataLabels[1].NumberFormat.FormatCode = "dd/mm/yyyy"; | |
series1.DataLabels[2].NumberFormat.FormatCode = "0.00%"; | |
// Or you can set format code to be linked to a source cell, | |
// in this case NumberFormat will be reset to general and inherited from a source cell. | |
series1.DataLabels[2].NumberFormat.IsLinkedToSource = true; | |
dataDir = dataDir + @"NumberFormat_DataLabel_out.docx"; | |
doc.Save(dataDir); |
Как да зададете свойства на оста на диаграмата
Ако искате да работите с графика ос, мащабиране, и дисплей единици за стойността ос, моля, използвайте ChartAxis, AxisDisplayUnit, както и AxisScaling Класове.
Следният пример за код показва как да се определят свойствата на оста X и Y:
// For complete examples and data files, please go to https://github.com/aspose-words/Aspose.Words-for-.NET | |
Document doc = new Document(); | |
DocumentBuilder builder = new DocumentBuilder(doc); | |
// Insert chart. | |
Shape shape = builder.InsertChart(ChartType.Area, 432, 252); | |
Chart chart = shape.Chart; | |
// Clear demo data. | |
chart.Series.Clear(); | |
// Fill data. | |
chart.Series.Add("AW Series 1", | |
new DateTime[] { new DateTime(2002, 01, 01), new DateTime(2002, 06, 01), new DateTime(2002, 07, 01), new DateTime(2002, 08, 01), new DateTime(2002, 09, 01) }, | |
new double[] { 640, 320, 280, 120, 150 }); | |
ChartAxis xAxis = chart.AxisX; | |
ChartAxis yAxis = chart.AxisY; | |
// Change the X axis to be category instead of date, so all the points will be put with equal interval on the X axis. | |
xAxis.CategoryType = AxisCategoryType.Category; | |
// Define X axis properties. | |
xAxis.Crosses = AxisCrosses.Custom; | |
xAxis.CrossesAt = 3; // measured in display units of the Y axis (hundreds) | |
xAxis.ReverseOrder = true; | |
xAxis.MajorTickMark = AxisTickMark.Cross; | |
xAxis.MinorTickMark = AxisTickMark.Outside; | |
xAxis.TickLabelOffset = 200; | |
// Define Y axis properties. | |
yAxis.TickLabelPosition = AxisTickLabelPosition.High; | |
yAxis.MajorUnit = 100; | |
yAxis.MinorUnit = 50; | |
yAxis.DisplayUnit.Unit = AxisBuiltInUnit.Hundreds; | |
yAxis.Scaling.Minimum = new AxisBound(100); | |
yAxis.Scaling.Maximum = new AxisBound(700); | |
dataDir = dataDir + @"SetAxisProperties_out.docx"; | |
doc.Save(dataDir); |
Как да зададете Date Времева стойност на оста
Следният пример за код показва как да се определят стойностите на дата/времето на осовите свойства:
// For complete examples and data files, please go to https://github.com/aspose-words/Aspose.Words-for-.NET | |
Document doc = new Document(); | |
DocumentBuilder builder = new DocumentBuilder(doc); | |
// Insert chart. | |
Shape shape = builder.InsertChart(ChartType.Column, 432, 252); | |
Chart chart = shape.Chart; | |
// Clear demo data. | |
chart.Series.Clear(); | |
// Fill data. | |
chart.Series.Add("AW Series 1", | |
new DateTime[] { new DateTime(2017, 11, 06), new DateTime(2017, 11, 09), new DateTime(2017, 11, 15), | |
new DateTime(2017, 11, 21), new DateTime(2017, 11, 25), new DateTime(2017, 11, 29) }, | |
new double[] { 1.2, 0.3, 2.1, 2.9, 4.2, 5.3 }); | |
// Set X axis bounds. | |
ChartAxis xAxis = chart.AxisX; | |
xAxis.Scaling.Minimum = new AxisBound((new DateTime(2017, 11, 05)).ToOADate()); | |
xAxis.Scaling.Maximum = new AxisBound((new DateTime(2017, 12, 03)).ToOADate()); | |
// Set major units to a week and minor units to a day. | |
xAxis.MajorUnit = 7; | |
xAxis.MinorUnit = 1; | |
xAxis.MajorTickMark = AxisTickMark.Cross; | |
xAxis.MinorTickMark = AxisTickMark.Outside; | |
dataDir = dataDir + @"SetDateTimeValuesToAxis_out.docx"; | |
doc.Save(dataDir); |
Как да форматираме стойността на числото на оста
Следният пример за код показва как да се промени формата на числата по оста на стойността:
// For complete examples and data files, please go to https://github.com/aspose-words/Aspose.Words-for-.NET | |
Document doc = new Document(); | |
DocumentBuilder builder = new DocumentBuilder(doc); | |
// Insert chart. | |
Shape shape = builder.InsertChart(ChartType.Column, 432, 252); | |
Chart chart = shape.Chart; | |
// Clear demo data. | |
chart.Series.Clear(); | |
// Fill data. | |
chart.Series.Add("AW Series 1", | |
new string[] { "Item 1", "Item 2", "Item 3", "Item 4", "Item 5" }, | |
new double[] { 1900000, 850000, 2100000, 600000, 1500000 }); | |
// Set number format. | |
chart.AxisY.NumberFormat.FormatCode = "#,##0"; | |
dataDir = dataDir + @"FormatAxisNumber_out.docx"; | |
doc.Save(dataDir); |
Как да се определят границите на оста
На AxisBound
класът представлява минимална или максимална граница на осите. Облигацията може да бъде посочена като цифрова, дата или специална стойност на “автоматично.”
Следният пример за код показва как да се определят границите на оста:
// For complete examples and data files, please go to https://github.com/aspose-words/Aspose.Words-for-.NET | |
Document doc = new Document(); | |
DocumentBuilder builder = new DocumentBuilder(doc); | |
// Insert chart. | |
Shape shape = builder.InsertChart(ChartType.Column, 432, 252); | |
Chart chart = shape.Chart; | |
// Clear demo data. | |
chart.Series.Clear(); | |
// Fill data. | |
chart.Series.Add("AW Series 1", | |
new string[] { "Item 1", "Item 2", "Item 3", "Item 4", "Item 5" }, | |
new double[] { 1.2, 0.3, 2.1, 2.9, 4.2 }); | |
chart.AxisY.Scaling.Minimum = new AxisBound(0); | |
chart.AxisY.Scaling.Maximum = new AxisBound(6); | |
dataDir = dataDir + @"SetboundsOfAxis_out.docx"; | |
doc.Save(dataDir); |
Как да зададете интервал между етикетите
Следният пример за код показва как да се зададе интервалната единица между етикетите по оста:
// For complete examples and data files, please go to https://github.com/aspose-words/Aspose.Words-for-.NET | |
Document doc = new Document(); | |
DocumentBuilder builder = new DocumentBuilder(doc); | |
// Insert chart. | |
Shape shape = builder.InsertChart(ChartType.Column, 432, 252); | |
Chart chart = shape.Chart; | |
// Clear demo data. | |
chart.Series.Clear(); | |
// Fill data. | |
chart.Series.Add("AW Series 1", | |
new string[] { "Item 1", "Item 2", "Item 3", "Item 4", "Item 5" }, | |
new double[] { 1.2, 0.3, 2.1, 2.9, 4.2 }); | |
chart.AxisX.TickLabelSpacing = 2; | |
dataDir = dataDir + @"SetIntervalUnitBetweenLabelsOnAxis_out.docx"; | |
doc.Save(dataDir); |
Как да скрием оста на графиката
Ако искате да покажете или скриете оста на диаграмата, можете просто да постигнете това чрез определяне на стойността на ChartAxis.Hidden
собственост.
Следният пример за код показва как да се скрие оста Y на диаграмата:
// For complete examples and data files, please go to https://github.com/aspose-words/Aspose.Words-for-.NET | |
Document doc = new Document(); | |
DocumentBuilder builder = new DocumentBuilder(doc); | |
// Insert chart. | |
Shape shape = builder.InsertChart(ChartType.Column, 432, 252); | |
Chart chart = shape.Chart; | |
// Clear demo data. | |
chart.Series.Clear(); | |
// Fill data. | |
chart.Series.Add("AW Series 1", | |
new string[] { "Item 1", "Item 2", "Item 3", "Item 4", "Item 5" }, | |
new double[] { 1.2, 0.3, 2.1, 2.9, 4.2 }); | |
// Hide the Y axis. | |
chart.AxisY.Hidden = true; | |
dataDir = dataDir + @"HideChartAxis_out.docx"; | |
doc.Save(dataDir); |
Как да се подравнява етикет диаграма
Ако искате да зададете подравняване на текст за многолинейни етикети, можете просто да постигнете това чрез определяне на стойността на TickLabels.Подравняване собственост.
Следният пример за код показва как да се открои подравняването на етикета:
// For complete examples and data files, please go to https://github.com/aspose-words/Aspose.Words-for-.NET | |
Document doc = new Document(dataDir + "Document.docx"); | |
Shape shape = (Shape)doc.GetChild(NodeType.Shape, 0, true); | |
ChartAxis axis = shape.Chart.AxisX; | |
//This property has effect only for multi-line labels. | |
axis.TickLabelAlignment = ParagraphAlignment.Right; | |
doc.Save(dataDir + "Document_out.docx"); |
Как да зададете форматиране на запълване и удар
Запълване и инсулт форматиране може да се настрои за диаграма серия, точки от данни, и маркери. За да направите това, трябва да използвате свойствата на ChartFormat тип в ChartSeries, ChartDataPoint, както и ChartMarker класове, както и псевдоними за някои имоти, като например ForeColor, BackColor, Visible, и прозрачност в Stroke
Клас.
Следният пример за код показва как да зададете цвят серия:
Document doc = new Document();
DocumentBuilder builder = new DocumentBuilder(doc);
Shape shape = builder.InsertChart(ChartType.Column, 432, 252);
Chart chart = shape.Chart;
ChartSeriesCollection seriesColl = chart.Series;
// Delete default generated series.
seriesColl.Clear();
// Create category names array.
string[] categories = new string[] { "AW Category 1", "AW Category 2" };
// Adding new series. Value and category arrays must be the same size.
ChartSeries series1 = seriesColl.Add("AW Series 1", categories, new double[] { 1, 2 });
ChartSeries series2 = seriesColl.Add("AW Series 2", categories, new double[] { 3, 4 });
ChartSeries series3 = seriesColl.Add("AW Series 3", categories, new double[] { 5, 6 });
// Set series color.
series1.Format.Fill.ForeColor = Color.Red;
series2.Format.Fill.ForeColor = Color.Yellow;
series3.Format.Fill.ForeColor = Color.Blue;
doc.Save(dir + "ColumnColor.docx");
Следният пример за код показва как да зададете цвят и тегло линия:
Document doc = new Document();
DocumentBuilder builder = new DocumentBuilder(doc);
Shape shape = builder.InsertChart(ChartType.Line, 432, 252);
Chart chart = shape.Chart;
ChartSeriesCollection seriesColl = chart.Series;
// Delete default generated series.
seriesColl.Clear();
// Adding new series.
ChartSeries series1 = seriesColl.Add("AW Series 1", new double[] { 0.7, 1.8, 2.6 },
new double[] { 2.7, 3.2, 0.8 });
ChartSeries series2 = seriesColl.Add("AW Series 2", new double[] { 0.5, 1.5, 2.5 },
new double[] { 3, 1, 2 });
// Set series color.
series1.Format.Stroke.ForeColor = Color.Red;
series1.Format.Stroke.Weight = 5;
series2.Format.Stroke.ForeColor = Color.LightGreen;
series2.Format.Stroke.Weight = 5;
doc.Save(dir + "LineColorAndWeight.docx");