차트 작업
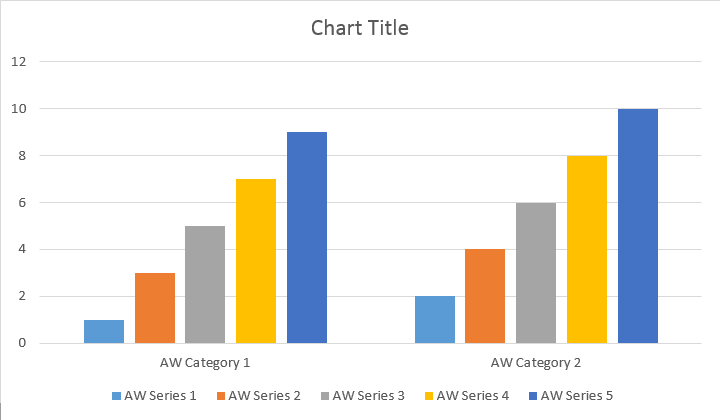
DocumentBuilder 클래스에 새로운 insert_chart 메소드가 추가되었습니다. 이제 DocumentBuilder.insert_chart 메서드를 사용하여 간단한 세로 막대형 차트를 문서에 삽입하는 방법을 살펴보겠습니다
차트를 삽입하는 방법
이번 섹션에서는 문서에 차트를 삽입하는 방법을 알아봅니다.
기둥형 차트 삽입
다음 코드 예제에서는 세로 막대형 차트를 삽입하는 방법을 보여줍니다
# For complete examples and data files, please go to https://github.com/aspose-words/Aspose.Words-for-Python-via-.NET | |
doc = aw.Document() | |
builder = aw.DocumentBuilder(doc) | |
# You can specify different chart types and sizes. | |
shape = builder.insert_chart(aw.drawing.charts.ChartType.COLUMN, 432, 252) | |
chart = shape.chart | |
seriesColl = chart.series | |
print(seriesColl.count) | |
# Delete default generated series. | |
seriesColl.clear() | |
# Create category names array, in this example we have two categories. | |
categories = [ "Category 1", "Category 2" ] | |
# Please note, data arrays must not be empty and arrays must be the same size. | |
seriesColl.add("Aspose Series 1", categories, [ 1, 2 ]) | |
seriesColl.add("Aspose Series 2", categories, [ 3, 4 ]) | |
seriesColl.add("Aspose Series 3", categories, [ 5, 6 ]) | |
seriesColl.add("Aspose Series 4", categories, [ 7, 8 ]) | |
seriesColl.add("Aspose Series 5", categories, [ 9, 10 ]) | |
doc.save(docs_base.artifacts_dir + "WorkingWithCharts.insert_simple_column_chart.docx") |
코드는 다음과 같은 결과를 생성합니다
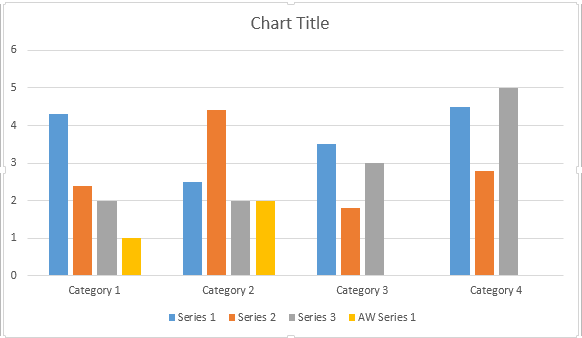
모든 차트 유형에 대해 가능한 모든 데이터 소스 변형을 포괄하기 위해 공개된 add, add_double 및 add_date 방법이 있습니다
# For complete examples and data files, please go to https://github.com/aspose-words/Aspose.Words-for-Python-via-.NET | |
doc = aw.Document() | |
builder = aw.DocumentBuilder(doc) | |
shape = builder.insert_chart(aw.drawing.charts.ChartType.COLUMN, 432, 252) | |
chart = shape.chart | |
chart.series.add("Aspose Series 1", [ "Category 1", "Category 2" ], [ 1, 2 ]) | |
doc.save(docs_base.artifacts_dir + "WorkingWithCharts.insert_column_chart.docx") |
코드는 다음과 같은 결과를 생성합니다
분산형 차트 삽입
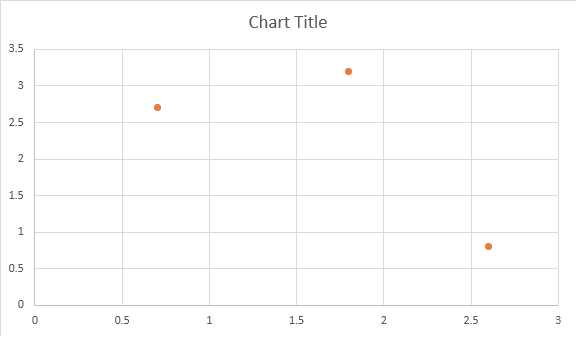
아래 예에서는 분산형 차트를 삽입하는 방법을 보여줍니다.
# For complete examples and data files, please go to https://github.com/aspose-words/Aspose.Words-for-Python-via-.NET | |
doc = aw.Document() | |
builder = aw.DocumentBuilder(doc) | |
shape = builder.insert_chart(aw.drawing.charts.ChartType.SCATTER, 432, 252) | |
chart = shape.chart | |
chart.series.add_double("Aspose Series 1", [ 0.7, 1.8, 2.6 ], [ 2.7, 3.2, 0.8 ]) | |
doc.save(docs_base.artifacts_dir + "WorkingWithCharts.insert_scatter_chart.docx") |
코드는 다음과 같은 결과를 생성합니다
영역 차트 삽입
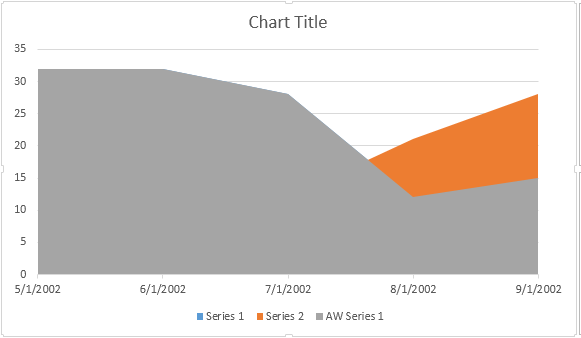
다음 코드 예제에서는 영역 차트를 삽입하는 방법을 보여줍니다
# For complete examples and data files, please go to https://github.com/aspose-words/Aspose.Words-for-Python-via-.NET | |
doc = aw.Document() | |
builder = aw.DocumentBuilder(doc) | |
shape = builder.insert_chart(aw.drawing.charts.ChartType.AREA, 432, 252) | |
chart = shape.chart | |
chart.series.add_date("Aspose Series 1", | |
[ date(2002, 5, 1), date(2002, 6, 1), date(2002, 7, 1), date(2002, 8, 1), date(2002, 9, 1) ], | |
[ 32, 32, 28, 12, 15 ]) | |
doc.save(docs_base.artifacts_dir + "WorkingWithCharts.insert_area_chart.docx") |
코드는 다음과 같은 결과를 생성합니다
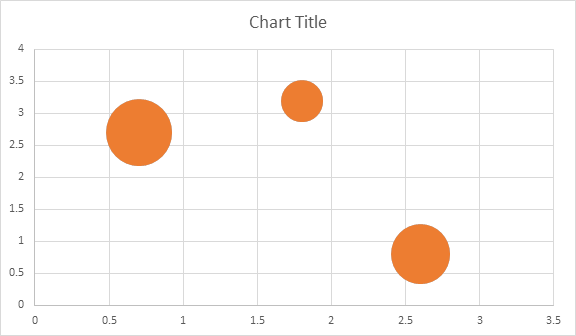
거품형 차트 삽입
다음 코드 예제에서는 거품형 차트를 삽입하는 방법을 보여줍니다
# For complete examples and data files, please go to https://github.com/aspose-words/Aspose.Words-for-Python-via-.NET | |
doc = aw.Document() | |
builder = aw.DocumentBuilder(doc) | |
shape = builder.insert_chart(aw.drawing.charts.ChartType.BUBBLE, 432, 252) | |
chart = shape.chart | |
chart.series.add("Aspose Series 1", [ 0.7, 1.8, 2.6 ], [ 2.7, 3.2, 0.8 ], [ 10, 4, 8 ]) | |
doc.save(docs_base.artifacts_dir + "WorkingWithCharts.insert_bubble_chart.docx") |
코드는 다음과 같은 결과를 생성합니다
Shape.chart 객체를 통한 차트 작업
차트를 삽입하고 데이터로 채운 후에는 차트 모양을 변경할 수 있습니다. Shape.chart 속성에는 공개 API를 통해 사용할 수 있는 모든 차트 관련 옵션이 포함되어 있습니다.
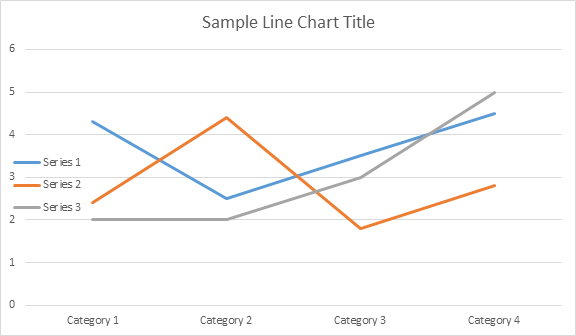
예를 들어 Chart 제목이나 범례 동작을 변경해 보겠습니다
# For complete examples and data files, please go to https://github.com/aspose-words/Aspose.Words-for-Python-via-.NET | |
doc = aw.Document() | |
builder = aw.DocumentBuilder(doc) | |
shape = builder.insert_chart(aw.drawing.charts.ChartType.LINE, 432, 252) | |
chart = shape.chart | |
chart.title.show = True | |
chart.title.text = "Line Chart Title" | |
chart.title.overlay = False | |
# Please note if None or empty value is specified as title text, auto generated title will be shown. | |
chart.legend.position = aw.drawing.charts.LegendPosition.LEFT | |
chart.legend.overlay = True | |
doc.save(docs_base.artifacts_dir + "WorkingWithCharts.create_chart_using_shape.docx") |
코드는 다음 결과를 생성합니다
ChartSeries로 작업하는 방법차트 컬렉션
ChartSeries 컬렉션을 살펴보겠습니다. 모든 차트 시리즈는 Chart.series 컬렉션을 통해 제공됩니다
# For complete examples and data files, please go to https://github.com/aspose-words/Aspose.Words-for-Python-via-.NET | |
seriesColl = chart.series | |
print(seriesColl.count) |
시리즈를 하나씩 제거하거나 모두 지우고 필요한 경우 새 시리즈를 추가할 수 있습니다. 새로 삽입된 차트에는 이 컬렉션에 일부 기본 계열이 추가되어 있습니다. 이를 제거하려면 chart.series.clear() 메서드를 호출해야 합니다.
단일 ChartSeries 클래스 작업
특정 시리즈로 작업하는 방법은 다음과 같습니다.
# For complete examples and data files, please go to https://github.com/aspose-words/Aspose.Words-for-Python-via-.NET | |
series0 = chart.series[0] | |
series1 = chart.series[1] | |
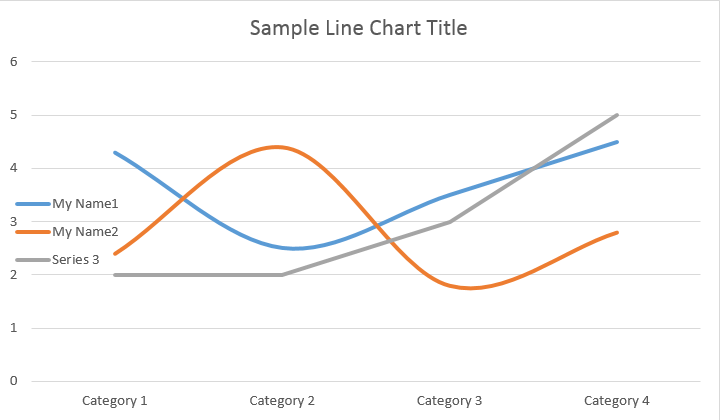
series0.name = "Chart Series Name 1" | |
series1.name = "Chart Series Name 2" | |
# You can also specify whether the line connecting the points on the chart shall be smoothed using Catmull-Rom splines. | |
series0.smooth = True | |
series1.smooth = True |
아래 결과를 확인하세요
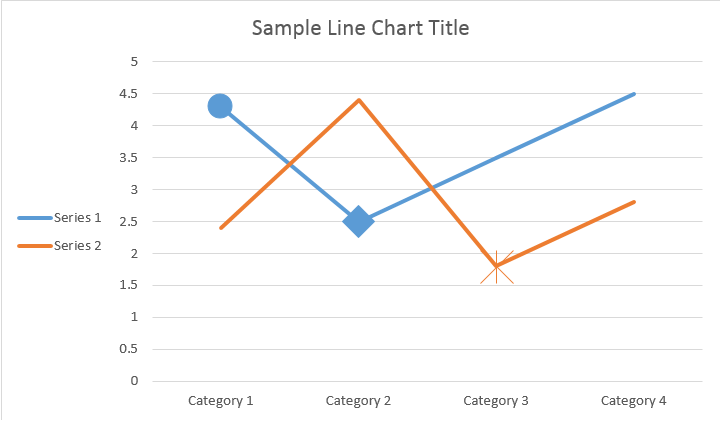
모든 단일 ChartSeries에는 기본 ChartDataPoint 옵션이 있습니다. 다음 코드를 사용하여 변경해 보세요
# For complete examples and data files, please go to https://github.com/aspose-words/Aspose.Words-for-Python-via-.NET | |
# Specifies whether by default the parent element shall inverts its colors if the value is negative. | |
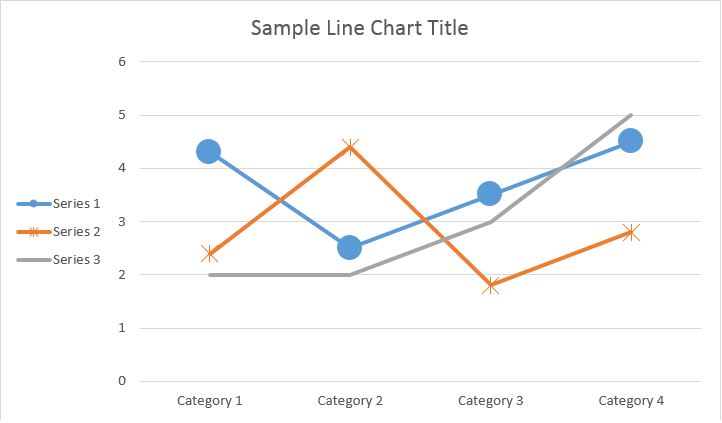
series0.invert_if_negative = True | |
series0.marker.symbol = aw.drawing.charts.MarkerSymbol.CIRCLE | |
series0.marker.size = 15 | |
series1.marker.symbol = aw.drawing.charts.MarkerSymbol.STAR | |
series1.marker.size = 10 |
아래 결과를 확인하세요
ChartSeries
의 단일 ChartDataPoint로 작업하는 방법
ChartDataPoint를 사용하면 차트 시리즈의 단일 데이터 포인트 형식을 사용자 정의할 수 있습니다
# For complete examples and data files, please go to https://github.com/aspose-words/Aspose.Words-for-Python-via-.NET | |
doc = aw.Document() | |
builder = aw.DocumentBuilder(doc) | |
shape = builder.insert_chart(aw.drawing.charts.ChartType.LINE, 432, 252) | |
chart = shape.chart | |
series0 = chart.series[0] | |
series1 = chart.series[1] | |
dataPointCollection = series0.data_points | |
dataPoint00 = dataPointCollection[0] | |
dataPoint01 = dataPointCollection[1] | |
dataPoint00.explosion = 50 | |
dataPoint00.marker.symbol = aw.drawing.charts.MarkerSymbol.CIRCLE | |
dataPoint00.marker.size = 15 | |
dataPoint01.marker.symbol = aw.drawing.charts.MarkerSymbol.DIAMOND | |
dataPoint01.marker.size = 20 | |
dataPoint12 = series1.data_points[2] | |
dataPoint12.invert_if_negative = True | |
dataPoint12.marker.symbol = aw.drawing.charts.MarkerSymbol.STAR | |
dataPoint12.marker.size = 20 | |
doc.save(docs_base.artifacts_dir + "WorkingWithCharts.single_chart_data_point.docx") |
아래 결과를 확인하세요
단일 ChartSeries의 ChartDataLabel로 작업하는 방법
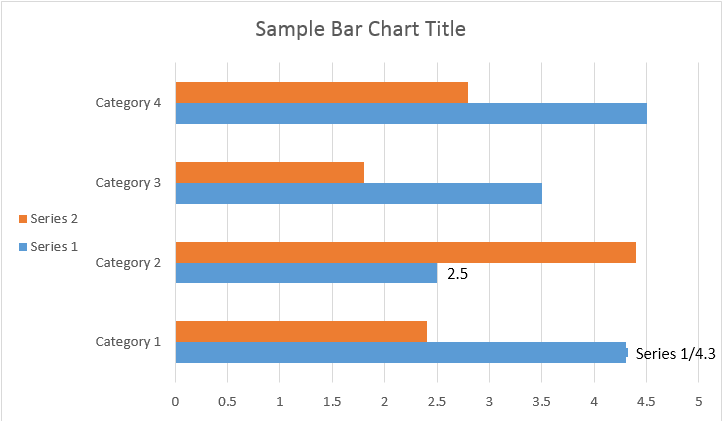
ChartDataLabel를 사용하면 LegendKey, CategoryName, SeriesName, Value 등 표시/숨기기와 같은 차트 시리즈의 단일 데이터 레이블 형식을 지정할 수 있습니다.
# For complete examples and data files, please go to https://github.com/aspose-words/Aspose.Words-for-Python-via-.NET | |
doc = aw.Document() | |
builder = aw.DocumentBuilder(doc) | |
shape = builder.insert_chart(aw.drawing.charts.ChartType.BAR, 432, 252) | |
chart = shape.chart | |
series0 = shape.chart.series[0] | |
labels = series0.data_labels | |
labels.show_legend_key = True | |
# By default, when you add data labels to the data points in a pie chart, leader lines are displayed for data labels that are | |
# positioned far outside the end of data points. Leader lines create a visual connection between a data label and its | |
# corresponding data point. | |
labels.show_leader_lines = True | |
labels.show_category_name = False | |
labels.show_percentage = False | |
labels.show_series_name = True | |
labels.show_value = True | |
labels.separator = "/" | |
labels.show_value = True | |
doc.save(docs_base.artifacts_dir + "WorkingWithCharts.chart_data_label.docx") |
아래 결과를 확인하세요
ChartSeries의 ChartDataLabels에 대한 기본 옵션을 정의하는 방법
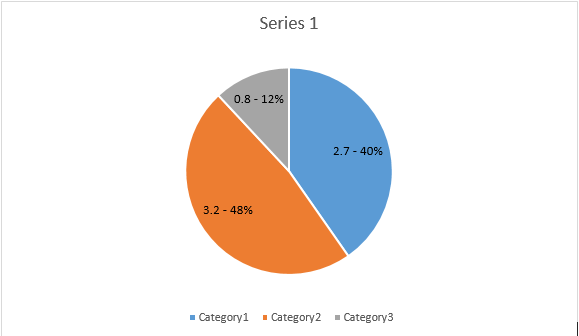
ChartDataLabelCollection 클래스는 차트 시리즈용 ChartDataLabels의 기본 옵션을 설정하는 데 사용할 수 있는 속성을 정의합니다. 이러한 속성에는 show_category_name, show_bubble_size, show_percentage, show_series_name, show_value 등이 포함됩니다.
# For complete examples and data files, please go to https://github.com/aspose-words/Aspose.Words-for-Python-via-.NET | |
doc = aw.Document() | |
builder = aw.DocumentBuilder(doc) | |
shape = builder.insert_chart(aw.drawing.charts.ChartType.PIE, 432, 252) | |
chart = shape.chart | |
chart.series.clear() | |
series = chart.series.add("Aspose Series 1", | |
[ "Category 1", "Category 2", "Category 3" ], | |
[ 2.7, 3.2, 0.8 ]) | |
labels = series.data_labels | |
labels.show_percentage = True | |
labels.show_value = True | |
labels.show_leader_lines = False | |
labels.separator = " - " | |
doc.save(docs_base.artifacts_dir + "WorkingWithCharts.default_options_for_data_labels.docx") |
아래 결과를 확인하세요
차트 데이터 레이블 수의 형식을 지정하는 방법
ChartDataLabel.number_format를 사용하면 차트의 단일 데이터 레이블에 대한 숫자 형식을 지정할 수 있습니다.
다음 코드 예제에서는 데이터 레이블 번호의 형식을 지정하는 방법을 보여줍니다
# For complete examples and data files, please go to https://github.com/aspose-words/Aspose.Words-for-Python-via-.NET | |
doc = aw.Document() | |
builder = aw.DocumentBuilder(doc) | |
shape = builder.insert_chart(aw.drawing.charts.ChartType.LINE, 432, 252) | |
chart = shape.chart | |
chart.title.text = "Data Labels With Different Number Format" | |
# Delete default generated series. | |
chart.series.clear() | |
series1 = chart.series.add("Aspose Series 1", [ "Category 1", "Category 2", "Category 3" ], [ 2.5, 1.5, 3.5 ]) | |
series1.has_data_labels = True | |
series1.data_labels.show_value = True | |
series1.data_labels[0].number_format.format_code = "\"$\"#,##0.00" | |
series1.data_labels[1].number_format.format_code = "dd/mm/yyyy" | |
series1.data_labels[2].number_format.format_code = "0.00%" | |
# Or you can set format code to be linked to a source cell, | |
# in this case NumberFormat will be reset to general and inherited from a source cell. | |
series1.data_labels[2].number_format.is_linked_to_source = True | |
doc.save(docs_base.artifacts_dir + "WorkingWithCharts.format_number_of_data_label.docx") |
차트 축 속성을 설정하는 방법
차트 축, 스케일링, 값 축의 표시 단위로 작업하려면 ChartAxis, AxisDisplayUnit, AxisScaling 클래스를 사용하세요.
다음 코드 예제에서는 X 및 Y축 속성을 정의하는 방법을 보여줍니다
# For complete examples and data files, please go to https://github.com/aspose-words/Aspose.Words-for-Python-via-.NET | |
doc = aw.Document() | |
builder = aw.DocumentBuilder(doc) | |
# Insert chart | |
shape = builder.insert_chart(aw.drawing.charts.ChartType.AREA, 432, 252) | |
chart = shape.chart | |
chart.series.clear() | |
chart.series.add_date("Aspose Series 1", | |
[ date(2002, 1, 1), date(2002, 6, 1), date(2002, 7, 1), date(2002, 8, 1), date(2002, 9, 1) ], | |
[ 640, 320, 280, 120, 150 ]) | |
xAxis = chart.axis_x | |
yAxis = chart.axis_y | |
# Change the X axis to be category instead of date, so all the points will be put with equal interval on the X axis. | |
xAxis.category_type = aw.drawing.charts.AxisCategoryType.CATEGORY | |
xAxis.crosses = aw.drawing.charts.AxisCrosses.CUSTOM | |
xAxis.crosses_at = 3 # Measured in display units of the Y axis (hundreds). | |
xAxis.reverse_order = True | |
xAxis.major_tick_mark = aw.drawing.charts.AxisTickMark.CROSS | |
xAxis.minor_tick_mark = aw.drawing.charts.AxisTickMark.OUTSIDE | |
xAxis.tick_label_offset = 200 | |
yAxis.tick_label_position = aw.drawing.charts.AxisTickLabelPosition.HIGH | |
yAxis.major_unit = 100 | |
yAxis.minor_unit = 50 | |
yAxis.display_unit.unit = aw.drawing.charts.AxisBuiltInUnit.HUNDREDS | |
yAxis.scaling.minimum = aw.drawing.charts.AxisBound(100) | |
yAxis.scaling.maximum = aw.drawing.charts.AxisBound(700) | |
doc.save(docs_base.artifacts_dir + "WorkingWithCharts.define_xy_axis_properties.docx") |
축의 Date 시간 값을 설정하는 방법
다음 코드 예제에서는 축 속성에 날짜/시간 값을 설정하는 방법을 보여줍니다
# For complete examples and data files, please go to https://github.com/aspose-words/Aspose.Words-for-Python-via-.NET | |
doc = aw.Document() | |
builder = aw.DocumentBuilder(doc) | |
shape = builder.insert_chart(aw.drawing.charts.ChartType.COLUMN, 432, 252) | |
chart = shape.chart | |
chart.series.clear() | |
chart.series.add_date("Aspose Series 1", | |
[ date(2017, 11, 6), date(2017, 11, 9), date(2017, 11, 15), date(2017, 11, 21), date(2017, 11, 25), date(2017, 11, 29) ], | |
[ 1.2, 0.3, 2.1, 2.9, 4.2, 5.3 ]) | |
xAxis = chart.axis_x | |
xAxis.scaling.minimum = aw.drawing.charts.AxisBound(date(2017, 11, 5)) | |
xAxis.scaling.maximum = aw.drawing.charts.AxisBound(date(2017, 12, 3)) | |
# Set major units to a week and minor units to a day. | |
xAxis.major_unit = 7 | |
xAxis.minor_unit = 1 | |
xAxis.major_tick_mark = aw.drawing.charts.AxisTickMark.CROSS | |
xAxis.minor_tick_mark = aw.drawing.charts.AxisTickMark.OUTSIDE | |
doc.save(docs_base.artifacts_dir + "WorkingWithCharts.date_time_values_to_axis.docx") |
축의 숫자 값 형식을 지정하는 방법
다음 코드 예제에서는 값 축의 숫자 형식을 변경하는 방법을 보여줍니다
# For complete examples and data files, please go to https://github.com/aspose-words/Aspose.Words-for-Python-via-.NET | |
doc = aw.Document() | |
builder = aw.DocumentBuilder(doc) | |
shape = builder.insert_chart(aw.drawing.charts.ChartType.COLUMN, 432, 252) | |
chart = shape.chart | |
chart.series.clear() | |
chart.series.add("Aspose Series 1", | |
[ "Item 1", "Item 2", "Item 3", "Item 4", "Item 5" ], | |
[ 1900000, 850000, 2100000, 600000, 1500000 ]) | |
chart.axis_y.number_format.format_code = "#,##0" | |
doc.save(docs_base.artifacts_dir + "WorkingWithCharts.number_format_for_axis.docx") |
축 경계를 설정하는 방법
AxisBound 클래스는 축 값의 최소 또는 최대 경계를 나타냅니다. 경계는 숫자, 날짜-시간 또는 특수 “자동” 값으로 지정할 수 있습니다.
다음 코드 예제에서는 축 경계를 설정하는 방법을 보여줍니다
# For complete examples and data files, please go to https://github.com/aspose-words/Aspose.Words-for-Python-via-.NET | |
doc = aw.Document() | |
builder = aw.DocumentBuilder(doc) | |
shape = builder.insert_chart(aw.drawing.charts.ChartType.COLUMN, 432, 252) | |
chart = shape.chart | |
chart.series.clear() | |
chart.series.add("Aspose Series 1", | |
[ "Item 1", "Item 2", "Item 3", "Item 4", "Item 5" ], | |
[ 1.2, 0.3, 2.1, 2.9, 4.2 ]) | |
chart.axis_y.scaling.minimum = aw.drawing.charts.AxisBound(0) | |
chart.axis_y.scaling.maximum = aw.drawing.charts.AxisBound(6) | |
doc.save(docs_base.artifacts_dir + "WorkingWithCharts.bounds_of_axis.docx") |
라벨 사이의 간격 단위를 설정하는 방법
다음 코드 예제에서는 축의 레이블 간 간격 단위를 설정하는 방법을 보여줍니다
# For complete examples and data files, please go to https://github.com/aspose-words/Aspose.Words-for-Python-via-.NET | |
doc = aw.Document() | |
builder = aw.DocumentBuilder(doc) | |
shape = builder.insert_chart(aw.drawing.charts.ChartType.COLUMN, 432, 252) | |
chart = shape.chart | |
chart.series.clear() | |
chart.series.add("Aspose Series 1", | |
[ "Item 1", "Item 2", "Item 3", "Item 4", "Item 5" ], | |
[ 1.2, 0.3, 2.1, 2.9, 4.2 ]) | |
chart.axis_x.tick_label_spacing = 2 | |
doc.save(docs_base.artifacts_dir + "WorkingWithCharts.interval_unit_between_labels_on_axis.docx") |
차트 축을 숨기는 방법
차트 축을 표시하거나 숨기려면 ChartAxis.hidden 속성 값을 설정하면 됩니다.
다음 코드 예제에서는 차트의 Y축을 숨기는 방법을 보여줍니다
# For complete examples and data files, please go to https://github.com/aspose-words/Aspose.Words-for-Python-via-.NET | |
doc = aw.Document() | |
builder = aw.DocumentBuilder(doc) | |
shape = builder.insert_chart(aw.drawing.charts.ChartType.COLUMN, 432, 252) | |
chart = shape.chart | |
chart.series.clear() | |
chart.series.add("Aspose Series 1", | |
[ "Item 1", "Item 2", "Item 3", "Item 4", "Item 5" ], | |
[ 1.2, 0.3, 2.1, 2.9, 4.2 ]) | |
chart.axis_y.hidden = True | |
doc.save(docs_base.artifacts_dir + "WorkingWithCharts.hide_chart_axis.docx") |
차트 레이블을 정렬하는 방법
여러 줄 레이블에 대한 텍스트 정렬을 설정하려면 ChartAxis.tick_label_alignment 속성 값을 설정하면 됩니다.
다음 코드 예제에서는 레이블 정렬을 선택하는 방법을 보여줍니다
# For complete examples and data files, please go to https://github.com/aspose-words/Aspose.Words-for-Python-via-.NET | |
doc = aw.Document() | |
builder = aw.DocumentBuilder(doc) | |
shape = builder.insert_chart(aw.drawing.charts.ChartType.SCATTER, 450, 250) | |
axis = shape.chart.axis_x | |
# This property has effect only for multi-line labels. | |
axis.tick_label_alignment = aw.ParagraphAlignment.RIGHT | |
doc.save(docs_base.artifacts_dir + "WorkingWithCharts.tick_multi_line_label_alignment.docx") |
채우기 및 획 서식을 설정하는 방법
차트 시리즈, 데이터 포인트 및 마커에 대해 채우기 및 획 서식을 설정할 수 있습니다. 이렇게 하려면 ChartSeries, ChartDataPoint 및 ChartMarker 클래스의 ChartFormat 유형 속성과 Stroke 클래스의 fore_color, back_color, visible 및 transparency와 같은 일부 속성에 대한 별칭을 사용해야 합니다.
다음 코드 예제에서는 계열 색상을 설정하는 방법을 보여줍니다
doc = aw.Document()
builder = aw.DocumentBuilder(doc)
shape = builder.insert_chart(aw.drawing.charts.ChartType.COLUMN, 432, 252)
chart = shape.chart
seriesColl = chart.series
# Delete default generated series.
seriesColl.clear()
# Create category names array.
categories = [ "AW Category 1", "AW Category 2" ]
# Adding new series. Value and category arrays must be the same size.
series1 = seriesColl.add("AW Series 1", categories, [ 1, 2 ])
series2 = seriesColl.add("AW Series 2", categories, [ 3, 4 ])
series3 = seriesColl.add("AW Series 3", categories, [ 5, 6 ])
# Set series color.
series1.format.fill.fore_color = drawing.Color.red
series2.format.fill.fore_color = drawing.Color.yellow
series3.format.fill.fore_color = drawing.Color.blue
doc.save(docs_base.artifacts_dir + "WorkingWithCharts.set_series_color.docx")
다음 코드 예제에서는 선 색상과 두께를 설정하는 방법을 보여줍니다
doc = aw.Document()
builder = aw.DocumentBuilder(doc)
shape = builder.insert_chart(aw.drawing.charts.ChartType.LINE, 432, 252)
chart = shape.chart
seriesColl = chart.series
# Delete default generated series.
seriesColl.clear()
# Adding new series.
series1 = seriesColl.add_double("AW Series 1", [ 0.7, 1.8, 2.6 ], [ 2.7, 3.2, 0.8 ])
series2 = seriesColl.add_double("AW Series 2", [ 0.5, 1.5, 2.5 ], [ 3, 1, 2 ])
# Set series color.
series1.format.stroke.fore_color = drawing.Color.red
series1.format.stroke.weight = 5
series2.format.stroke.fore_color = drawing.Color.light_green
series2.format.stroke.weight = 5
doc.save(docs_base.artifacts_dir + "WorkingWithCharts.line_color_and_weight.docx")