Grafiklerle Çalışmak

DocumentBuilder sınıfına yeni InsertChart yöntemi eklendi. Şimdi InsertChart yöntemini kullanarak belgeye basit bir sütun grafiğinin nasıl ekleneceğini görelim.

Grafik Nasıl Eklenir

Bu bölümde bir belgeye nasıl grafik ekleyeceğimizi öğreneceğiz.

Sütun Grafiği Ekle

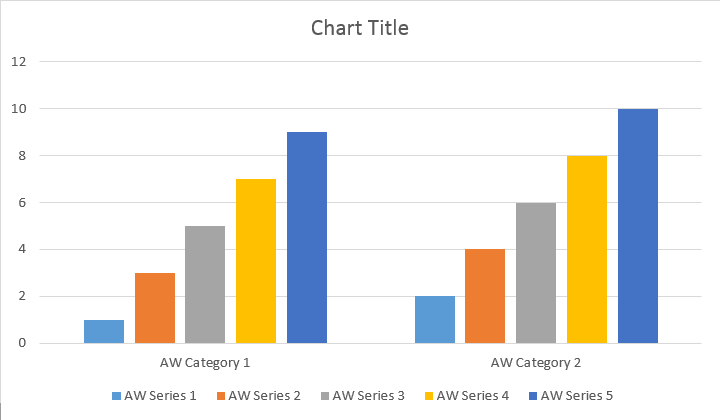
Aşağıdaki kod örneği, sütun grafiğinin nasıl ekleneceğini gösterir:

// For complete examples and data files, please go to https://github.com/aspose-words/Aspose.Words-for-.NET
Document doc = new Document();
DocumentBuilder builder = new DocumentBuilder(doc);
// Add chart with default data. You can specify different chart types and sizes.
Shape shape = builder.InsertChart(ChartType.Column, 432, 252);
// Chart property of Shape contains all chart related options.
Chart chart = shape.Chart;
// Get chart series collection.
ChartSeriesCollection seriesColl = chart.Series;
// Check series count.
Console.WriteLine(seriesColl.Count);
// Delete default generated series.
seriesColl.Clear();
// Create category names array, in this example we have two categories.
string[] categories = new string[] { "AW Category 1", "AW Category 2" };
// Adding new series. Please note, data arrays must not be empty and arrays must be the same size.
seriesColl.Add("AW Series 1", categories, new double[] { 1, 2 });
seriesColl.Add("AW Series 2", categories, new double[] { 3, 4 });
seriesColl.Add("AW Series 3", categories, new double[] { 5, 6 });
seriesColl.Add("AW Series 4", categories, new double[] { 7, 8 });
seriesColl.Add("AW Series 5", categories, new double[] { 9, 10 });
dataDir = dataDir + @"TestInsertSimpleChartColumn_out.doc";
doc.Save(dataDir);

Kod aşağıdaki sonucu üretir:

create-column-chart-aspose-words-net

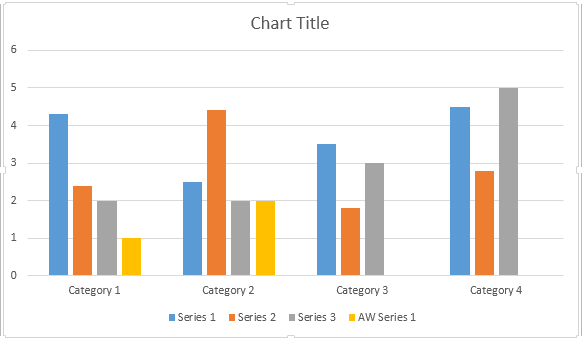
Tüm grafik türleri için veri kaynaklarının tüm olası varyantlarını kapsadığı açıklanan Seri Ekleme yöntemi için dört farklı aşırı yükleme vardır:

// For complete examples and data files, please go to https://github.com/aspose-words/Aspose.Words-for-.NET
Document doc = new Document();
DocumentBuilder builder = new DocumentBuilder(doc);
// Insert Column chart.
Shape shape = builder.InsertChart(ChartType.Column, 432, 252);
Chart chart = shape.Chart;
// Use this overload to add series to any type of Bar, Column, Line and Surface charts.
chart.Series.Add("AW Series 1", new string[] { "AW Category 1", "AW Category 2" }, new double[] { 1, 2 });
dataDir = dataDir + @"TestInsertChartColumn_out.doc";
doc.Save(dataDir);

Kod aşağıdaki sonucu üretir:

create-column-chart-from-datasource-aspose-words-net

Dağılım Grafiği Ekle

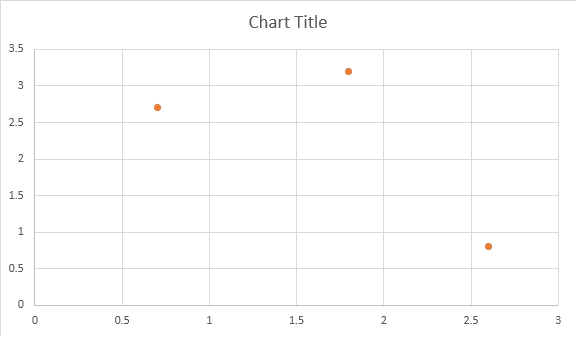
Aşağıdaki kod örneği dağılım grafiğinin nasıl ekleneceğini gösterir:

// For complete examples and data files, please go to https://github.com/aspose-words/Aspose.Words-for-.NET
// The path to the documents directory.
string dataDir = RunExamples.GetDataDir_WorkingWithCharts();
Document doc = new Document();
DocumentBuilder builder = new DocumentBuilder(doc);
// Insert Scatter chart.
Shape shape = builder.InsertChart(ChartType.Scatter, 432, 252);
Chart chart = shape.Chart;
// Use this overload to add series to any type of Scatter charts.
chart.Series.Add("AW Series 1", new double[] { 0.7, 1.8, 2.6 }, new double[] { 2.7, 3.2, 0.8 });
dataDir = dataDir + "TestInsertScatterChart_out.docx";
doc.Save(dataDir);

Kod aşağıdaki sonucu üretir:

scatter-chart-aspose-words-net

Alan Grafiği Ekle

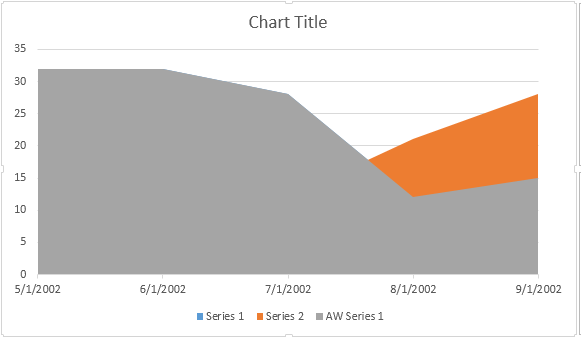
Aşağıdaki kod örneği alan grafiğinin nasıl ekleneceğini gösterir:

// For complete examples and data files, please go to https://github.com/aspose-words/Aspose.Words-for-.NET
// The path to the documents directory.
string dataDir = RunExamples.GetDataDir_WorkingWithCharts();
Document doc = new Document();
DocumentBuilder builder = new DocumentBuilder(doc);
// Insert Area chart.
Shape shape = builder.InsertChart(ChartType.Area, 432, 252);
Chart chart = shape.Chart;
// Use this overload to add series to any type of Area, Radar and Stock charts.
chart.Series.Add("AW Series 1", new DateTime[] {
new DateTime(2002, 05, 01),
new DateTime(2002, 06, 01),
new DateTime(2002, 07, 01),
new DateTime(2002, 08, 01),
new DateTime(2002, 09, 01)},
new double[] { 32, 32, 28, 12, 15 });
dataDir = dataDir + @"TestInsertAreaChart_out.docx";
doc.Save(dataDir);

Kod aşağıdaki sonucu üretir:

area-chart-aspose-words-net

Kabarcık Grafiği Ekle

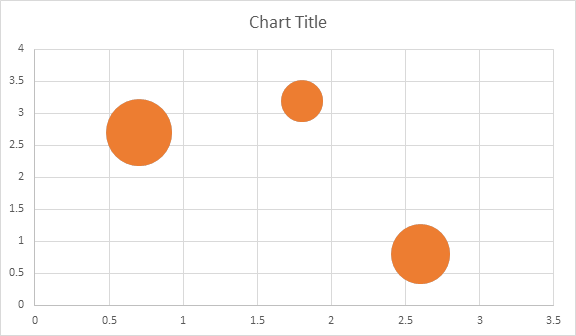
Aşağıdaki kod örneği, kabarcık grafiğinin nasıl ekleneceğini gösterir:

// For complete examples and data files, please go to https://github.com/aspose-words/Aspose.Words-for-.NET
// The path to the documents directory.
string dataDir = RunExamples.GetDataDir_WorkingWithCharts();
Document doc = new Document();
DocumentBuilder builder = new DocumentBuilder(doc);
// Insert Bubble chart.
Shape shape = builder.InsertChart(ChartType.Bubble, 432, 252);
Chart chart = shape.Chart;
// Use this overload to add series to any type of Bubble charts.
chart.Series.Add("AW Series 1", new double[] { 0.7, 1.8, 2.6 }, new double[] { 2.7, 3.2, 0.8 }, new double[] { 10, 4, 8 });
dataDir = dataDir + @"TestInsertBubbleChart_out.docx";
doc.Save(dataDir);

Kod aşağıdaki sonucu üretir:

bubble-chart-aspose-words-net

Shape.Chart Nesnesi Aracılığıyla Grafiklerle Çalışmak

Grafik eklenip verilerle doldurulduktan sonra görünümünü değiştirebilirsiniz. Shape.Chart özelliği, genel API aracılığıyla kullanılabilen grafikle ilgili tüm seçenekleri içerir.

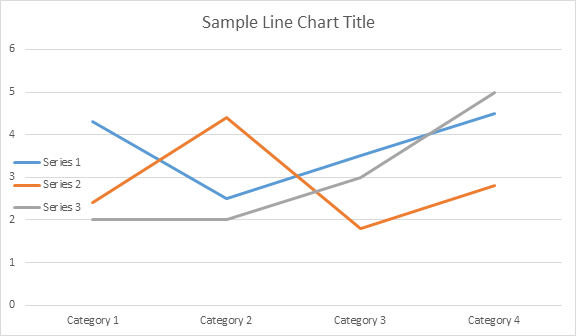
Örneğin, Grafik başlığını veya açıklama davranışını değiştirelim:

// For complete examples and data files, please go to https://github.com/aspose-words/Aspose.Words-for-.NET
// The path to the documents directory.
string dataDir = RunExamples.GetDataDir_WorkingWithCharts();
Document doc = new Document();
DocumentBuilder builder = new DocumentBuilder(doc);
Shape shape = builder.InsertChart(ChartType.Line, 432, 252);
Chart chart = shape.Chart;
// Determines whether the title shall be shown for this chart. Default is true.
chart.Title.Show = true;
// Setting chart Title.
chart.Title.Text = "Sample Line Chart Title";
// Determines whether other chart elements shall be allowed to overlap title.
chart.Title.Overlay = false;
// Please note if null or empty value is specified as title text, auto generated title will be shown.
// Determines how legend shall be shown for this chart.
chart.Legend.Position = LegendPosition.Left;
chart.Legend.Overlay = true;
dataDir = dataDir + @"SimpleLineChart_out.docx";
doc.Save(dataDir);

Kod aşağıdaki sonuçları üretir:

line-chart-aspose-words-net

ChartSeriesCollection of Chart ile Nasıl Çalışılır

ChartSeries koleksiyonuna bakalım. Tüm grafik serilerine IEnumerable olan chart.Series koleksiyonu aracılığıyla ulaşılabilir:

// For complete examples and data files, please go to https://github.com/aspose-words/Aspose.Words-for-.NET
// Get chart series collection.
ChartSeriesCollection seriesColl = chart.Series;
// Check series count.
Console.WriteLine(seriesColl.Count);

Serileri tek tek kaldırabileceğiniz gibi hepsini temizleyebileceğiniz gibi, ihtiyaç halinde yeni bir seri de ekleyebilirsiniz. Yeni eklenen grafikte bu koleksiyona eklenen bazı varsayılan seriler var. Bunları kaldırmak için chart.Series.Clear() yöntemini çağırmanız gerekir.

Tek ChartSeries Sınıfıyla Çalışmak

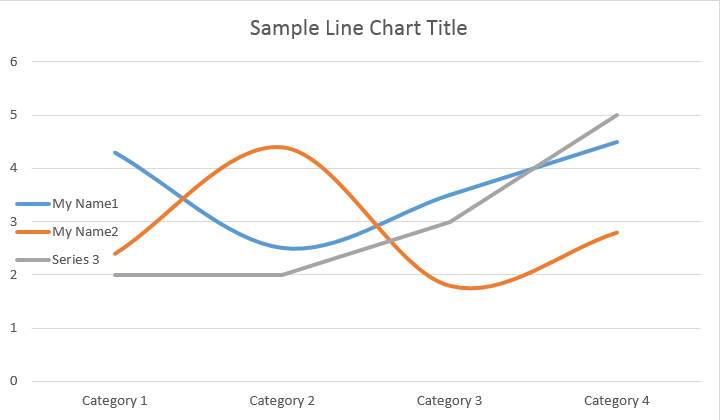
Belirli bir seriyle nasıl çalışılacağı aşağıda açıklanmıştır:

// For complete examples and data files, please go to https://github.com/aspose-words/Aspose.Words-for-.NET
// Get first series.
ChartSeries series0 = shape.Chart.Series[0];
// Get second series.
ChartSeries series1 = shape.Chart.Series[1];
// Change first series name.
series0.Name = "My Name1";
// Change second series name.
series1.Name = "My Name2";
// You can also specify whether the line connecting the points on the chart shall be smoothed using Catmull-Rom splines.
series0.Smooth = true;
series1.Smooth = true;

Lütfen aşağıdaki sonuca bakın:

line-chart-chartseries-aspose-words-net

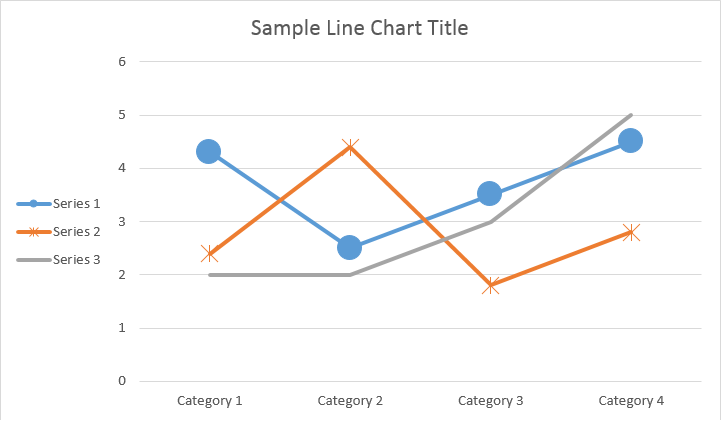
Tüm tek ChartSeries‘lerin varsayılan ChartDataPoint seçenekleri vardır; bunları değiştirmek için lütfen aşağıdaki kodu kullanmayı deneyin:

// For complete examples and data files, please go to https://github.com/aspose-words/Aspose.Words-for-.NET
// Specifies whether by default the parent element shall inverts its colors if the value is negative.
series0.InvertIfNegative = true;
// Set default marker symbol and size.
series0.Marker.Symbol = MarkerSymbol.Circle;
series0.Marker.Size = 15;
series1.Marker.Symbol = MarkerSymbol.Star;
series1.Marker.Size = 10;

Lütfen aşağıdaki sonuca bakın:

line-chart-chartdatapoint-aspose-words-net

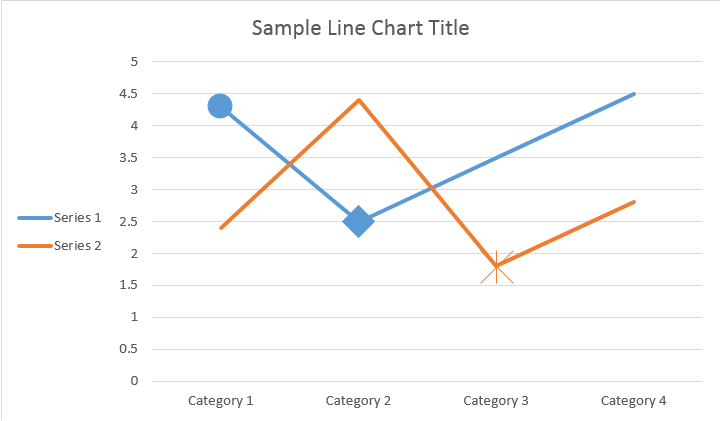
ChartSeries‘in Tek ChartDataPoint’iyle Nasıl Çalışılır?

ChartDataPoint‘i kullanarak grafik serisinin tek bir veri noktasının formatını özelleştirebilirsiniz:

// For complete examples and data files, please go to https://github.com/aspose-words/Aspose.Words-for-.NET
// The path to the documents directory.
string dataDir = RunExamples.GetDataDir_WorkingWithCharts();
Document doc = new Document();
DocumentBuilder builder = new DocumentBuilder(doc);
Shape shape = builder.InsertChart(ChartType.Line, 432, 252);
Chart chart = shape.Chart;
// Get first series.
ChartSeries series0 = shape.Chart.Series[0];
// Get second series.
ChartSeries series1 = shape.Chart.Series[1];
ChartDataPointCollection dataPointCollection = series0.DataPoints;
// Add data point to the first and second point of the first series.
ChartDataPoint dataPoint00 = dataPointCollection.Add(0);
ChartDataPoint dataPoint01 = dataPointCollection.Add(1);
// Set explosion.
dataPoint00.Explosion = 50;
// Set marker symbol and size.
dataPoint00.Marker.Symbol = MarkerSymbol.Circle;
dataPoint00.Marker.Size = 15;
dataPoint01.Marker.Symbol = MarkerSymbol.Diamond;
dataPoint01.Marker.Size = 20;
// Add data point to the third point of the second series.
ChartDataPoint dataPoint12 = series1.DataPoints.Add(2);
dataPoint12.InvertIfNegative = true;
dataPoint12.Marker.Symbol = MarkerSymbol.Star;
dataPoint12.Marker.Size = 20;
dataDir = dataDir + @"SingleChartDataPoint_out.docx";
doc.Save(dataDir);

Lütfen aşağıdaki sonuca bakın:

line-chart-datapoint-aspose-words-net

Tek bir ChartSeries’in ChartDataLabel’ı ile Nasıl Çalışılır?

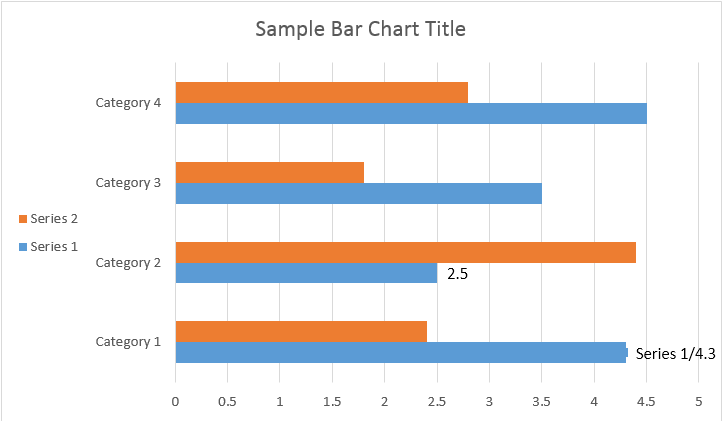
ChartDataLabel‘i kullanarak, grafik serisinin tek bir veri etiketinin formatını, LegendKey’i göster/gizle, KategoriAdı, SeriAdı, Değer vb. gibi belirtebilirsiniz:

// For complete examples and data files, please go to https://github.com/aspose-words/Aspose.Words-for-.NET
Document doc = new Document();
DocumentBuilder builder = new DocumentBuilder(doc);
Shape shape = builder.InsertChart(ChartType.Bar, 432, 252);
Chart chart = shape.Chart;
// Get first series.
ChartSeries series0 = shape.Chart.Series[0];
ChartDataLabelCollection labels = series0.DataLabels;
// Set properties.
labels.ShowLegendKey = true;
// By default, when you add data labels to the data points in a pie chart, leader lines are displayed for data labels that are
// Positioned far outside the end of data points. Leader lines create a visual connection between a data label and its
// Corresponding data point.
labels.ShowLeaderLines = true;
labels.ShowCategoryName = false;
labels.ShowPercentage = false;
labels.ShowSeriesName = true;
labels.ShowValue = true;
labels.Separator = "/";
labels.ShowValue = true;
dataDir = dataDir + "SimpleBarChart_out.docx";
doc.Save(dataDir);

Lütfen aşağıdaki sonuca bakın:

bar-chart-aspose-words-net

ChartSeries’in ChartDataLabels’ı için Varsayılan Seçenekler Nasıl Tanımlanır?

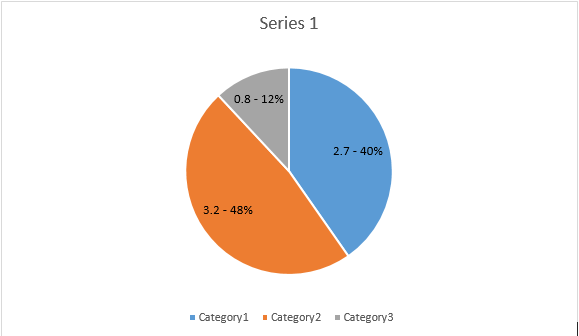
ChartDataLabelCollection sınıfı, Grafik Series için ChartDataLabels‘ye ilişkin varsayılan seçenekleri ayarlamak için kullanılabilecek özellikleri tanımlar. Bu özellikler arasında ShowCategoryName, ShowBubbleSize, ShowPercentage, ShowSeriesName, ShowValue vb. bulunur:

// For complete examples and data files, please go to https://github.com/aspose-words/Aspose.Words-for-.NET
Document doc = new Document();
DocumentBuilder builder = new DocumentBuilder(doc);
Shape shape = builder.InsertChart(ChartType.Pie, 432, 252);
Chart chart = shape.Chart;
chart.Series.Clear();
ChartSeries series = chart.Series.Add("Series 1",
new string[] { "Category1", "Category2", "Category3" },
new double[] { 2.7, 3.2, 0.8 });
ChartDataLabelCollection labels = series.DataLabels;
labels.ShowPercentage = true;
labels.ShowValue = true;
labels.ShowLeaderLines = false;
labels.Separator = " - ";
doc.Save(dataDir + "Demo.docx");

Lütfen aşağıdaki sonuca bakın:

pie-chart-aspose-words-net

Grafik Veri Etiketi Sayısı Nasıl Biçimlendirilir

NumberFormat‘i kullanarak grafiğin tek bir veri etiketinin sayı formatını belirleyebilirsiniz.

Aşağıdaki kod örneği, bir dizi veri etiketinin nasıl biçimlendirileceğini gösterir:

// For complete examples and data files, please go to https://github.com/aspose-words/Aspose.Words-for-.NET
Document doc = new Document();
DocumentBuilder builder = new DocumentBuilder(doc);
// Add chart with default data.
Shape shape = builder.InsertChart(ChartType.Line, 432, 252);
Chart chart = shape.Chart;
chart.Title.Text = "Data Labels With Different Number Format";
// Delete default generated series.
chart.Series.Clear();
// Add new series
ChartSeries series1 = chart.Series.Add("AW Series 1",
new string[] { "AW0", "AW1", "AW2" },
new double[] { 2.5, 1.5, 3.5 });
series1.HasDataLabels = true;
series1.DataLabels.ShowValue = true;
series1.DataLabels[0].NumberFormat.FormatCode = "\"$\"#,##0.00";
series1.DataLabels[1].NumberFormat.FormatCode = "dd/mm/yyyy";
series1.DataLabels[2].NumberFormat.FormatCode = "0.00%";
// Or you can set format code to be linked to a source cell,
// in this case NumberFormat will be reset to general and inherited from a source cell.
series1.DataLabels[2].NumberFormat.IsLinkedToSource = true;
dataDir = dataDir + @"NumberFormat_DataLabel_out.docx";
doc.Save(dataDir);

Grafik Ekseni Özellikleri Nasıl Ayarlanır

Değer ekseni için grafik ekseni, ölçeklendirme ve görüntüleme birimleriyle çalışmak istiyorsanız lütfen ChartAxis, AxisDisplayUnit ve AxisScaling sınıflarını kullanın.

Aşağıdaki kod örneği, X ve Y ekseni özelliklerinin nasıl tanımlanacağını gösterir:

// For complete examples and data files, please go to https://github.com/aspose-words/Aspose.Words-for-.NET
Document doc = new Document();
DocumentBuilder builder = new DocumentBuilder(doc);
// Insert chart.
Shape shape = builder.InsertChart(ChartType.Area, 432, 252);
Chart chart = shape.Chart;
// Clear demo data.
chart.Series.Clear();
// Fill data.
chart.Series.Add("AW Series 1",
new DateTime[] { new DateTime(2002, 01, 01), new DateTime(2002, 06, 01), new DateTime(2002, 07, 01), new DateTime(2002, 08, 01), new DateTime(2002, 09, 01) },
new double[] { 640, 320, 280, 120, 150 });
ChartAxis xAxis = chart.AxisX;
ChartAxis yAxis = chart.AxisY;
// Change the X axis to be category instead of date, so all the points will be put with equal interval on the X axis.
xAxis.CategoryType = AxisCategoryType.Category;
// Define X axis properties.
xAxis.Crosses = AxisCrosses.Custom;
xAxis.CrossesAt = 3; // measured in display units of the Y axis (hundreds)
xAxis.ReverseOrder = true;
xAxis.MajorTickMark = AxisTickMark.Cross;
xAxis.MinorTickMark = AxisTickMark.Outside;
xAxis.TickLabelOffset = 200;
// Define Y axis properties.
yAxis.TickLabelPosition = AxisTickLabelPosition.High;
yAxis.MajorUnit = 100;
yAxis.MinorUnit = 50;
yAxis.DisplayUnit.Unit = AxisBuiltInUnit.Hundreds;
yAxis.Scaling.Minimum = new AxisBound(100);
yAxis.Scaling.Maximum = new AxisBound(700);
dataDir = dataDir + @"SetAxisProperties_out.docx";
doc.Save(dataDir);

Eksenin Date Zaman Değeri Nasıl Ayarlanır

Aşağıdaki kod örneği, tarih/saat değerlerinin eksen özelliklerine nasıl ayarlanacağını gösterir:

// For complete examples and data files, please go to https://github.com/aspose-words/Aspose.Words-for-.NET
Document doc = new Document();
DocumentBuilder builder = new DocumentBuilder(doc);
// Insert chart.
Shape shape = builder.InsertChart(ChartType.Column, 432, 252);
Chart chart = shape.Chart;
// Clear demo data.
chart.Series.Clear();
// Fill data.
chart.Series.Add("AW Series 1",
new DateTime[] { new DateTime(2017, 11, 06), new DateTime(2017, 11, 09), new DateTime(2017, 11, 15),
new DateTime(2017, 11, 21), new DateTime(2017, 11, 25), new DateTime(2017, 11, 29) },
new double[] { 1.2, 0.3, 2.1, 2.9, 4.2, 5.3 });
// Set X axis bounds.
ChartAxis xAxis = chart.AxisX;
xAxis.Scaling.Minimum = new AxisBound((new DateTime(2017, 11, 05)).ToOADate());
xAxis.Scaling.Maximum = new AxisBound((new DateTime(2017, 12, 03)).ToOADate());
// Set major units to a week and minor units to a day.
xAxis.MajorUnit = 7;
xAxis.MinorUnit = 1;
xAxis.MajorTickMark = AxisTickMark.Cross;
xAxis.MinorTickMark = AxisTickMark.Outside;
dataDir = dataDir + @"SetDateTimeValuesToAxis_out.docx";
doc.Save(dataDir);

Eksenin Sayı Değeri Nasıl Formatlanır?

Aşağıdaki kod örneği, değer eksenindeki sayıların biçiminin nasıl değiştirileceğini gösterir:

// For complete examples and data files, please go to https://github.com/aspose-words/Aspose.Words-for-.NET
Document doc = new Document();
DocumentBuilder builder = new DocumentBuilder(doc);
// Insert chart.
Shape shape = builder.InsertChart(ChartType.Column, 432, 252);
Chart chart = shape.Chart;
// Clear demo data.
chart.Series.Clear();
// Fill data.
chart.Series.Add("AW Series 1",
new string[] { "Item 1", "Item 2", "Item 3", "Item 4", "Item 5" },
new double[] { 1900000, 850000, 2100000, 600000, 1500000 });
// Set number format.
chart.AxisY.NumberFormat.FormatCode = "#,##0";
dataDir = dataDir + @"FormatAxisNumber_out.docx";
doc.Save(dataDir);

Eksen Sınırları Nasıl Ayarlanır

AxisBound sınıfı, eksen değerlerinin minimum veya maksimum sınırını temsil eder. Sınır; sayısal, tarih-saat veya özel bir “otomatik” değer olarak belirtilebilir.

Aşağıdaki kod örneği, bir eksenin sınırlarının nasıl ayarlanacağını gösterir:

// For complete examples and data files, please go to https://github.com/aspose-words/Aspose.Words-for-.NET
Document doc = new Document();
DocumentBuilder builder = new DocumentBuilder(doc);
// Insert chart.
Shape shape = builder.InsertChart(ChartType.Column, 432, 252);
Chart chart = shape.Chart;
// Clear demo data.
chart.Series.Clear();
// Fill data.
chart.Series.Add("AW Series 1",
new string[] { "Item 1", "Item 2", "Item 3", "Item 4", "Item 5" },
new double[] { 1.2, 0.3, 2.1, 2.9, 4.2 });
chart.AxisY.Scaling.Minimum = new AxisBound(0);
chart.AxisY.Scaling.Maximum = new AxisBound(6);
dataDir = dataDir + @"SetboundsOfAxis_out.docx";
doc.Save(dataDir);

Etiketler Arasındaki Aralık Birimi Nasıl Ayarlanır

Aşağıdaki kod örneği, bir eksendeki etiketler arasındaki aralık biriminin nasıl ayarlanacağını gösterir:

// For complete examples and data files, please go to https://github.com/aspose-words/Aspose.Words-for-.NET
Document doc = new Document();
DocumentBuilder builder = new DocumentBuilder(doc);
// Insert chart.
Shape shape = builder.InsertChart(ChartType.Column, 432, 252);
Chart chart = shape.Chart;
// Clear demo data.
chart.Series.Clear();
// Fill data.
chart.Series.Add("AW Series 1",
new string[] { "Item 1", "Item 2", "Item 3", "Item 4", "Item 5" },
new double[] { 1.2, 0.3, 2.1, 2.9, 4.2 });
chart.AxisX.TickLabelSpacing = 2;
dataDir = dataDir + @"SetIntervalUnitBetweenLabelsOnAxis_out.docx";
doc.Save(dataDir);

Grafik Eksenini Gizleme

Grafik eksenini göstermek veya gizlemek istiyorsanız bunu ChartAxis.Hidden özelliğinin değerini ayarlayarak kolayca yapabilirsiniz.

Aşağıdaki kod örneği, grafiğin Y ekseninin nasıl gizleneceğini gösterir:

// For complete examples and data files, please go to https://github.com/aspose-words/Aspose.Words-for-.NET
Document doc = new Document();
DocumentBuilder builder = new DocumentBuilder(doc);
// Insert chart.
Shape shape = builder.InsertChart(ChartType.Column, 432, 252);
Chart chart = shape.Chart;
// Clear demo data.
chart.Series.Clear();
// Fill data.
chart.Series.Add("AW Series 1",
new string[] { "Item 1", "Item 2", "Item 3", "Item 4", "Item 5" },
new double[] { 1.2, 0.3, 2.1, 2.9, 4.2 });
// Hide the Y axis.
chart.AxisY.Hidden = true;
dataDir = dataDir + @"HideChartAxis_out.docx";
doc.Save(dataDir);

Grafik Etiketi Nasıl Hizalanır?

Çok satırlı etiketler için metin hizalamasını ayarlamak istiyorsanız bunu TickLabels.Alignment özelliğinin değerini ayarlayarak kolayca yapabilirsiniz.

Aşağıdaki kod örneği, etiket hizalamasının nasıl işaretleneceğini gösterir:

// For complete examples and data files, please go to https://github.com/aspose-words/Aspose.Words-for-.NET
Document doc = new Document(dataDir + "Document.docx");
Shape shape = (Shape)doc.GetChild(NodeType.Shape, 0, true);
ChartAxis axis = shape.Chart.AxisX;
//This property has effect only for multi-line labels.
axis.TickLabelAlignment = ParagraphAlignment.Right;
doc.Save(dataDir + "Document_out.docx");

Dolgu ve Kontur Biçimlendirmesi Nasıl Ayarlanır

Grafik serileri, veri noktaları ve işaretçiler için dolgu ve kontur biçimlendirmesi ayarlanabilir. Bunu yapmak için ChartSeries, ChartDataPoint ve ChartMarker sınıflarında ChartFormat türünün özelliklerini, ayrıca Stroke sınıfında ForeColor, BackColor, Visible ve Transparency gibi bazı özelliklerin takma adlarını kullanmanız gerekir.

Aşağıdaki kod örneği seri renginin nasıl ayarlanacağını gösterir:

Document doc = new Document();
DocumentBuilder builder = new DocumentBuilder(doc);

Shape shape = builder.InsertChart(ChartType.Column, 432, 252);

Chart chart = shape.Chart;
ChartSeriesCollection seriesColl = chart.Series;

// Delete default generated series.
seriesColl.Clear();

// Create category names array.
string[] categories = new string[] { "AW Category 1", "AW Category 2" };

// Adding new series. Value and category arrays must be the same size.
ChartSeries series1 = seriesColl.Add("AW Series 1", categories, new double[] { 1, 2 });
ChartSeries series2 = seriesColl.Add("AW Series 2", categories, new double[] { 3, 4 });
ChartSeries series3 = seriesColl.Add("AW Series 3", categories, new double[] { 5, 6 });

// Set series color.
series1.Format.Fill.ForeColor = Color.Red;
series2.Format.Fill.ForeColor = Color.Yellow;
series3.Format.Fill.ForeColor = Color.Blue;

doc.Save(dir + "ColumnColor.docx");

Aşağıdaki kod örneği çizgi renginin ve kalınlığının nasıl ayarlanacağını gösterir:

Document doc = new Document();
DocumentBuilder builder = new DocumentBuilder(doc);

Shape shape = builder.InsertChart(ChartType.Line, 432, 252);

Chart chart = shape.Chart;
ChartSeriesCollection seriesColl = chart.Series;

// Delete default generated series.
seriesColl.Clear();

// Adding new series.
ChartSeries series1 = seriesColl.Add("AW Series 1", new double[] { 0.7, 1.8, 2.6 },
	new double[] { 2.7, 3.2, 0.8 });
ChartSeries series2 = seriesColl.Add("AW Series 2", new double[] { 0.5, 1.5, 2.5 },
	new double[] { 3, 1, 2 });

// Set series color.
series1.Format.Stroke.ForeColor = Color.Red;
series1.Format.Stroke.Weight = 5;
series2.Format.Stroke.ForeColor = Color.LightGreen;
series2.Format.Stroke.Weight = 5;

doc.Save(dir + "LineColorAndWeight.docx");