Analyzing your prompt, please hold on...
An error occurred while retrieving the results. Please refresh the page and try again.
Phương thức InsertChart mới đã được thêm vào lớp DocumentBuilder. Vì vậy, hãy xem cách chèn biểu đồ cột đơn giản vào tài liệu bằng phương pháp InsertChart.
Trong phần này chúng ta sẽ tìm hiểu cách chèn biểu đồ vào tài liệu.
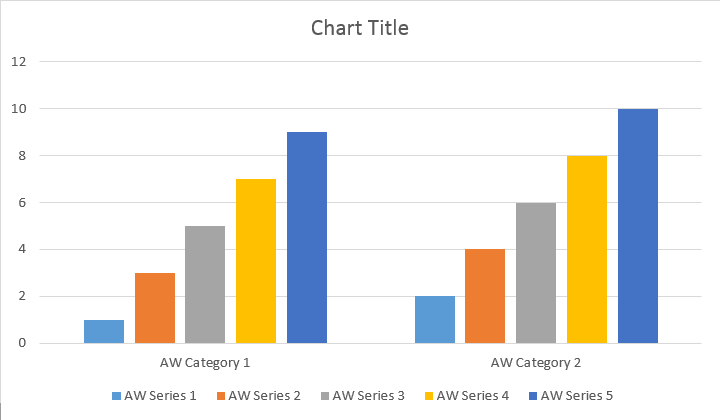
Ví dụ mã sau đây cho thấy cách chèn biểu đồ cột:
Mã tạo ra kết quả sau:
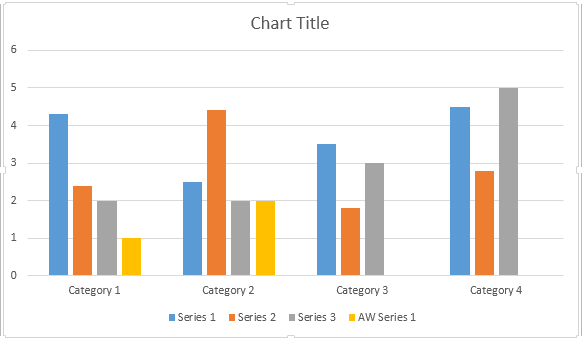
Có bốn cách nạp chồng khác nhau cho phương pháp Thêm chuỗi, được đưa ra để bao gồm tất cả các biến thể có thể có của nguồn dữ liệu cho tất cả các loại biểu đồ:
Mã tạo ra kết quả sau:
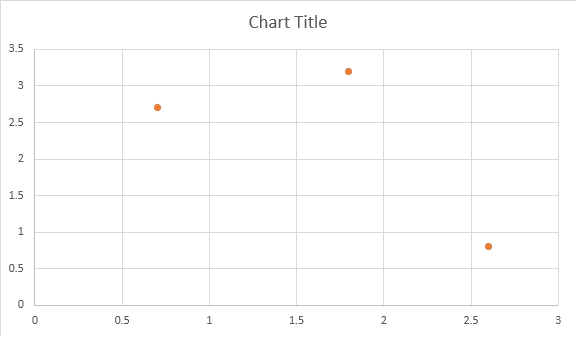
Ví dụ mã sau đây cho biết cách chèn biểu đồ tán xạ:
Mã tạo ra kết quả sau:
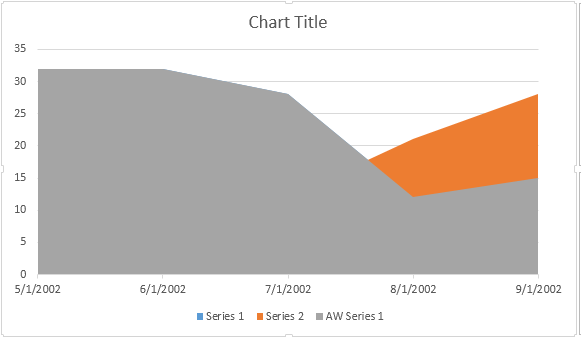
Ví dụ mã sau đây cho biết cách chèn biểu đồ vùng:
Mã tạo ra kết quả sau:
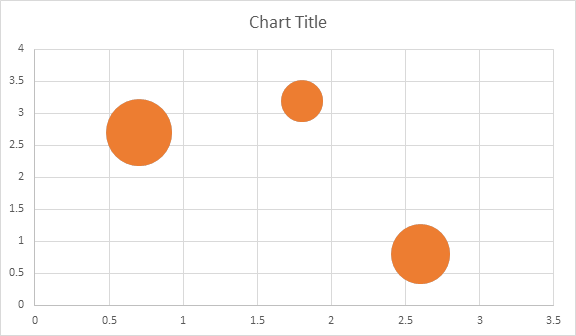
Ví dụ mã sau đây cho biết cách chèn biểu đồ bong bóng:
Mã tạo ra kết quả sau:
Shape.ChartSau khi biểu đồ được chèn và chứa đầy dữ liệu, bạn có thể thay đổi giao diện của biểu đồ. Thuộc tính Shape.Chart chứa tất cả các tùy chọn liên quan đến biểu đồ có sẵn thông qua API công khai.
Ví dụ: hãy thay đổi tiêu đề biểu đồ hoặc hành vi chú giải:
Mã tạo ra kết quả sau:
Hãy cùng nhìn vào bộ sưu tập ChartSeries. Tất cả các chuỗi biểu đồ đều có sẵn thông qua bộ sưu tập chart.Series, là IEnumerable:
Bạn có thể xóa từng bộ một hoặc xóa tất cả chúng cũng như thêm một bộ mới nếu cần. Biểu đồ mới được chèn có một số chuỗi mặc định được thêm vào bộ sưu tập này. Để loại bỏ chúng, bạn cần gọi phương thức biểu đồ.Series.Clear().
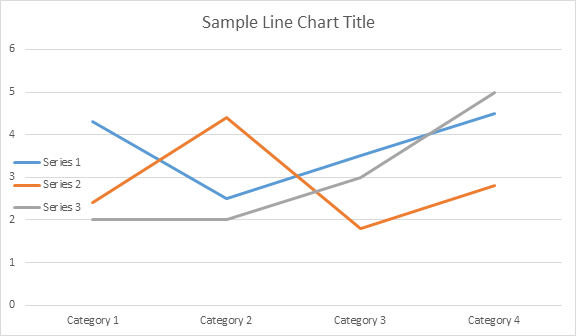
Đây là cách làm việc với một chuỗi cụ thể:
Xin vui lòng xem kết quả dưới đây:
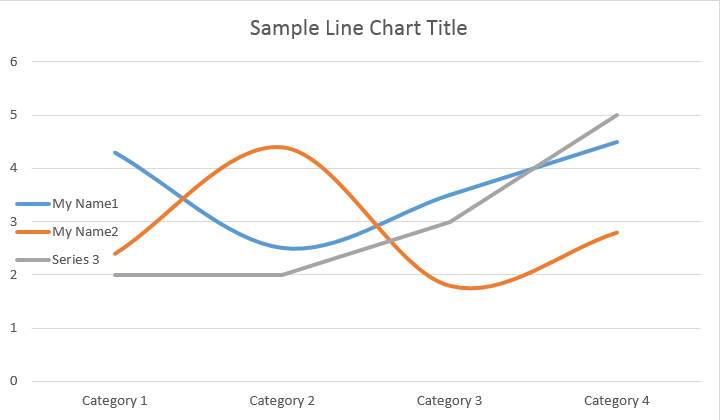
Tất cả ChartSeries đơn lẻ đều có các tùy chọn ChartDataPoint mặc định, vui lòng thử sử dụng đoạn mã sau để thay đổi chúng:
Xin vui lòng xem kết quả dưới đây:
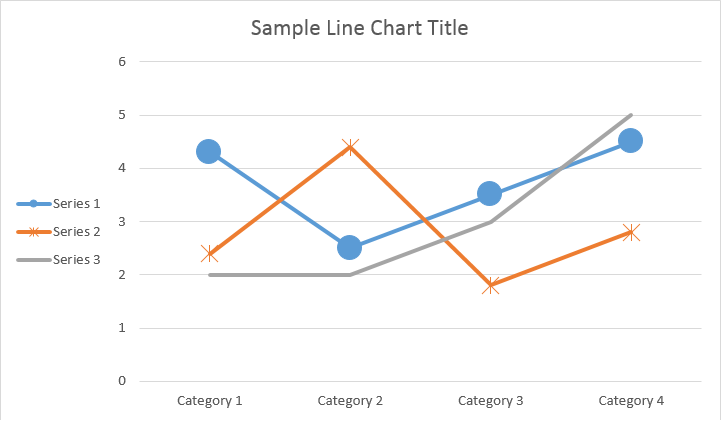
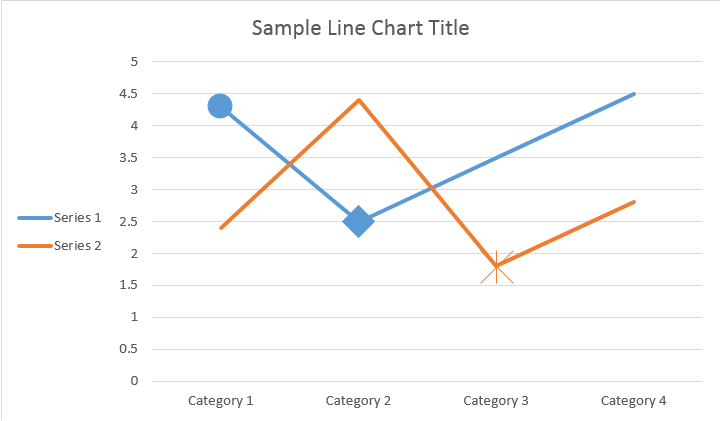
ChartSeriesSử dụng ChartDataPoint, bạn có thể tùy chỉnh định dạng của một điểm dữ liệu duy nhất trong chuỗi biểu đồ:
Xin vui lòng xem kết quả dưới đây:
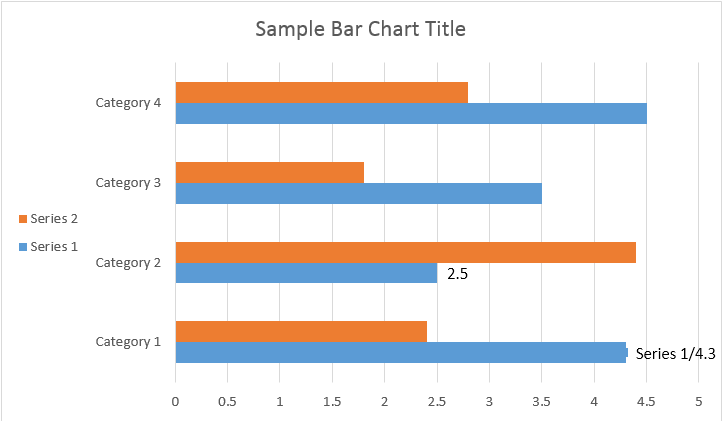
Sử dụng ChartDataLabel, bạn có thể chỉ định định dạng của một nhãn dữ liệu duy nhất của chuỗi biểu đồ, như hiển thị/ẩn LegendKey, CategoryName, SeriesName, Value, v.v.:
Xin vui lòng xem kết quả dưới đây:
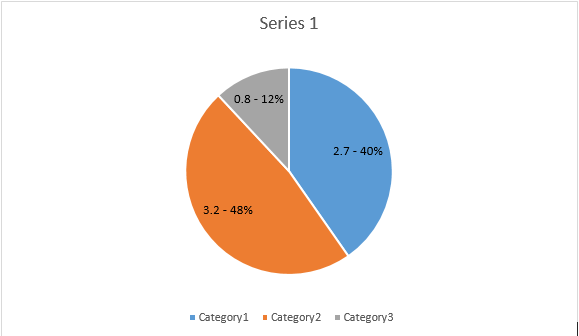
Lớp ChartDataLabelCollection xác định các thuộc tính có thể được sử dụng để đặt các tùy chọn mặc định cho ChartDataLabels cho Series biểu đồ. Các thuộc tính này bao gồm ShowCategoryName, ShowBubbleSize, ShowPercentage, ShowSeriesName, ShowValue, v.v.:
Xin vui lòng xem kết quả dưới đây:
Sử dụng NumberFormat, bạn có thể chỉ định định dạng số của một nhãn dữ liệu duy nhất trên biểu đồ.
Ví dụ mã sau đây cho thấy cách định dạng một số nhãn dữ liệu:
Nếu bạn muốn làm việc với trục biểu đồ, chia tỷ lệ và đơn vị hiển thị cho trục giá trị, vui lòng sử dụng các lớp ChartAxis, AxisDisplayUnit và AxisScaling.
Ví dụ mã sau đây cho thấy cách xác định thuộc tính trục X và Y:
Ví dụ mã sau đây cho thấy cách đặt giá trị ngày/giờ cho thuộc tính trục:
Ví dụ mã sau đây cho thấy cách thay đổi định dạng của số trên trục giá trị:
Lớp AxisBound biểu thị giới hạn tối thiểu hoặc tối đa của các giá trị trục. Giới hạn có thể được chỉ định dưới dạng giá trị số, ngày giờ hoặc giá trị “tự động” đặc biệt.
Ví dụ mã sau đây cho thấy cách đặt giới hạn của một trục:
Ví dụ mã sau đây cho thấy cách đặt đơn vị khoảng giữa các nhãn trên một trục:
Nếu bạn muốn hiển thị hoặc ẩn trục biểu đồ, bạn chỉ cần thực hiện điều này bằng cách đặt giá trị của thuộc tính ChartAxis.Hidden.
Ví dụ mã sau đây cho biết cách ẩn trục Y của biểu đồ:
Nếu bạn muốn đặt căn chỉnh văn bản cho nhãn nhiều dòng, bạn chỉ cần đạt được điều này bằng cách đặt giá trị của thuộc tính TickLabels.Căn chỉnh.
Ví dụ mã sau đây cho thấy cách đánh dấu căn chỉnh nhãn:
Định dạng điền và nét có thể được đặt cho chuỗi biểu đồ, điểm dữ liệu và điểm đánh dấu. Để thực hiện việc này, bạn cần sử dụng các thuộc tính của loại ChartFormat trong các lớp ChartSeries, ChartDataPoint và ChartMarker, cũng như các bí danh cho một số thuộc tính, chẳng hạn như ForeColor, BackColor, Visible và Transparency trong lớp Stroke.
Ví dụ mã sau đây cho biết cách đặt màu chuỗi:
Document doc = new Document();
DocumentBuilder builder = new DocumentBuilder(doc);

Shape shape = builder.InsertChart(ChartType.Column, 432, 252);

Chart chart = shape.Chart;
ChartSeriesCollection seriesColl = chart.Series;

// Delete default generated series.
seriesColl.Clear();

// Create category names array.
string[] categories = new string[] { "AW Category 1", "AW Category 2" };

// Adding new series. Value and category arrays must be the same size.
ChartSeries series1 = seriesColl.Add("AW Series 1", categories, new double[] { 1, 2 });
ChartSeries series2 = seriesColl.Add("AW Series 2", categories, new double[] { 3, 4 });
ChartSeries series3 = seriesColl.Add("AW Series 3", categories, new double[] { 5, 6 });

// Set series color.
series1.Format.Fill.ForeColor = Color.Red;
series2.Format.Fill.ForeColor = Color.Yellow;
series3.Format.Fill.ForeColor = Color.Blue;

doc.Save(dir + "ColumnColor.docx");
Ví dụ mã sau đây cho thấy cách đặt màu và độ dày của dòng:
Document doc = new Document();
DocumentBuilder builder = new DocumentBuilder(doc);

Shape shape = builder.InsertChart(ChartType.Line, 432, 252);

Chart chart = shape.Chart;
ChartSeriesCollection seriesColl = chart.Series;

// Delete default generated series.
seriesColl.Clear();

// Adding new series.
ChartSeries series1 = seriesColl.Add("AW Series 1", new double[] { 0.7, 1.8, 2.6 },
	new double[] { 2.7, 3.2, 0.8 });
ChartSeries series2 = seriesColl.Add("AW Series 2", new double[] { 0.5, 1.5, 2.5 },
	new double[] { 3, 1, 2 });

// Set series color.
series1.Format.Stroke.ForeColor = Color.Red;
series1.Format.Stroke.Weight = 5;
series2.Format.Stroke.ForeColor = Color.LightGreen;
series2.Format.Stroke.Weight = 5;

doc.Save(dir + "LineColorAndWeight.docx");
Analyzing your prompt, please hold on...
An error occurred while retrieving the results. Please refresh the page and try again.