Analyzing your prompt, please hold on...
An error occurred while retrieving the results. Please refresh the page and try again.
Charts are visually appealing and make it easy for users to see comparisons, patterns, and trends in data. For instance, rather than analyzing columns of worksheet numbers, a chart shows at a glance whether sales are falling or rising, or how actual sales compare to projected sales. People are frequently asked to present statistical and graphical information in an easy‑to‑understand and easy‑to‑maintain manner. A picture helps.
Sometimes, charts are needed in an application or web pages. Or it might be needed for a Word document, a PDF file, a PowerPoint presentation, or some other application. In each case, you want to render the chart as an image so that you can use it elsewhere.
In the examples here, a pie chart and a column chart are converted to images.
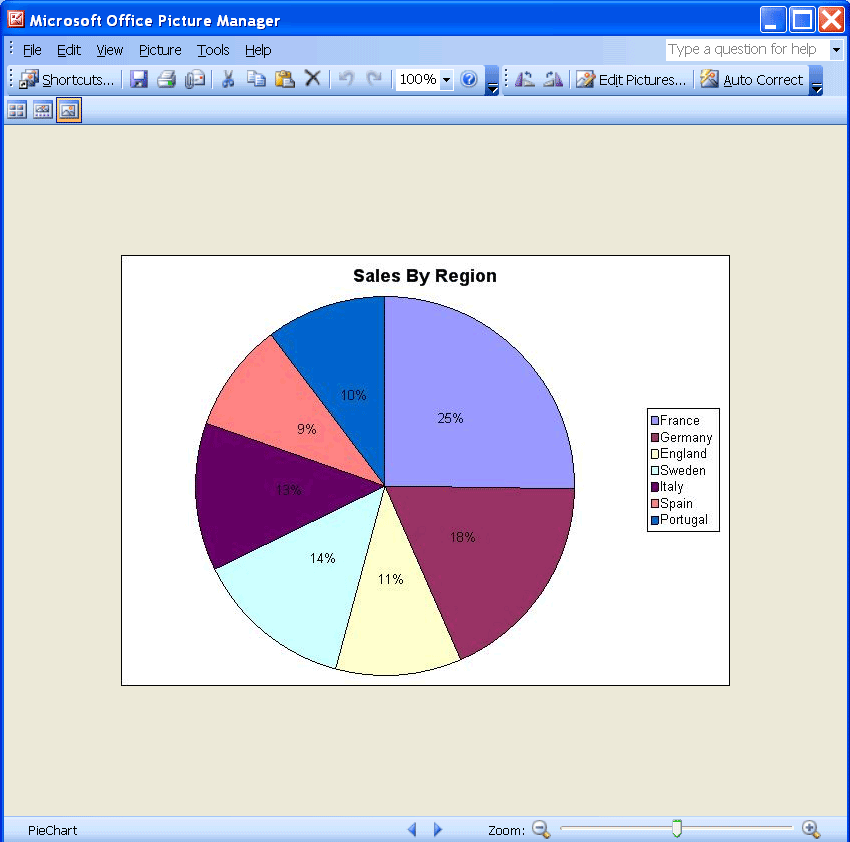
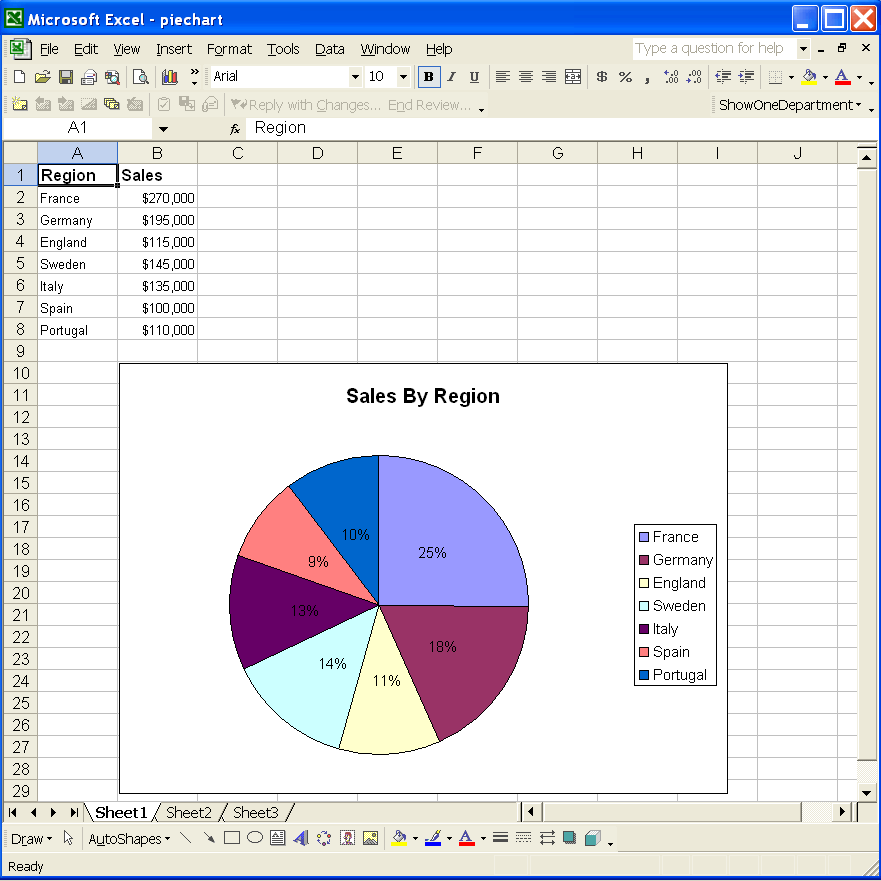
First, create a pie chart in Microsoft Excel and then convert it to an image file with Aspose.Cells for Python via .NET. The code in this example creates an EMF image based on the pie chart in the template Microsoft Excel file.
| Output: pie chart image |
|---|
 |
| The input file. |
|---|
 |
We host our Python packages in PyPI repositories.
Install Aspose.Cells for Python from PyPI using the command: $ pip install aspose-cells-python.
You can also follow the step‑by‑step instructions on how to install Aspose.Cells for Python via .NET to your developer environment.
$ pip install aspose-cells-python.All Aspose components work in evaluation mode when first installed. The evaluation mode has no time limit and it only injects watermarks into output documents.
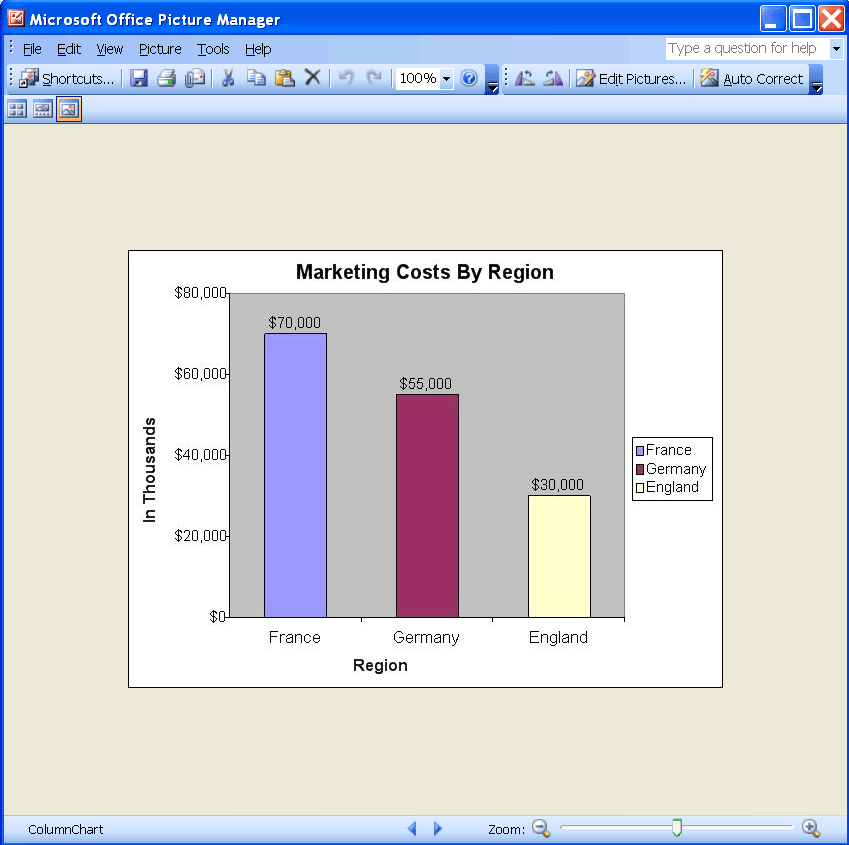
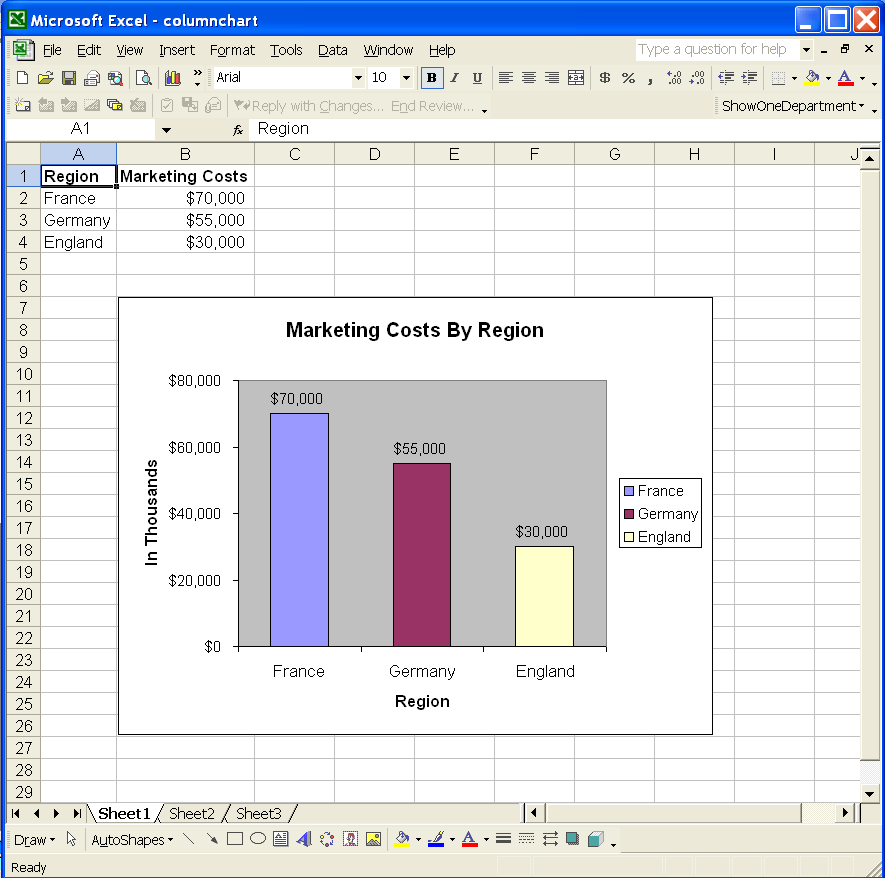
First, create a column chart in Microsoft Excel and convert it to an image file, as above. After executing the sample code, a JPEG file is created based on the column chart in the template Excel file.
| Output file: a column chart image. |
|---|
 |
| Input file. |
|---|
 |
Analyzing your prompt, please hold on...
An error occurred while retrieving the results. Please refresh the page and try again.