تخصيص نقاط البيانات في مخططات Treemap و Sunburst باستخدام C++
من بين الأنواع الأخرى لمخططات PowerPoint، هناك نوعان “هرميان” - Treemap و Sunburst chart (المعروف أيضًا باسم Sunburst Graph أو Sunburst Diagram أو Radial Chart أو Radial Graph أو Multi Level Pie Chart). تُظهر هذه المخططات البيانات الهرمية منظمةً على شكل شجرة - من الأوراق إلى أعلى الفرع. الأوراق تُحدد بنقاط بيانات السلسلة، ويُحدد كل مستوى تجميع متداخل لاحقًا بالفئة المقابلة. Aspose.Slides for C++ يتيح تنسيق نقاط البيانات لمخطط Sunburst وTreemap في C++.
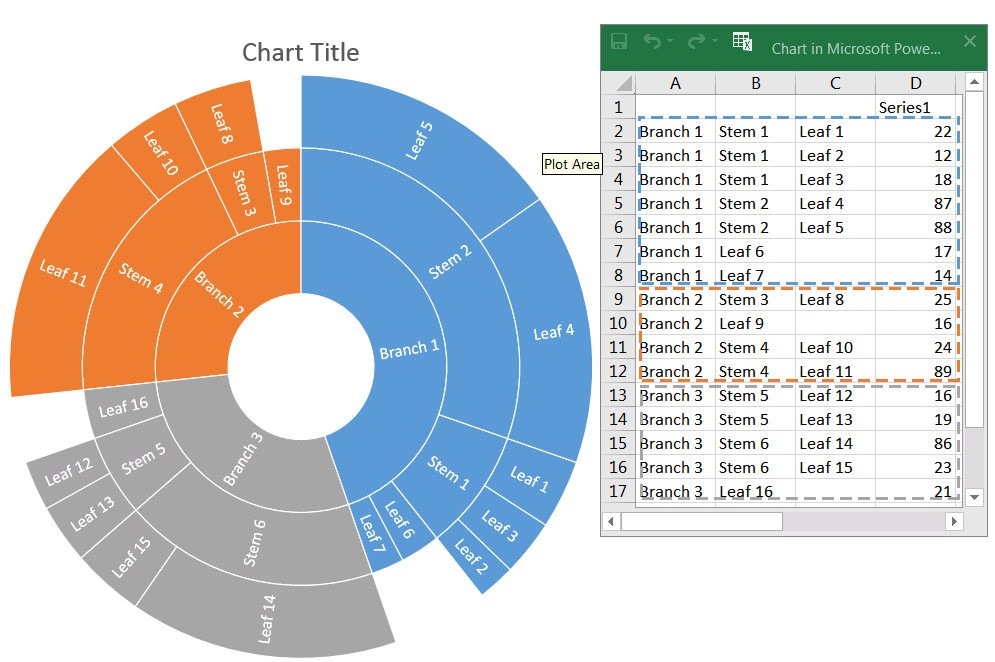
Here is a Sunburst Chart, where data in Series1 column define the leaf nodes, while other columns define hierarchical datapoints:
Let’s start with adding a new Sunburst chart to the presentation:
auto pres = System::MakeObject<Presentation>();
auto chart = pres->get_Slides()->idx_get(0)->get_Shapes()->AddChart(ChartType::Sunburst, 100.0f, 100.0f, 450.0f, 400.0f);
// ...
See also
If there is a need to format data points of the chart, we should use the following: IChartDataPointLevelsManager, IChartDataPointLevel classes and IChartDataPoint::get_DataPointLevels() method provide access to format data points of Treemap and Sunburst charts. IChartDataPointLevelsManager is used for accessing multi-level categories - it represents the container of IChartDataPointLevel objects. Basically it is a wrapper for IChartCategoryLevelsManager with the properties added specific for data points. IChartDataPointLevel class has two methods: get_Format() and get_Label() which provide access to corresponding settings.
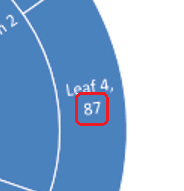
Show a Data Point Value
Show value of “Leaf 4” data point:
auto dataPoints = chart->get_ChartData()->get_Series()->idx_get(0)->get_DataPoints();
dataPoints->idx_get(3)->get_DataPointLevels()->idx_get(0)->get_Label()->get_DataLabelFormat()->set_ShowValue(true);
Set a Data Point Label and Color
Set “Branch 1” data label to show series name (“Series1”) instead of category name. Then set text color to yellow:
auto branch1Label = dataPoints->idx_get(0)->get_DataPointLevels()->idx_get(2)->get_Label();
branch1Label->get_DataLabelFormat()->set_ShowCategoryName(false);
branch1Label->get_DataLabelFormat()->set_ShowSeriesName(true);

branch1Label->get_DataLabelFormat()->get_TextFormat()->get_PortionFormat()->get_FillFormat()->set_FillType(FillType::Solid);
branch1Label->get_DataLabelFormat()->get_TextFormat()->get_PortionFormat()->get_FillFormat()->get_SolidFillColor()->set_Color(Color::get_Yellow());

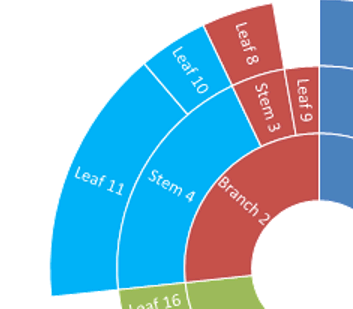
Set the Data Point Branch Color
Change color of “Stem 4” branch:
auto pres = System::MakeObject<Presentation>();
auto chart = pres->get_Slides()->idx_get(0)->get_Shapes()->AddChart(ChartType::Sunburst, 100.0f, 100.0f, 450.0f, 400.0f);
auto dataPoints = chart->get_ChartData()->get_Series()->idx_get(0)->get_DataPoints();

auto stem4branch = dataPoints->idx_get(9)->get_DataPointLevels()->idx_get(1);
stem4branch->get_Format()->get_Fill()->set_FillType(FillType::Solid);
stem4branch->get_Format()->get_Fill()->get_SolidFillColor()->set_Color(Color::get_Red());

pres->Save(u"pres.pptx", SaveFormat::Pptx);
FAQ
Can I change the order (sorting) of segments in Sunburst/Treemap?
No. PowerPoint sorts segments automatically (typically by descending values, clockwise). Aspose.Slides mirrors this behavior: you can’t change the order directly; you achieve it by preprocessing the data.
How does the presentation theme affect the colors of segments and labels?
Chart colors inherit the presentation’s theme/palette unless you explicitly set fills/fonts. For consistent results, lock in solid fills and text formatting at the required levels.
Will export to PDF/PNG preserve custom branch colors and label settings?
Yes. When exporting the presentation, chart settings (fills, labels) are preserved in the output formats because Aspose.Slides renders with the chart’s formatting applied.
Can I compute the actual coordinates of a label/element for custom overlay placement on top of the chart?
Yes. After the chart layout is validated, actual X and actual Y are available for elements (for example, a DataLabel), which helps with precise positioning of overlays.