
Formatear gráficos de presentación en JavaScript
Descripción general
Este artículo explica cómo formatear gráficos en presentaciones de PowerPoint utilizando Aspose.Slides. Muestra cómo personalizar los elementos clave del gráfico, como ejes, líneas de cuadrícula, títulos, leyendas, el área del trazado y los rellenos de paredes, para mejorar la apariencia y la legibilidad de los datos del gráfico.
También muestra cómo establecer propiedades de fuente para el texto del gráfico, aplicar formatos numéricos predefinidos a los datos del gráfico y habilitar esquinas redondeadas para el área del gráfico. En conjunto, estos ejemplos demuestran cómo controlar tanto el estilo visual como la presentación de datos de los gráficos en una presentación.
Formatear entidades del gráfico
Utilice Chart para formatear los títulos de los gráficos, ejes, líneas de cuadrícula, leyendas y el área del trazado. Este ejemplo crea un gráfico de líneas con marcadores y datos predeterminados, y luego aplica estilos de texto y de línea separados a sus ejes de valores y de categorías. Los tamaños de fuente y los anchos de línea se especifican en puntos; las etiquetas de categorías se rotan 45 grados.
El eje de valores utiliza setNumberFormat de forma independiente de las celdas de origen. Su escala va de -2 a 15, con intervalos principales de 2 e intervalos menores de 0,5. El ejemplo también combina el formato de porcentaje con setDisplayUnit configurado a miles, por lo que debe adaptar estos valores al significado y magnitud de sus datos. La leyenda permanece fuera del área del trazado porque setOverlay se llama con false. Los rellenos de la pared trasera y del suelo se configuran mediante getBackWall y getFloor, pero estas superficies solo son visibles en gráficos 3D.
const aspose = { slides: require("aspose.slides.via.java") };
const java = require("java");

let presentation = new aspose.slides.Presentation();
try {
    let slide = presentation.getSlides().get_Item(0);

    let chart = slide.getShapes().addChart(aspose.slides.ChartType.LineWithMarkers, 50, 50, 500, 400);

    chart.setTitle(true);
    chart.getChartTitle().addTextFrameForOverriding("");
    let chartTitle = chart.getChartTitle().getTextFrameForOverriding().getParagraphs().get_Item(0).getPortions().get_Item(0);
    chartTitle.setText("Sample Chart");
    chartTitle.getPortionFormat().getFillFormat().setFillType(java.newByte(aspose.slides.FillType.Solid));
    chartTitle.getPortionFormat().getFillFormat().getSolidFillColor().setColor(java.getStaticFieldValue("java.awt.Color", "GRAY"));
    chartTitle.getPortionFormat().setFontHeight(20);
    chartTitle.getPortionFormat().setFontBold(java.newByte(aspose.slides.NullableBool.True));
    chartTitle.getPortionFormat().setFontItalic(java.newByte(aspose.slides.NullableBool.True));

    chart.getAxes().getVerticalAxis().getMajorGridLinesFormat().getLine().getFillFormat().setFillType(java.newByte(aspose.slides.FillType.Solid));
    chart.getAxes().getVerticalAxis().getMajorGridLinesFormat().getLine().getFillFormat().getSolidFillColor().setColor(java.getStaticFieldValue("java.awt.Color", "BLUE"));
    chart.getAxes().getVerticalAxis().getMajorGridLinesFormat().getLine().setWidth(5);
    chart.getAxes().getVerticalAxis().getMajorGridLinesFormat().getLine().setDashStyle(java.newByte(aspose.slides.LineDashStyle.DashDot));

    chart.getAxes().getVerticalAxis().getMinorGridLinesFormat().getLine().getFillFormat().setFillType(java.newByte(aspose.slides.FillType.Solid));
    chart.getAxes().getVerticalAxis().getMinorGridLinesFormat().getLine().getFillFormat().getSolidFillColor().setColor(java.getStaticFieldValue("java.awt.Color", "RED"));
    chart.getAxes().getVerticalAxis().getMinorGridLinesFormat().getLine().setWidth(3);

    chart.getAxes().getVerticalAxis().setNumberFormatLinkedToSource(false);
    chart.getAxes().getVerticalAxis().setDisplayUnit(aspose.slides.DisplayUnitType.Thousands);
    chart.getAxes().getVerticalAxis().setNumberFormat("0.0%");

    chart.getAxes().getVerticalAxis().setAutomaticMajorUnit(false);
    chart.getAxes().getVerticalAxis().setAutomaticMaxValue(false);
    chart.getAxes().getVerticalAxis().setAutomaticMinorUnit(false);
    chart.getAxes().getVerticalAxis().setAutomaticMinValue(false);

    chart.getAxes().getVerticalAxis().setMaxValue(15);
    chart.getAxes().getVerticalAxis().setMinValue(-2);
    chart.getAxes().getVerticalAxis().setMinorUnit(0.5);
    chart.getAxes().getVerticalAxis().setMajorUnit(2.0);

    let valueAxisText = chart.getAxes().getVerticalAxis().getTextFormat().getPortionFormat();
    valueAxisText.setFontBold(java.newByte(aspose.slides.NullableBool.True));
    valueAxisText.setFontHeight(16);
    valueAxisText.setFontItalic(java.newByte(aspose.slides.NullableBool.True));
    valueAxisText.getFillFormat().setFillType(java.newByte(aspose.slides.FillType.Solid));
    valueAxisText.getFillFormat().getSolidFillColor().setPresetColor(java.newByte(aspose.slides.PresetColor.DarkGreen));
    valueAxisText.setLatinFont(new aspose.slides.FontData("Times New Roman"));

    chart.getAxes().getVerticalAxis().setTitle(true);
    chart.getAxes().getVerticalAxis().getTitle().addTextFrameForOverriding("");
    let valueAxisTitle = chart.getAxes().getVerticalAxis().getTitle().getTextFrameForOverriding().getParagraphs().get_Item(0).getPortions().get_Item(0);
    valueAxisTitle.setText("Primary Axis");
    valueAxisTitle.getPortionFormat().getFillFormat().setFillType(java.newByte(aspose.slides.FillType.Solid));
    valueAxisTitle.getPortionFormat().getFillFormat().getSolidFillColor().setColor(java.getStaticFieldValue("java.awt.Color", "GRAY"));
    valueAxisTitle.getPortionFormat().setFontHeight(20);
    valueAxisTitle.getPortionFormat().setFontBold(java.newByte(aspose.slides.NullableBool.True));
    valueAxisTitle.getPortionFormat().setFontItalic(java.newByte(aspose.slides.NullableBool.True));

    chart.getAxes().getHorizontalAxis().getMajorGridLinesFormat().getLine().getFillFormat().setFillType(java.newByte(aspose.slides.FillType.Solid));
    chart.getAxes().getHorizontalAxis().getMajorGridLinesFormat().getLine().getFillFormat().getSolidFillColor().setColor(java.newInstanceSync("java.awt.Color", 0, 128, 0));
    chart.getAxes().getHorizontalAxis().getMajorGridLinesFormat().getLine().setWidth(5);

    chart.getAxes().getHorizontalAxis().getMinorGridLinesFormat().getLine().getFillFormat().setFillType(java.newByte(aspose.slides.FillType.Solid));
    chart.getAxes().getHorizontalAxis().getMinorGridLinesFormat().getLine().getFillFormat().getSolidFillColor().setColor(java.getStaticFieldValue("java.awt.Color", "YELLOW"));
    chart.getAxes().getHorizontalAxis().getMinorGridLinesFormat().getLine().setWidth(3);

    let categoryAxisText = chart.getAxes().getHorizontalAxis().getTextFormat().getPortionFormat();
    categoryAxisText.setFontBold(java.newByte(aspose.slides.NullableBool.True));
    categoryAxisText.setFontHeight(16);
    categoryAxisText.setFontItalic(java.newByte(aspose.slides.NullableBool.True));
    categoryAxisText.getFillFormat().setFillType(java.newByte(aspose.slides.FillType.Solid));
    categoryAxisText.getFillFormat().getSolidFillColor().setColor(java.getStaticFieldValue("java.awt.Color", "BLUE"));
    categoryAxisText.setLatinFont(new aspose.slides.FontData("Arial"));

    chart.getAxes().getHorizontalAxis().setTitle(true);
    chart.getAxes().getHorizontalAxis().getTitle().addTextFrameForOverriding("");

    let categoryAxisTitle = chart.getAxes().getHorizontalAxis().getTitle().getTextFrameForOverriding().getParagraphs().get_Item(0).getPortions().get_Item(0);
    categoryAxisTitle.setText("Sample Category");
    categoryAxisTitle.getPortionFormat().getFillFormat().setFillType(java.newByte(aspose.slides.FillType.Solid));
    categoryAxisTitle.getPortionFormat().getFillFormat().getSolidFillColor().setColor(java.getStaticFieldValue("java.awt.Color", "GRAY"));
    categoryAxisTitle.getPortionFormat().setFontHeight(20);
    categoryAxisTitle.getPortionFormat().setFontBold(java.newByte(aspose.slides.NullableBool.True));
    categoryAxisTitle.getPortionFormat().setFontItalic(java.newByte(aspose.slides.NullableBool.True));

    chart.getAxes().getHorizontalAxis().setTickLabelPosition(aspose.slides.TickLabelPositionType.Low);
    chart.getAxes().getHorizontalAxis().setTickLabelRotationAngle(45);

    let legendText = chart.getLegend().getTextFormat().getPortionFormat();
    legendText.setFontBold(java.newByte(aspose.slides.NullableBool.True));
    legendText.setFontHeight(16);
    legendText.setFontItalic(java.newByte(aspose.slides.NullableBool.True));
    legendText.getFillFormat().setFillType(java.newByte(aspose.slides.FillType.Solid));
    legendText.getFillFormat().getSolidFillColor().setPresetColor(java.newByte(aspose.slides.PresetColor.DarkRed));

    chart.getLegend().setOverlay(false);

    chart.getBackWall().setThickness(1);
    chart.getBackWall().getFormat().getFill().setFillType(java.newByte(aspose.slides.FillType.Solid));
    chart.getBackWall().getFormat().getFill().getSolidFillColor().setColor(java.newInstanceSync("java.awt.Color", 255, 165, 0));

    chart.getFloor().getFormat().getFill().setFillType(java.newByte(aspose.slides.FillType.Solid));
    chart.getFloor().getFormat().getFill().getSolidFillColor().setColor(java.getStaticFieldValue("java.awt.Color", "RED"));

    chart.getPlotArea().getFormat().getFill().setFillType(java.newByte(aspose.slides.FillType.Solid));
    chart.getPlotArea().getFormat().getFill().getSolidFillColor().setPresetColor(java.newByte(aspose.slides.PresetColor.LightCyan));

    presentation.save("FormattedChart_out.pptx", aspose.slides.SaveFormat.Pptx);
} finally {
    presentation.dispose();
}
Establecer propiedades de fuente para un gráfico
Establezca el tamaño de fuente predeterminado para el texto del gráfico mediante Chart.getTextFormat. El ejemplo crea un gráfico de columnas agrupadas con una fuente de 20 puntos y habilita las etiquetas de valores para la primera serie mediante setShowValue. Los elementos de texto con sus propias configuraciones de fuente explícitas pueden sobrescribir el valor predeterminado del gráfico.
const aspose = { slides: require("aspose.slides.via.java") };

let presentation = new aspose.slides.Presentation();
try {
    let slide = presentation.getSlides().get_Item(0);

    let chart = slide.getShapes().addChart(aspose.slides.ChartType.ClusteredColumn, 100, 100, 500, 400);
    chart.getTextFormat().getPortionFormat().setFontHeight(20);
    chart.getChartData().getSeries().get_Item(0).getLabels().getDefaultDataLabelFormat().setShowValue(true);

    presentation.save("FontPropertiesForChart.pptx", aspose.slides.SaveFormat.Pptx);
} finally {
    presentation.dispose();
}
Establecer el formato numérico
Utilice ChartDataCell.setPresetNumberFormat para aplicar un formato numérico incorporado a las celdas del libro de trabajo del gráfico. Este ejemplo crea un gráfico de columnas agrupadas con datos predeterminados respaldados por celdas y aplica el índice de formato 10 (0.00%) a cada celda de valor de serie. Esto cambia la forma en que los valores se muestran en el libro sin modificar los números subyacentes; por ejemplo, 0.25 se muestra como 25,00 %. Los formatos de los ejes y de las etiquetas de datos pueden configurarse por separado.
const aspose = { slides: require("aspose.slides.via.java") };
const java = require("java");

let presentation = new aspose.slides.Presentation();
try {
    let slide = presentation.getSlides().get_Item(0);

    let chart = slide.getShapes().addChart(aspose.slides.ChartType.ClusteredColumn, 50, 50, 500, 400);
    let series = chart.getChartData().getSeries();

    for (let i = 0; i < series.size(); i++) {
        let chartSeries = series.get_Item(i);
        for (let j = 0; j < chartSeries.getDataPoints().size(); j++) {
            let dataPoint = chartSeries.getDataPoints().get_Item(j);
            dataPoint.getValue().getAsCell().setPresetNumberFormat(java.newByte(10)); // 0.00%
        }
    }

    presentation.save("PresetNumberFormat_out.pptx", aspose.slides.SaveFormat.Pptx);
} finally {
    presentation.dispose();
}
La tabla siguiente enumera los índices de formatos numéricos incorporados con formatos representativos de Excel para la configuración regional en inglés (Estados Unidos). Las cadenas de formato exactas y su visualización pueden variar según la aplicación y la configuración regional, particularmente para moneda y fechas. Algunos formatos de Excel también difieren de los valores predeterminados en el estándar OOXML, como se describe en Notas de implementación de formatos numéricos de Microsoft.
| Índice | Formato |
|---|---|
| 0 | General |
| 1 | 0 |
| 2 | 0.00 |
| 3 | #,##0 |
| 4 | #,##0.00 |
| 5 | "$"#,##0_);("$"#,##0) |
| 6 | "$"#,##0_);[Red]("$"#,##0) |
| 7 | "$"#,##0.00_);("$"#,##0.00) |
| 8 | "$"#,##0.00_);[Red]("$"#,##0.00) |
| 9 | 0% |
| 10 | 0.00% |
| 11 | 0.00E+00 |
| 12 | # ?/? |
| 13 | # ??/?? |
| 14 | m/d/yyyy |
| 15 | d-mmm-yy |
| 16 | d-mmm |
| 17 | mmm-yy |
| 18 | h:mm AM/PM |
| 19 | h:mm:ss AM/PM |
| 20 | h:mm |
| 21 | h:mm:ss |
| 22 | m/d/yyyy h:mm |
| 37 | #,##0_);(#,##0) |
| 38 | #,##0_);[Red](#,##0) |
| 39 | #,##0.00_);(#,##0.00) |
| 40 | #,##0.00_);[Red](#,##0.00) |
| 41 | _(* #,##0_);_(* (#,##0);_(* "-"_);_(@_) |
| 42 | _("$"* #,##0_);_("$"* (#,##0);_("$"* "-"_);_(@_) |
| 43 | _(* #,##0.00_);_(* (#,##0.00);_(* "-"??_);_(@_) |
| 44 | _("$"* #,##0.00_);_("$"* (#,##0.00);_("$"* "-"??_);_(@_) |
| 45 | mm:ss |
| 46 | [h]:mm:ss |
| 47 | mm:ss.0 |
| 48 | ##0.0E+0 |
| 49 | @ |
Establecer bordes redondeados del área del gráfico
Llame a Chart.setRoundedCorners con true para redondear las esquinas del área del gráfico. El ejemplo crea un gráfico de columnas agrupadas y utiliza getLineFormat para dar a su contorno un color gris sólido y un estilo de línea única antes de guardar la presentación.
const aspose = { slides: require("aspose.slides.via.java") };
const java = require("java");

let presentation = new aspose.slides.Presentation();
try {
    let slide = presentation.getSlides().get_Item(0);

    let chart = slide.getShapes().addChart(aspose.slides.ChartType.ClusteredColumn, 20, 100, 600, 400);
    chart.getLineFormat().getFillFormat().setFillType(java.newByte(aspose.slides.FillType.Solid));
    chart.getLineFormat().getFillFormat().getSolidFillColor().setColor(java.getStaticFieldValue("java.awt.Color", "GRAY"));
    chart.getLineFormat().setStyle(java.newByte(aspose.slides.LineStyle.Single));
    chart.setRoundedCorners(true);

    presentation.save("out.pptx", aspose.slides.SaveFormat.Pptx);
} finally {
    presentation.dispose();
}
Editar anotaciones de gráficos existentes
Un gráfico puede contener formas personalizadas, como una anotación de texto que explique el estado de un informe. Acceda a estas formas mediante Chart.getUserShapes. La colección devuelta por getShapes contiene las formas pertenecientes al gráfico.
Un cuadro de texto ordinario colocado sobre un gráfico pertenece a la diapositiva, aunque parezca parte del gráfico. Iterar a través de Slide.getShapes encuentra el gráfico y las formas normales de la diapositiva, pero no enumera las formas individuales dentro del gráfico. Los títulos de los gráficos y las etiquetas de datos son elementos de gráfico separados, no anotaciones personalizadas en esta colección.
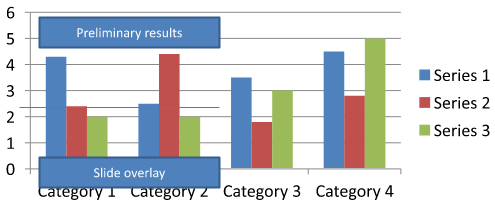
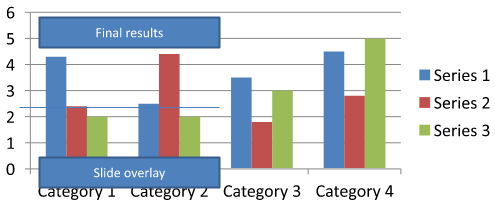
Descargue chart-annotations.pptx y colóquelo en el directorio de trabajo de la aplicación. Su primera diapositiva contiene un gráfico con una anotación sin agrupar que dice “Resultados preliminares”, una línea perteneciente al gráfico y un cuadro de texto ordinario de la diapositiva que dice “Superposición de diapositiva”. El ejemplo encuentra el primer gráfico en esa diapositiva y cambia la anotación a “Resultados finales” cuando el informe está listo para publicarse. Verifica si la colección está vacía y solo edita un AutoShape con un marco de texto no nulo devuelto por getTextFrame y el texto esperado.
const aspose = { slides: require("aspose.slides.via.java") };
const java = require("java");

let presentation = new aspose.slides.Presentation("chart-annotations.pptx");
try {
    let slide = presentation.getSlides().get_Item(0);

    let chart = null;
    for (let i = 0; i < slide.getShapes().size(); i++) {
        let shape = slide.getShapes().get_Item(i);
        if (java.instanceOf(shape, "com.aspose.slides.IChart")) {
            chart = shape;
            break;
        }
    }

    if (chart == null || chart.getUserShapes().getShapes().size() == 0) {
        console.log("No chart or chart-owned shapes found.");
    } else {
        let updated = false;
        for (let i = 0; i < chart.getUserShapes().getShapes().size(); i++) {
            let shape = chart.getUserShapes().getShapes().get_Item(i);
            if (java.instanceOf(shape, "com.aspose.slides.IAutoShape")) {
                let annotation = shape;
                if (annotation.getTextFrame() != null && annotation.getTextFrame().getText() === "Preliminary results") {
                    annotation.getTextFrame().setText("Final results");
                    updated = true;
                    break;
                }
            }
        }

        if (updated) {
            presentation.save("chart-annotations-updated.pptx", aspose.slides.SaveFormat.Pptx);
        } else {
            console.log("No matching text annotation found.");
        }
    }
} finally {
    presentation.dispose();
}
La línea y el cuadro de texto de la diapositiva permanecen sin cambios. Las siguientes imágenes muestran la entrada y el resultado guardado y vuelto a abrir:
| Antes de editar | Después de editar |
|---|---|
 |
 |
Note
El ejemplo inspecciona solo las formas de nivel superior pertenecientes al gráfico. Si una anotación está dentro de un GroupShape, inspeccione también la colección getShapes de ese grupo. Repita esto recursivamente para grupos anidados, aplicando las mismas comprobaciones de texto a sus formas hijas. Un grupo en sí es un contenedor; no lo trate como un cuadro de texto.Preguntas frecuentes
¿Puedo establecer rellenos semitransparentes para columnas/áreas manteniendo el borde opaco?
Sí. La transparencia del relleno y el contorno se configuran por separado. Esto es útil para mejorar la legibilidad de la cuadrícula y los datos en visualizaciones densas.
¿Cómo puedo manejar las etiquetas de datos cuando se superponen?
Reduzca el tamaño de la fuente, desactive los componentes de etiqueta no esenciales (por ejemplo, las categorías), ajuste la posición de la etiqueta, muestre etiquetas solo para los puntos seleccionados si es necesario, o cambie el formato a “valor + leyenda”.
¿Puedo aplicar rellenos de degradado o patrón a las series?
Sí. Las series admiten rellenos sólidos, de degradado y de patrón. En la práctica, use degradados con moderación y evite combinaciones que reduzcan el contraste con la cuadrícula y el texto.