Automating PowerPoint Generation in Python: Create Dynamic Presentations Easily
Introduction
Creating presentations manually becomes repetitive when their content changes frequently. Weekly reports, training materials, and client presentations often share a common structure but need new data for each delivery.
Aspose.Slides for Python via Java lets you generate these presentations from Python applications. You can integrate slide creation into web portals, scheduled jobs, and cloud workers, using data from databases, APIs, or uploaded files.
Common Use Cases for PowerPoint Automation in Python
- Business reports and dashboards: turn sales figures and performance metrics into charts and tables.
- Personalized sales presentations: populate slides with client-specific data while retaining a consistent design.
- Educational content: assemble lessons, quizzes, and course summaries from structured material.
- Data and AI-powered insights: use results from analytics or language-processing services as presentation content.
- Media-based slides: combine uploaded images or screenshots with explanatory text.
- Document workflows: map content extracted by other tools into presentation layouts.
- Developer tools: generate release summaries, technical overviews, or demonstrations from project data.
Prerequisites
Follow Installation to set up Python, Java, JPype, and Aspose.Slides. For cloud deployment, also review Slides on Cloud Platforms.
The example uses fixed business data so it can run without a database or external service. Replace these values with data from your application when integrating it into a report workflow.
Note
You can try the example without a license, but evaluation output includes a watermark and is subject to evaluation restrictions. See Evaluate Aspose.Slides for details and temporary license information.Build the Presentation
The complete script below creates one presentation containing four slides. Each step uses the same presentation, and the final step saves it as presentation.pptx.
Create a Title Slide
Use the initial slide in a new Presentation and apply the title layout. Fill its title and subtitle placeholders with the report heading and audience.

Add a Slide with a Column Chart
Add a blank slide and create a chart with ShapeCollection.addChart. Populate its embedded workbook with five regions and one sales series. The values remain editable in PowerPoint.

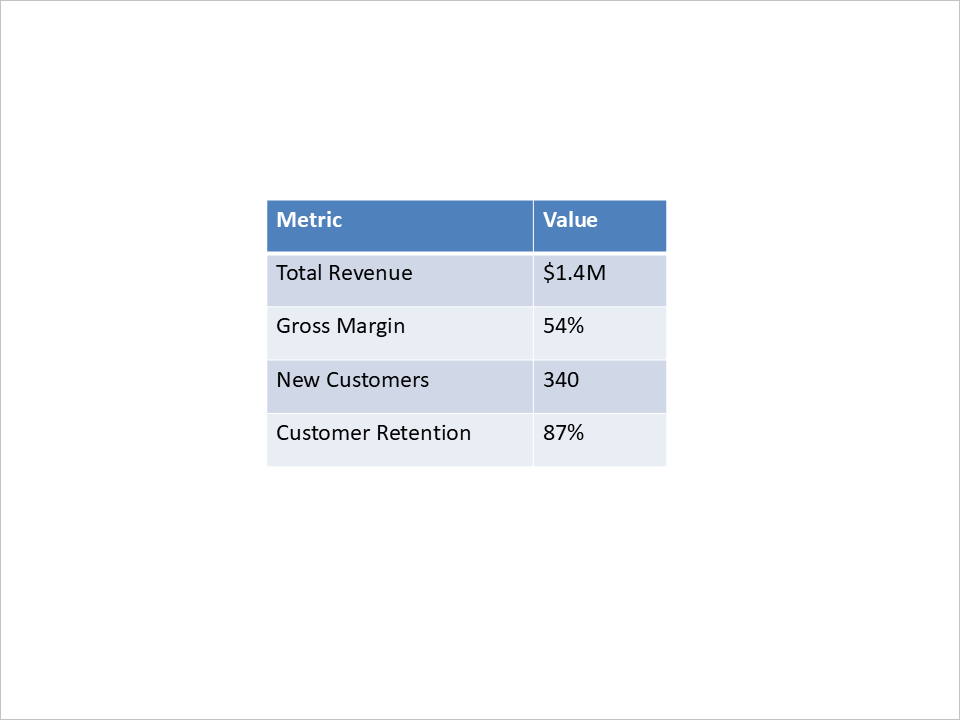
Add a Slide with a Table
Create a table with ShapeCollection.addTable and populate two columns with metric names and values. The example passes explicit Java arrays of doubles for column widths and row heights through JPype.
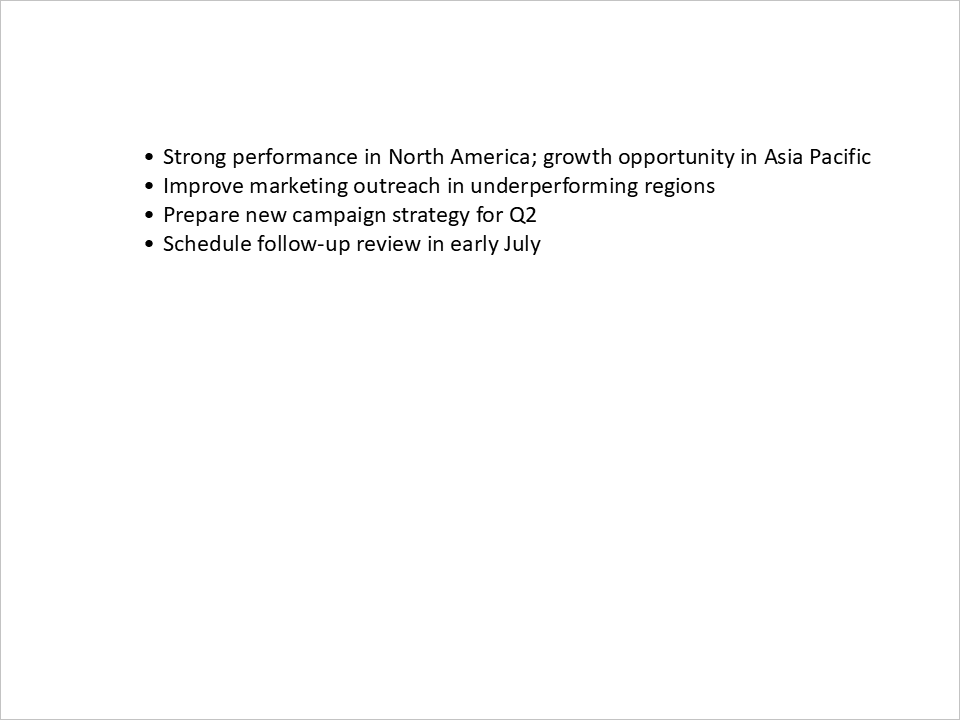
Add a Summary Slide with Bullet Points
Create a text shape and add a Paragraph for each action item. Apply a symbol bullet and black text to each paragraph, and remove the shape’s fill and outline.
Save the Presentation
Use Presentation.save to write the PowerPoint file. Release the presentation with Presentation.dispose in a finally block.
Complete Python Example
Save this script in a writable directory and run it with the Python environment configured above. It starts the JVM only if necessary and leaves it available until the process exits. For notebook and service usage, see JVM lifecycle guidance.
import jpype
import asposeslides
from jpype.types import JArray, JDouble

if not jpype.isJVMStarted():
    jpype.startJVM()

from asposeslides.api import BulletType, ChartType, FillType, LegendPositionType, Paragraph, Presentation, SaveFormat, ShapeType, SlideLayoutType
from java.awt import Color


def create_bullet_paragraph(text):
    paragraph = Paragraph()
    paragraph.getParagraphFormat().getBullet().setType(BulletType.Symbol)
    paragraph.getParagraphFormat().setIndent(15)
    paragraph.getParagraphFormat().getDefaultPortionFormat().getFillFormat().setFillType(FillType.Solid)
    paragraph.getParagraphFormat().getDefaultPortionFormat().getFillFormat().getSolidFillColor().setColor(Color.BLACK)
    paragraph.setText(text)
    return paragraph


presentation = Presentation()
try:
    # Create the title slide.
    title_slide = presentation.getSlides().get_Item(0)
    title_layout = presentation.getLayoutSlides().getByType(SlideLayoutType.Title)
    title_slide.setLayoutSlide(title_layout)
    title_shape = title_slide.getShapes().get_Item(0)
    subtitle_shape = title_slide.getShapes().get_Item(1)
    title_shape.getTextFrame().setText("Quarterly Business Review – Q1 2025")
    subtitle_shape.getTextFrame().setText("Prepared for Executive Team")

    # Add a chart slide.
    blank_layout = presentation.getLayoutSlides().getByType(SlideLayoutType.Blank)
    chart_slide = presentation.getSlides().addEmptySlide(blank_layout)
    chart = chart_slide.getShapes().addChart(ChartType.ClusteredColumn, 100, 100, 500, 350, False)
    chart.getLegend().setPosition(LegendPositionType.Bottom)
    chart.setTitle(True)
    chart.getChartTitle().addTextFrameForOverriding("Data from January – March 2025")
    chart.getChartTitle().setOverlay(False)

    workbook = chart.getChartData().getChartDataWorkbook()
    worksheet_index = 0
    sales = [("North America", 480), ("Europe", 365), ("Asia Pacific", 290), ("Latin America", 150), ("Middle East", 120)]
    for row_index, (region, amount) in enumerate(sales, start=1):
        category_cell = workbook.getCell(worksheet_index, row_index, 0, region)
        chart.getChartData().getCategories().add(category_cell)

    series_cell = workbook.getCell(worksheet_index, 0, 1, "Sales ($K)")
    series = chart.getChartData().getSeries().add(series_cell, chart.getType())
    for row_index, (region, amount) in enumerate(sales, start=1):
        value_cell = workbook.getCell(worksheet_index, row_index, 1, JDouble(amount))
        series.getDataPoints().addDataPointForBarSeries(value_cell)

    # Add a table slide.
    table_slide = presentation.getSlides().addEmptySlide(blank_layout)
    column_widths = JArray(JDouble)([200, 100])
    row_heights = JArray(JDouble)([40, 40, 40, 40, 40])
    table = table_slide.getShapes().addTable(200, 200, column_widths, row_heights)
    metrics = [("Metric", "Value"), ("Total Revenue", "$1.4M"), ("Gross Margin", "54%"), ("New Customers", "340"), ("Customer Retention", "87%")]
    for row_index, (metric, value) in enumerate(metrics):
        table.getColumns().get_Item(0).get_Item(row_index).getTextFrame().setText(metric)
        table.getColumns().get_Item(1).get_Item(row_index).getTextFrame().setText(value)

    # Add a summary slide.
    summary_slide = presentation.getSlides().addEmptySlide(blank_layout)
    bullet_list = summary_slide.getShapes().addAutoShape(ShapeType.Rectangle, 100, 50, 600, 200)
    bullet_list.getFillFormat().setFillType(FillType.NoFill)
    bullet_list.getLineFormat().getFillFormat().setFillType(FillType.NoFill)
    paragraphs = bullet_list.getTextFrame().getParagraphs()
    paragraphs.clear()
    action_items = ["Strong performance in North America; growth opportunity in Asia Pacific", "Improve marketing outreach in underperforming regions", "Prepare new campaign strategy for Q2", "Schedule follow-up review in early July"]
    for text in action_items:
        paragraph = create_bullet_paragraph(text)
        paragraphs.add(paragraph)

    presentation.save("presentation.pptx", SaveFormat.Pptx)
finally:
    presentation.dispose()
The illustrations show the corresponding slides from the Java example. Appearance can vary with the installed fonts and evaluation mode.
Use the Example in a Cloud Application
Fetch report data before building the presentation, then pass it to the chart, table, and text-generation steps. Use a separate output path for each job. After saving, your application can upload the file to object storage or return it as a download.
Keep the JVM running across jobs within the same worker process and release each presentation when its job finishes. Package the fonts required by your report design with the deployment to reduce differences between environments.
Conclusion
This example generates a complete business presentation from Python using editable charts, tables, and text. Replacing the sample data with application data makes the same approach useful for recurring reports, client presentations, and educational materials.
FAQ
Does the script require Microsoft PowerPoint or Excel?
No. Aspose.Slides creates the slides and the chart’s embedded workbook without either application.
Why does the table example use Java arrays?
The underlying method accepts arrays of Java doubles. Explicit arrays make the numeric types passed through JPype clear.
Can I save the same presentation as PDF or ODP?
Yes. Before disposing of it, save to another output filename with the corresponding SaveFormat value. See Supported File Formats for format-specific capabilities.
Can I use a branded template?
Yes. Load your template instead of creating an empty presentation, then adapt layout and placeholder selection to that template. The sample assumes the layouts and placeholder order of a new default presentation.