Tables in LaTeX
1. Introduction
Tables play an important role in enhancing the clarity, organization, and visual appeal of academic and professional documents. They serve as a powerful way to present complex data, comparisons, and relationships in a structured and easily digestible format. Here’s a brief overview of their importance:
Data Summarization: Tables provide a condensed representation of information that might otherwise require multiple paragraphs to explain. They allow authors to present large amounts of data concisely, making it easier for readers to understand key points.
Clear Visualization: Complex data, such as statistical figures, survey results, and experimental findings, can be presented more effectively using tables. The tabular format helps readers identify trends, patterns, and outliers much easier.
Comparative Analysis: Tables enable side-by-side comparisons of different sets of data. Whether it’s comparing product specifications, financial performance, or research variables, tables help readers draw meaningful conclusions at a glance.
Logical Organization: Tables provide a logical structure that segregates data into rows and columns. This organization facilitates the presentation of data that has distinct categories, allowing readers to easily navigate and find specific information.
Data Integrity: In academic and professional contexts, data accuracy is paramount. Tables allow authors to present raw data, eliminating the risk of misinterpretation that may arise when data is conveyed in narrative form.
References and Citations: When tables are well-labeled and properly referenced, they become valuable reference points within a document. Authors can refer to specific tables when discussing findings, making it easier for readers to follow the argument.
Visual Engagement: Well-designed tables break up the monotony of textual content, visually engage readers, and help keep them interested. They contribute to the overall aesthetics and professionalism of a document.
Efficiency in Communication: Busy professionals and researchers often need to extract information quickly. Tables allow them to view data and find specific details without having to read paragraphs of text.
Standardization: In academic research, standardized tables are frequently used to present experimental methodologies, results, and statistical analyses. This ensures consistency across publications and aids in the reproducibility of research.
In essence, tables serve as information hubs, efficiently presenting data-driven insights while maintaining a structured and reader-friendly format. Their role in conveying intricate details while ensuring clarity and accessibility makes them an indispensable tool in both academic and professional communication.
Let’s now turn to LaTeX as a powerful typesetting system that allows authors to transform their ideas into beautifully crafted documents. LaTeX transcends the limitations of traditional word processors, offering a realm of precision, elegance, and versatility that is very noticeable when processing tabular structures.
At its core, LaTeX is more than just a document preparation tool; it’s an art form that combines typography with technology. Whether you’re creating academic papers, reports, presentations, or even books, LaTeX excels in producing documents that are not only aesthetically pleasing but also convey information with utmost clarity. Its mastery lies, among other things, in its seamless integration of intricate tabular structures, which are the backbone of data representation in various fields.
With LaTeX, the arrangement of information within tables goes beyond a simple grid of rows and columns. Instead, it’s a carefully orchestrated symphony where alignment, spacing, and styling harmonize to provide a refined presentation of data. Tabular structures in LaTeX become visual narratives, conveying complex datasets, relationships, and comparisons with elegance and precision.
By offering plenty of tools and packages tailored to tabular design, LaTeX transforms data into visual storytelling. From controlling the width of columns to adjusting cell borders and shading, LaTeX’s level of customization ensures that each table aligns perfectly with your document’s purpose. For those working with mathematical, technical, or scientific content, LaTeX’s seamless inclusion of equations and symbols within table cells elevates the communication of complex ideas.
Nevertheless, the power of LaTeX extends beyond mere aesthetics. It introduces efficiency through cross-referencing mechanisms, making tables navigational landmarks within your document. Furthermore, LaTeX’s packages allow for the creation of complex layouts that span multiple rows or columns, accommodating the most demanding data presentations.
The deeper you delve into the world of LaTeX, the more nuanced features you explore; the features that make LaTeX an indispensable tool for scientists, professionals, and researchers alike. You dive into the art of designing tables that capture attention, present information persuasively, and contribute to the overall impact of your document.
2. Basics of Tables in LaTeX
The fundamental concept of tables in LaTeX revolves around the tabular environment, where you define columns, rows, and their content to organize and present data in a structured and visually pleasing format.
The basic structure of a table in LaTeX involves the following components:
Begin the
tabularEnvironment: To create a table, you enclose the table content within atabularenvironment. This environment specifies the layout and structure of the table.Column Specification: Within the
tabularenvironment, you define the number of columns and their alignment using column specifiers. Common specifiers includelfor left-aligned,cfor centered, andrfor right-aligned columns. You can also specify which columns LaTeX should separate with vertical lines and which vertical outer borders should be drawn.Row Content: Each row of the table is created by specifying the content for each cell within the row. Cells are separated by the
&symbol, and each row is terminated with the\\command.Horizontal Lines: You can add horizontal lines to separate rows, as well as horizontal outer borders, using the
\hlinecommand. This enhances the visual structure of the table.
Simple examples
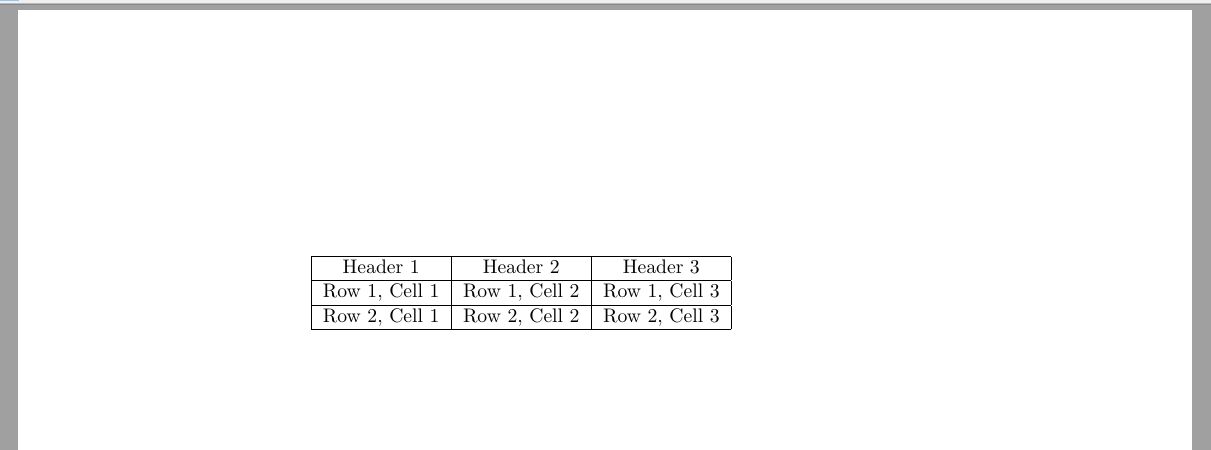
Here’s a basic example of a LaTeX table:
1\begin{tabular}{|c|c|c|}                             \hline
2    Header 1 & Header 2 & Header 3 \\                \hline
3    Row 1, Cell 1 & Row 1, Cell 2 & Row 1, Cell 3 \\ \hline
4    Row 2, Cell 1 & Row 2, Cell 2 & Row 2, Cell 3 \\ \hline
5\end{tabular}
In this example, the tabular environment is used to create a table with three columns, each centered (c). The result of typesetting is shown below:
The following example shows how to create a table with left and right aligned columns.
1\begin{tabular}{|l r||}
2  \hline
3  Company & Income \\            \hline \hline
4  Pinapple Computer & \$150M \\
5  Megasoft & \$210M \\
6  General Waters Ltd. & \$98M \\
7  Alphamet & \$2117M \\           \hline
8\end{tabular}
The right outer border is made double, the header is also separated from the table by a double line, there is no vertical line separating the columns.

You can also draw horizontal lines that don’t span the entire table from left to right.
1\begin{tabular}{|r|l|}         \hline
2  9D5 & hexadecimal \\
3  4725 & octal \\              \cline{2-2}
4  1001 1101 0101 & binary \\   \hline \hline
5  2517 & decimal \\            \hline
6\end{tabular}
Here, the \cline{i-j} command tells LaTeX to draw a line from the ith column to the jth column.

Columns in a table may have a fixed width, in which case they are called paragraph columns. To create such columns, you use the p specifier followed by the column width in braces. Consider the following example:
1\begin{tabular}{|p{3cm}|p{2cm}|}            \hline
2  A short text. & A very very long text. \\ \hline
3  A very very long text. \newline And some more text in a new line. & A short text. \\ \hline
4\end{tabular}
Note the use of the \newline command.

With the array package included, two more options are available for fixed-width columns: m{width} - same as p{width}, but vertically aligns the cell content in the middle;
b{width} - same as p{width}, but vertically aligns the cell content at the bottom.
In the rare case that a table needs to be included in the text of a paragraph, you may specify the position of the table relative to the baseline of the enclosing text line. For this purpose, you use the t, c (default), or b option to align the baseline to the top, center, or bottom of the table. For example,
1This is the text of the paragraph
2\begin{tabular}[t]{|r|l|}     \hline
3  9D5 & hexadecimal \\
4  4725 & octal \\             \cline{2-2}
5  1001 1101 0101 & binary \\  \hline \hline
6  2517 & decimal \\           \hline
7\end{tabular}
8that include a table.
Here we tell LaTeX that the baseline should align to the bottom of the table.

Defining multiple columns
When your table contains identically aligned columns, you may define them all at ones using the *{num}{format} syntax. This is especially useful when your table has many columns.
1\begin{tabular}{l*{7}{c}r}
2  Employee   & Sun & Mon & Tue & Wed & Thu & Fri & Sat & Total \\ \hline
3  John Doe   &     &  x  &     &     &     &  x  &     &   2   \\
4  Dean Jones &  x  &     &  x  &     &  x  &     &     &   3   \\
5  Chris Cross&     &     &     &  x  &     &     &     &   1   \\
6  Pete Brad  &     &     &     &     &     &     &  x  &   1
7\end{tabular}
Column specification using >{\commmand} and <{\command}
Another way to specify columns is to use >{\command} for commands executed right before each column element and <{\command} for commands executed right after each column element. This is available when you have the array package included in the document preamble. In the following example, we use this syntax to center each of two columns and to type the first one in bold face.
1\begin{tabular}{>{\centering\textbf\bgroup}p{3.5cm}<{\egroup}>|{\centering}p{3.5cm} }
2  History & Geometry
3  \tabularnewline \hline
4  Ancient & Elementary
5  \tabularnewline
6  Medieval & Affine
7  \tabularnewline
8  Modern & Analytic
9\end{tabular}
3. Customizing Table Layout
In LaTeX tables, adjusting spacing is crucial to ensure that the table appears well-structured and visually appealing. Proper spacing enhances readability and prevents crowding of content. Here are some key aspects of spacing adjustment in LaTeX tables:
Inter-column spacing
LaTeX automatically adds some space between columns. To adjust the inter-column space, you can use the \setlength{\tabcolsep}{value} command before the tabular environment. Increasing the value increases the space between columns. The default value is 6pt.
Inter-row spacing
To increase the space between rows, you can use the \renewcommand{\arraystretch}{value} command before the tabular environment. Increasing the value stretches the rows apart, enhancing the table’s vertical spacing. The default value is 1.0.
You may also specify the skip after a line explicitly using glue after the line terminator.
1\begin{tabular}{cl} \hline
2  Level & Complexity \\ [1cm]
3  1 & Simple \\
4  2 & Intermediate \\
5  3 & Complex \\ \hline
6\end{tabular}
Using @ and ! expressions
Having the array package included in the document preamble, you can specify column separators with the @{...} or !{...} constructs.
They typically take some text as its argument, and when appended to a column, they automatically insert that text into each cell in that column before and/or after the actual data for that cell. The @{...} command replaces the inter-column space with the content specified as the argument. By leaving the argument empty, you may suppress the inter-column spaces.
Let’s take a basic table specified by the following code:
1\begin{tabular}{|l|l|}
2  \hline
3  1.1 & 1.2 \\ \hline
4  2.1 & 2.2 \\
5  \hline
6\end{tabular}
By varying the column description, we get the following results:

To preserve the initial spacing, you may use !{...}.

And here is an example of a column of floating point numbers aligned to the decimal point:
1\begin{tabular}{r@{.}l}
2  3 & 14159 \\
3  16 & 2 \\
4  123 & 456 \\
5\end{tabular}
Using the dcolumn package
It is possible to center a column on the decimal separator using the dcolumn package, which provides a new column specifier for floating point numbers. The simple way to use this package is demonstrated in the following example:
1\usepackage{dcolumn}
2................................................
3\newcolumntype{d}[1]{D{.}{\cdot}{#1} } %the argument for d specifies the maximum number of decimal places
4\begin{tabular}{l r c d{1} }
5  Left&Right&Center&\mathrm{Decimal}\\
6  1&2&3&4\\
7  11&22&33&44\\
8  1.1&2.2&3.3&4.4\\
9\end{tabular}
Note that a decimal-aligned column is typeset in math mode, hence the use of \mathrm for the column heading in the example above. Also, text in a decimal-aligned column (for example, the header) will be right-aligned before the decimal separator (assuming there’s no decimal separator in the text). While this may be fine for very short text, or numeric column headings, it looks cumbersome in the example above. A solution to this is to use the \multicolumn command described below, specifying a single column and its alignment. For example, to center the header Decimal over its column in the above example, the first line of the table itself would be Left&Right&Center&\multicolumn{1}{c}{Decimal}\\.
4. Merging cells
A slightly more complex table can be obtained by merging cells horizontally and/or vertically.
Cells spanning multiple columns
The general form of the command that makes a cell span over multiple columns is: \multicolumn{num_cols}{alignment}{contents}. Here, num_cols is the number of columns to merge; alignment is either l, c, r, or, to have text wrapping, p{width}. And contents is the data you want to put in that cell.
Here is the simple example:
 1\begin{tabular}{|l|l|}
 2  \hline
 3  \multicolumn{2}{|c|}{Available currencies} \\
 4  \hline
 5  CNY & Chinese Yuan \\
 6  JPY & Japanese Yen \\
 7  GBP & Great Britain Pound \\
 8  USD & US Dollar \\
 9  CAD & Canadian Dollar \\
10  EUR & Euro \\
11  \hline
12\end{tabular}
Cells spanning multiple rows
To make a cell span multiple rows, you will need to include the multirow package. The package provides the following command: \multirow{num_rows}{width}{contents}.
Here, num_rows is the number of rows to merge; width is the cell width (* for the natural width of the content), and contents is the actual data to be typeset in the cell.
 1\begin{tabular}{|l|l|l|}
 2  \hline
 3  \multicolumn{3}{ |c| }{Available currencies} \\
 4  \hline
 5  South America & BRL & Brazilian Real \\ \hline
 6  \multirow{3}{*}{Asia} & CNY & Chinese Yuan \\
 7   & JPY & Japanese Yen \\
 8   & HKD & Hong Kong Dollar \\ \hline
 9  \multirow{3}{*}{Europe} & EUR & Euro \\
10   & GBP & Great Britain Pound \\
11   & CHF & Swiss Franc \\ \hline
12  Oceania & AUD & Australian Dollar \\ \hline
13  \multirow{2}{*}{North America} & USD & US Dollar \\
14   & CAD & Canadian Dollar \\
15  \hline
16\end{tabular}
You need to remember that when using the \multirow command, you must insert a blank entry for each appropriate cell in each subsequent row to be spanned.
Spanning cells in both directions
The following example demonstrates how to span cells in both directions simultaneously and get borders drawn correctly:
 1\begin{tabular}{cc|c|c|c|c|l}
 2  \cline{3-6}
 3  & & \multicolumn{4}{ c| }{Primes} \\ \cline{3-6}
 4  & & 2 & 3 & 5 & 7 \\ \cline{1-6}
 5  \multicolumn{1}{ |c }{\multirow{2}{*}{Powers} } &
 6    \multicolumn{1}{ |c| }{504} & 3 & 2 & 0 & 1 & \\ \cline{2-6}
 7  \multicolumn{1}{ |c }{} &
 8    \multicolumn{1}{ |c| }{540} & 2 & 3 & 1 & 0 & \\ \cline{1-6}
 9  \multicolumn{1}{ |c }{\multirow{2}{*}{Powers} } &
10    \multicolumn{1}{ |c| }{gcd} & 2 & 2 & 0 & 0 & min \\ \cline{2-6}
11  \multicolumn{1}{ |c }{} &
12    \multicolumn{1}{ |c| }{lcm} & 3 & 3 & 1 & 1 & max \\ \cline{1-6}
13\end{tabular}
The command \multicolumn{1}{ is used to draw both vertical left and right borders. Although it is combined with \multirow{2}{*}{...}, it still draws vertical borders that only span the first row. To compensate for that, we add \multicolumn{1}{ in the following rows spanned by the mutltirow.

5. Table Size
The graphicx package provides the command \resizebox{width}{height}{object} that can be used with the tabular environment to stretch or shrink a table to a specified width and height. In the following example, we’re resizing the table to 12cm width while maintaining the aspect ratio.
1\resizebox{12cm}{!} {
2  \begin{tabular}{|c|c|c|}                           \hline
3    Header 1 & Header 2 & Header 3 \\                \hline
4    Row 1, Cell 1 & Row 1, Cell 2 & Row 1, Cell 3 \\ \hline
5    Row 2, Cell 1 & Row 2, Cell 2 & Row 2, Cell 3 \\ \hline
6  \end{tabular}
7}
You can also use \scalebox{ratio}{object} in the same way, but with ratios instead of fixed size:
1\scalebox{0.7}{
2  \begin{tabular}...
3  \end{tabular}
4}
6. Positioning Tables
You can easily position a table on a page if you place it inside a table environment.
1\begin{table}[positioning_option]
2  \centering
3  \begin{tabular}{...}
4    ...
5  \end{tabular}
6\end{table}
Available positioning options are:
h - will place the table here approximately.
t - positions the table at the top of the page.
b - positions the table at the bottom of the page.
p - put the table in a special page (for tables only).
! - override internal LaTeX parameters.
H - place the table at this precise location (pretty much like h!).
To center a table horizontally, you can precede the tabular environment with the \centering command within a table environment.
7. Captions, Labels and References
You can caption a table with some text. In the output, the text will be prefixed with Table N., where N is the appropriate table number automatically tracked by LaTeX. To do so, use the \caption command. It is also possible to assign a label to a table so that the table can be referenced from anywhere across the document. The corresponding pair of commands is \label and \ref. Consider the following example:
 1Table \ref{table:1} is an example of a referenced \LaTeX{} element.
 2
 3\begin{table}[h!]
 4  \centering
 5  \begin{tabular}{|c|c|c|} \hline
 6    Header 1 & Header 2 & Header 3 \\                \hline
 7    Row 1, Cell 1 & Row 1, Cell 2 & Row 1, Cell 3 \\ \hline
 8    Row 2, Cell 1 & Row 2, Cell 2 & Row 2, Cell 3 \\ \hline
 9  \end{tabular}
10  \caption{A caption for the table.}
11  \label{table:1}
12\end{table}
Here, the reference in the first line will be automatically replaced with the number set by the \label command.

8. Coloring Tables
Altering colors in table rows
The xcolor package provides the necessary commands to produce tables with alternate row colors. The package must be loaded with the table option: \usepackage{table]{xcolor}.
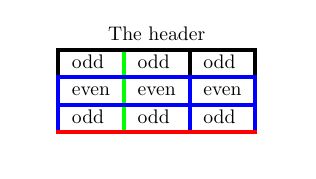
The command \rowcolors{starting_row}{odd_color}{even_color} must occur before the tabular environment starts.
 1\begin{center}
 2  \rowcolors{2}{green}{pink}
 3
 4  \begin{tabular}{lll}
 5    \multicolumn{3}{c}{The header} \\
 6    odd & odd & odd \\
 7    even & even & even\\
 8    \hiderowcolors odd & odd & odd \\
 9    \showrowcolors even & even & even\\
10     even & even & even\\
11  \end{tabular}
12\end{center}
The command \hiderowcolors, provided by the xcolor package, deactivates highlighting starting from the row it occurs on to the end of the table. To reactivate highlighting, use the \showrowcolors command.

Coloring individual cells
With xcolor package, you can also specify the color of a particular cell.
 1\begin{tabular}{|l|l|l|}
 2  \multicolumn{3}{c}{The header} \\
 3  \hline
 4  \cellcolor{red} odd & odd & odd \\
 5  \hline
 6  even & \cellcolor{red} even & even\\
 7  \hline
 8  odd & odd & \cellcolor{red} odd \\
 9  \hline
10\end{tabular}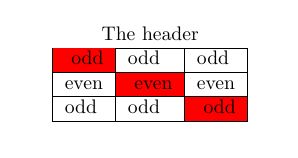
Using the colortbl package
The colortbl package provides the \columncolor command to specify the column color in the preamble of a tabular environment within the >{...} construct. This means that you must also have the array package included. (Don’t forget to also include the xcolor package.)
1\begin{tabular}{|>{\columncolor{green}}l|>{\color{white}\columncolor{red}}c|}
2  one & two\\
3  three & four
4\end{tabular}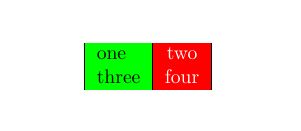
The \rowcolor command can be used to specify the row colors. It must be used at the start of the row. The command has the same syntax as \columncolor.
1\begin{tabular}{l|c|}
2  \rowcolor{green} one & two\\
3  \rowcolor{red} three & four
4\end{tabular}
You can also color vertical rules. For example,
1\setlength{\arrayrulewidth}{2pt}
2\begin{tabular}{!{\color{blue}\vline} l !{\color{blue}\vline} l !{\color{blue}\vline}
3    l !{\color{blue}\vline}}
4  \multicolumn{3}{c}{The header} \\
5  odd & odd & odd \\
6  even & even & even\\
7  odd & odd & odd \\
8\end{tabular}
will result in
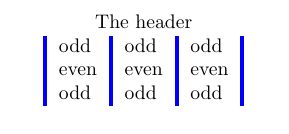
Note the use of \setlength{\arrayrulewidth}{2pt} for changing the rule thickness.
However, coloring \hline and \cline is a bit trickier and is available with extra commands (which then apply to vertical rules as well). The \arrayrulecolor command may be used globally or within a table. In both cases, it affects all subsequent rules. Therefore, if you want a different color for vertical rules, you should specify it in the table preamble. For example,
 1\setlength\arrayrulewidth{2pt}
 2%\arrayrulecolor{blue} % to set the color for all rules
 3\begin{tabular}{|l!{\color{green}\vline}l|l|}
 4  \multicolumn{3}{c}{The header} \\
 5  \hline
 6  odd & odd & odd \\
 7  \arrayrulecolor{blue} \hline
 8  even & even & even\\
 9  \hline
10  odd & odd & odd \\ \arrayrulecolor{red}
11  \hline
12\end{tabular}
will result in
9. Building Long Tables
The tabular environment has one significant disadvantage. It produces tables that cannot be split between pages with the TeX’s built-in page breaking algorithm. Thus, if your table is long, it will just spread below the page bottom.
Happily, there is the longtable package, nowadays provided in most distributions, which defines the longtable environment for handling such long tables. In most respects, this environment works in the same way as the tabular environment. There are some differences, though.
We will demonstrate most of the longtable’s features in the following example, where you can also find usage notes and differences from the tabular environment. (The example also uses the verbatim package for some text formatting, so it must also be included.)
 1\begin{longtable}{|r||p{1in}|}
 2  \caption[An optional table caption ...]{A long table\label{long}}\\
 3  \hline\hline
 4  \multicolumn{2}{|c|}{This part appears at the top of the table}\\
 5  \textsc{First}&\textsc{Second}\\
 6  \hline\hline
 7  \endfirsthead % Everything above this command will appear at the beginning of the table, in the first page.
 8
 9  \caption[]{(continued)}\\
10  \hline\hline
11  \multicolumn{2}{|c|}{This part appears at the top of every other page}\\
12  \textbf{First}&\textbf{Second}\\
13  \hline\hline
14  \endhead % Whatever you put before this command and below \endfirsthead will be displayed at the top of the table in every page except the first one.
15
16  \hline
17  This goes at the&bottom.\\
18  \hline
19  \endfoot % What you put after \endhead and before this command will appear at the bottom of the table in every page except the last one.
20
21  \hline
22  These lines will&appear\\
23  in place of the & usual foot\\
24  at the end& of the table\\
25  \hline
26  \endlastfoot % The elements after \endfoot and before this command will be displayed at the bottom of the table but only in the last page where the table appears.
27
28  \texttt{longtable} columns are specified& in the \\
29  same way as in the \texttt{tabular}& environment.\\
30  \verb!|r||p{1in}|! & inthis case. \\
31  Each row ends with a & \verb|\\| command. \\
32  The \verb|\\| command has an & optional \\
33  argument, just as in & the \\
34  \texttt{tabular} & environment. \\ [10pt]
35  See the effect of \verb|\\[10pt]| & ? \\
36  Lots of lines & like this. \\
37  Lots of lines & like this. \\
38  Lots of lines & like this. \\
39  Also \verb|\hline| may be used, & as in \texttt{tabular}. \\
40  \hline
41  That was a \verb|\hline| & . \\
42  \hline\hline
43  That was a \verb|\hline\hline| & . \\
44  \multicolumn{2}{||c||}
45    {This is a \texttt{\textbackslash multicolumn\{2\}\{||c||\}}} \\
46  If a page break occurs at a \verb|\hline| then & a line is drawn \\
47  at the bottom of one page and at the & top of the next. \\
48  \hline
49  The \texttt{[t] [b] [c]} argument of \texttt{tabular} & cannot be used. \\
50  The optional argument may be one of & \texttt{[l] [r] [c]} \\
51  to specify whether the table should be & adjusted \\
52  to the left, right, & or centrally. \\
53  \hline\hline
54  Lots of lines & like this. \\
55  Lots of lines & like this. \\
56  Lots of lines & like this. \\
57  Lots of lines & like this. \\
58  Lots of lines & like this. \\
59  Lots of lines & like this. \\
60  Lots of lines & like this. \\
61  Lots of lines & like this. \\
62  Lots of lines & like this. \\
63  Lots of lines & like this. \\
64  Lots of lines & like this. \\
65  Lots of lines & like this. \\
66  Lots of lines & like this. \\
67  Lots of lines & like this. \\
68  Lots of lines & like this. \\
69  Lots of lines & like this. \\
70  Lots of lines & like this. \\
71  Lots of lines & like this. \\
72  Some lines may take up a lot of space, like this: &
73  \raggedleft This last column is a ``p'' column so this ``row'' of the table can take
74  up several lines. Note however that \TeX will never break a page within such a row.
75  Page breaks only occur between rows of the table or at \verb|\hline| commands.
76  \tabularnewline
77  Lots of lines & like this.\\
78  Lots of lines & like this.\\
79  Lots of lines & like this.\\
80  Lots of lines & like this.\\
81  Lots of lines & like this.\\
82  Lots of lines & like this.\\
83  \hline
84  Lots of lines& like this.\\
85  Lots of lines& like this.\\
86\end{longtable}
This will result in two pages:
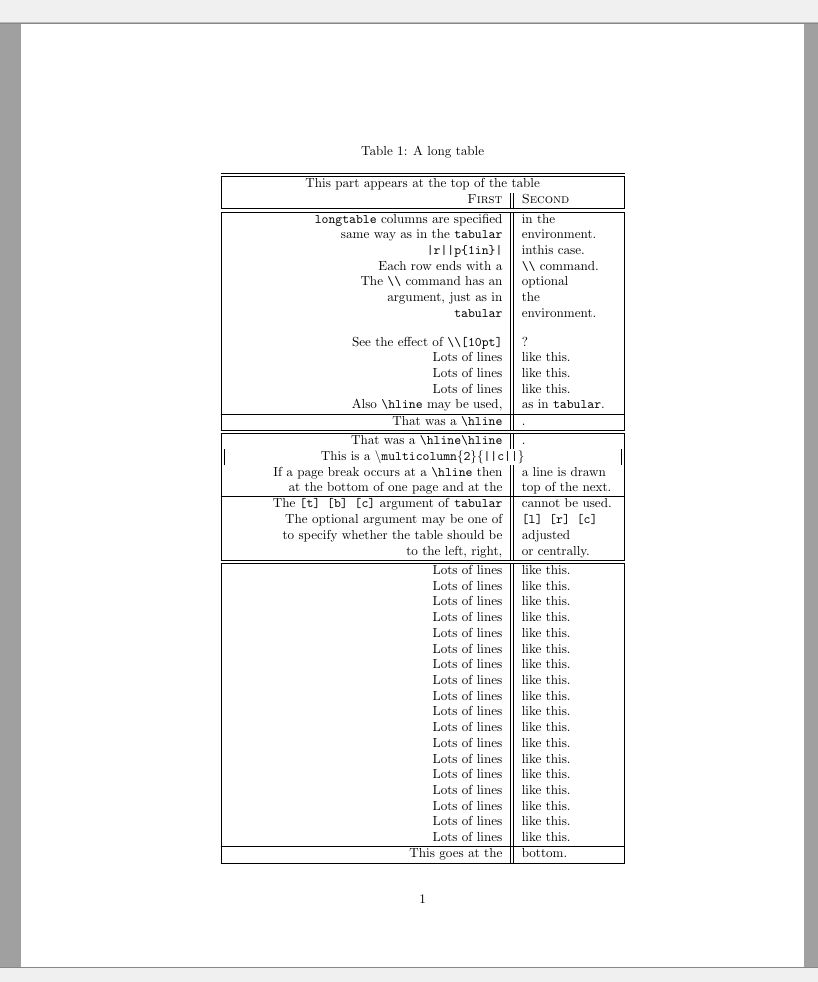
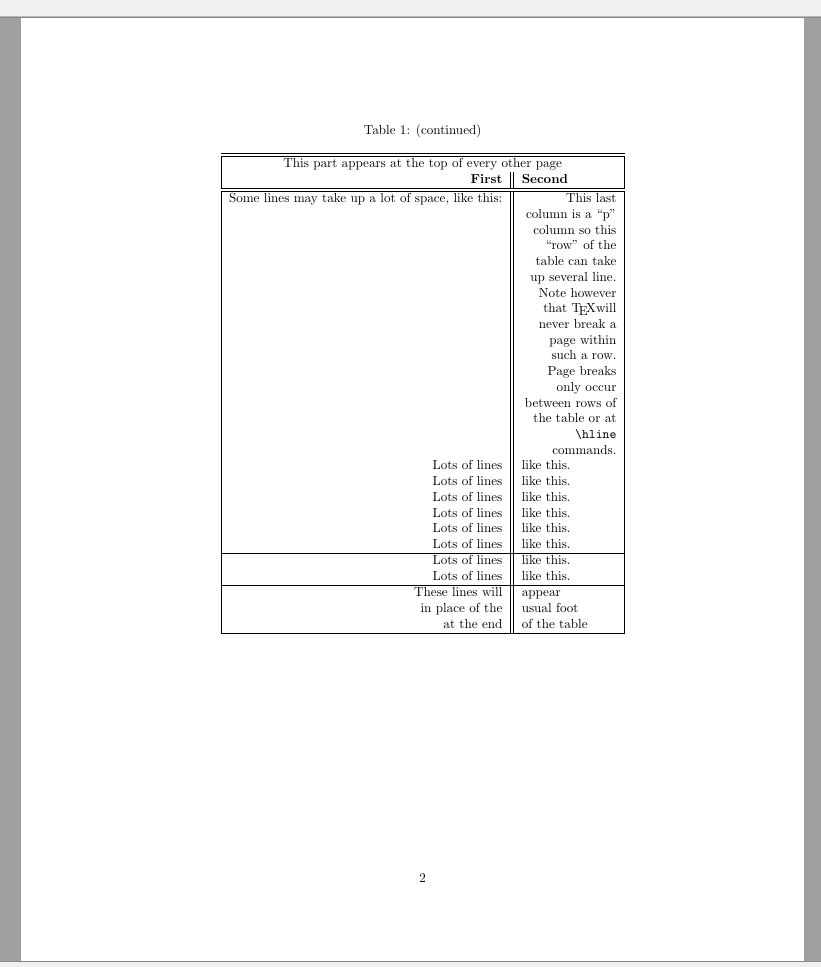
Don’t be confused if you don’t get the same result after the first run of TeX. Due to the technical limitations of TeX, it may take a few runs to get the table you see in the images.
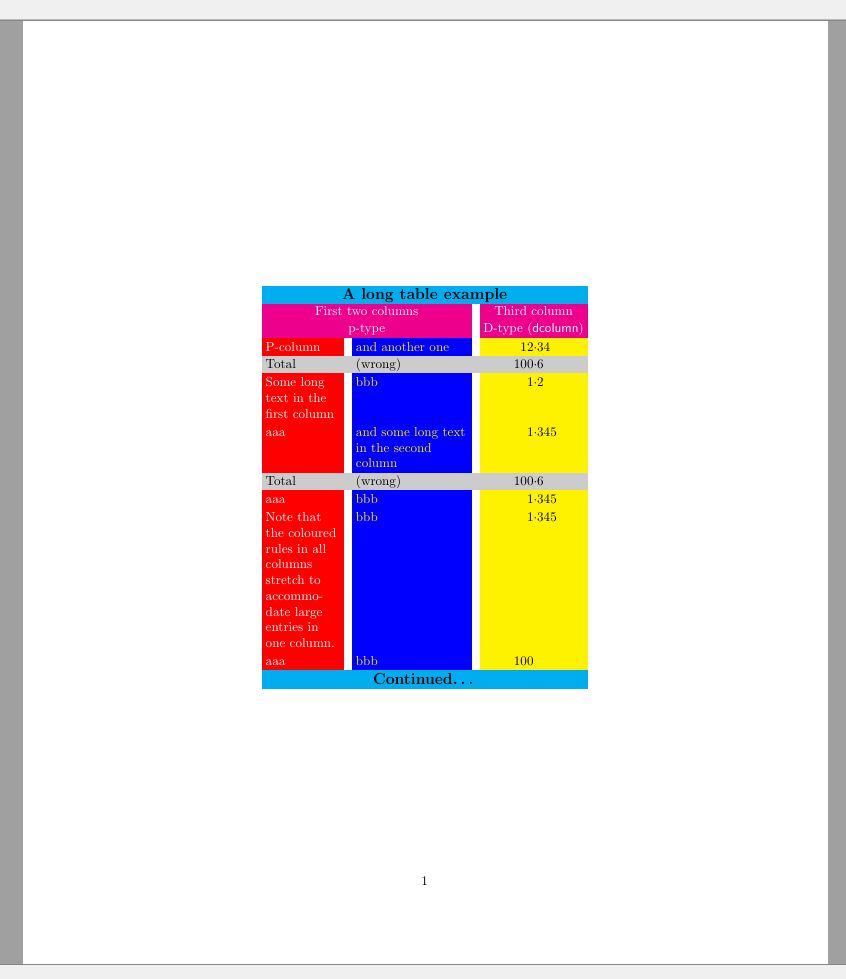
10. A Complex Table Example
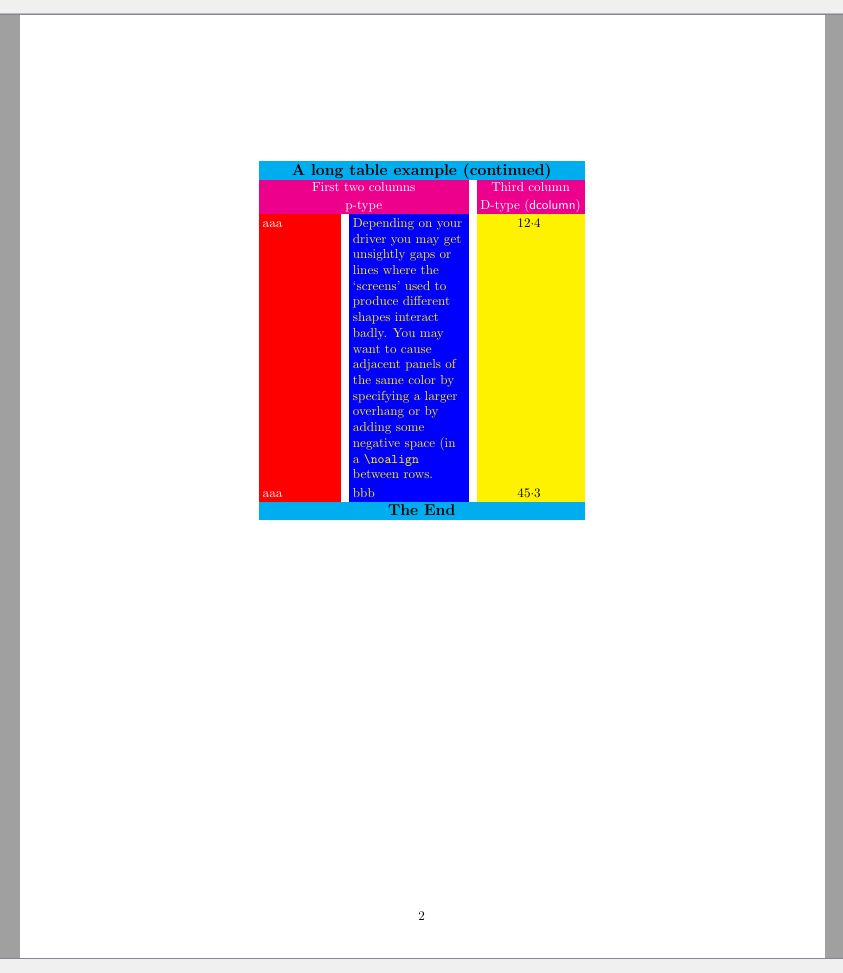
We will provide one more rather complex example of a table that combines many of the above features.
 1\documentclass{article}
 2  \usepackage{dcolumn}
 3  \usepackage{verbatim}
 4  \usepackage{colortbl}
 5  \usepackage[table]{xcolor}
 6  \usepackage{longtable}
 7\begin{document}
 8  \hbox{}\vspace{100pt} % To make the table break between pages
 9
10  \newcolumntype{A}{>{\color{white}\columncolor{red}[.5\tabcolsep]\raggedright}
11    p{2cm}}
12  \newcolumntype{B}{>{\columncolor{blue}[.5\tabcolsep]\color{yellow}\raggedright}
13    p{3cm}}
14  \newcolumntype{C}{>{\columncolor{yellow}[.5\tabcolsep]}D{.}{\cdot}{-1}}
15  \newcolumntype{E}{>{\large\bfseries \columncolor{cyan}[.5\tabcolsep]}c}
16  \newcolumntype{F}{>{\color{white} \columncolor{magenta}[.5\tabcolsep]}c}
17  \newcolumntype{G}{>{\columncolor[gray]{0.8}[.5\tabcolsep][\tabcolsep]}l}
18  \newcolumntype{H}{>{\columncolor[gray]{0.8}}l}
19  \newcolumntype{I}{>{\columncolor[gray]{0.8}[\tabcolsep][.5\tabcolsep]}D{.}{\cdot}
20    {-1}}
21  \setlength\minrowclearance{2pt} %Before starting give a little space
22
23  \begin{longtable}{ABC}
24    \multicolumn{3}{E}{A long table example} \\
25    \multicolumn{2}{F}{First two columns} & \multicolumn{1}{F}{Third column} \\
26    \multicolumn{2}{F}{p-type} & \multicolumn{1}{F}{D-type (\textsf{dcolumn})}
27    \endfirsthead
28
29    \multicolumn{3}{E}{A long table example (continued)} \\
30    \multicolumn{2}{F}{First two columns} & \multicolumn{1}{F}{Third column} \\
31    \multicolumn{2}{F}{p-type} & \multicolumn{1}{F}{D-type (\textsf{dcolumn})}
32    \endhead
33
34    \multicolumn{3}{E}{Continued\ldots}
35    \endfoot
36
37    \multicolumn{3}{E}{The End}
38    \endlastfoot
39
40    P-column & and another one & 12.34 \\
41    \multicolumn{1}{G}{Total} & \multicolumn{1}{H}{(wrong)} &
42      \multicolumn{1}{I}{100.6}\\
43    Some long text in the first column & bbb & 1.2 \\
44    aaa & and some long text in the second column & 1.345 \\
45    \multicolumn{1}{G}{Total} & \multicolumn{1}{H}{(wrong)} &
46      \multicolumn{1}{I}{100.6} \\
47    aaa&bbb & 1.345 \\
48    Note that the colored rules in all columns stretch to accommodate large entries
49      In one column. & bbb & 1.345 \\
50    aaa & bbb & 100 \\
51    aaa & Depending on your driver you may get unsightly gaps or lines
52      where the `screens' used to produce different shapes interact
53      badly. You may want to cause adjacent panels of the same color by
54      specifying a larger overhang or by adding some negative space (in a
55      \verb|\noalign| between rows. & 12.4 \\
56    aaa & bbb & 45.3 \\
57  \end{longtable}
58\end{document}
Before the longtable environment, we define column types with the \newcolumntype command provided by the dcolumn package. Within the arguments, we use the >{...} notation to define column formats. The column definitions, in turn, use commands specifying colors, alignment, fonts, and column widths. The longtable environment itself is another feature employed. Within the environment, we use the \multicolumn command to merge cells horizontally along with the previously defined column types.
The result of all efforts is below:
11. Best Practices and Tips
Typesetting tables in LaTeX can be a nuanced task, but following best practices and tips can help you create clear, aesthetically pleasing, and professional-looking tables. Here are some valuable best practices and tips for typesetting tables in LaTeX:
Use meaningful column headers:
- Provide clear and descriptive headers for each column to guide readers in understanding the content.
Align numerical data at the decimal point:
- When presenting numerical data, align numbers at the decimal point for improved readability. You can use the
dcolumnpackage for this purpose.
- When presenting numerical data, align numbers at the decimal point for improved readability. You can use the
Avoid vertical vines:
- In professional publications, it’s often recommended to avoid using vertical lines to separate columns. Use horizontal lines sparingly for clarity.
Maintain consistency:
- Keep consistent formatting throughout your document, including fonts, font sizes, and alignment within tables.
Minimize cell content:
- Avoid overloading cells with excessive content. If a cell contains too much text, consider splitting it into multiple rows or columns.
Add captions and labels:
- Include informative captions above or below your tables and use the
\labelcommand to enable cross-referencing within your document.
- Include informative captions above or below your tables and use the
Employ
multirowandmulticolumnsparingly:- While
multirowandmulticolumnare useful for merging cells, avoid excessive use as it can make tables complex and harder to read.
- While
Avoid overly complex tables:
- If your data is too complex for a single table, consider breaking it into multiple smaller tables or using other visual aids like graphs or charts.
Use horizontal space thoughtfully:
- Adjust the space between columns using
\setlength{\tabcolsep}{value}and the space between rows using\renewcommand{\arraystretch}{value}to optimize table layout.
- Adjust the space between columns using
Proofread your tables:
- Carefully proofread and check for errors in your tables, including data accuracy, formatting, and alignment.
By implementing these best practices and tips, you can create LaTeX tables that not only effectively communicate your data but also enhance the overall quality and professionalism of your documents.
12. Conclusion
We’ve journeyed through the intricate world of table structures in LaTeX, discovering the remarkable versatility and precision this typesetting system offers. LaTeX’s ability to seamlessly integrate tables into documents empowers users to communicate complex data, comparisons, and relationships with grace and clarity.
From the fundamental concepts of the tabular environment to advanced techniques involving multirow and longtable packages, we’ve explored the tools and strategies that make LaTeX a powerhouse for crafting tables. We’ve learned how LaTeX not only beautifies our tables but also streamlines data presentation, aiding in effective communication.
We’ve emphasized the importance of best practices: meaningful column headers, alignment, proper spacing, and consistency. These practices allow us to create tables that are not just functional but visually appealing and professional.
As you continue to explore LaTeX, remember that mastering table structures is an art as much as it is a science. It’s a skill that can significantly enhance the impact of your academic papers, reports, and presentations.
So, armed with the knowledge of LaTeX’s table capabilities, take your documents to the next level. Experiment, refine, and innovate in the realm of table structures, and let LaTeX be your trusted companion in crafting documents that convey information effectively, beautifully, and professionally.