Praca z wykresami
Do klasy DocumentBuilder dodano nową metodę InsertChart. Zobaczmy więc, jak wstawić prosty wykres kolumnowy do dokumentu za pomocą metody InsertChart.
Jak wstawić wykres
W tej sekcji dowiemy się, jak wstawić wykres do dokumentu.
Wstaw wykres kolumnowy
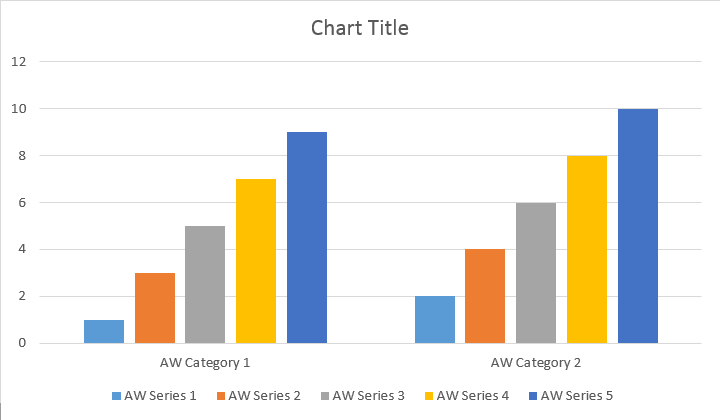
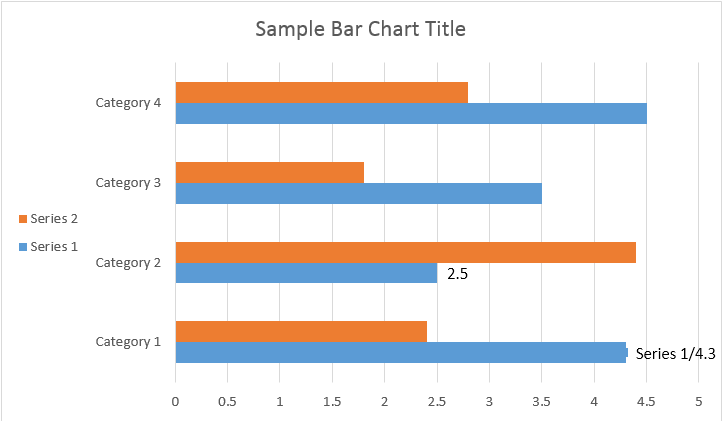
Poniższy przykład kodu pokazuje, jak wstawić wykres kolumnowy:
// For complete examples and data files, please go to https://github.com/aspose-words/Aspose.Words-for-.NET | |
Document doc = new Document(); | |
DocumentBuilder builder = new DocumentBuilder(doc); | |
// Add chart with default data. You can specify different chart types and sizes. | |
Shape shape = builder.InsertChart(ChartType.Column, 432, 252); | |
// Chart property of Shape contains all chart related options. | |
Chart chart = shape.Chart; | |
// Get chart series collection. | |
ChartSeriesCollection seriesColl = chart.Series; | |
// Check series count. | |
Console.WriteLine(seriesColl.Count); | |
// Delete default generated series. | |
seriesColl.Clear(); | |
// Create category names array, in this example we have two categories. | |
string[] categories = new string[] { "AW Category 1", "AW Category 2" }; | |
// Adding new series. Please note, data arrays must not be empty and arrays must be the same size. | |
seriesColl.Add("AW Series 1", categories, new double[] { 1, 2 }); | |
seriesColl.Add("AW Series 2", categories, new double[] { 3, 4 }); | |
seriesColl.Add("AW Series 3", categories, new double[] { 5, 6 }); | |
seriesColl.Add("AW Series 4", categories, new double[] { 7, 8 }); | |
seriesColl.Add("AW Series 5", categories, new double[] { 9, 10 }); | |
dataDir = dataDir + @"TestInsertSimpleChartColumn_out.doc"; | |
doc.Save(dataDir); |
Kod generuje następujący wynik:
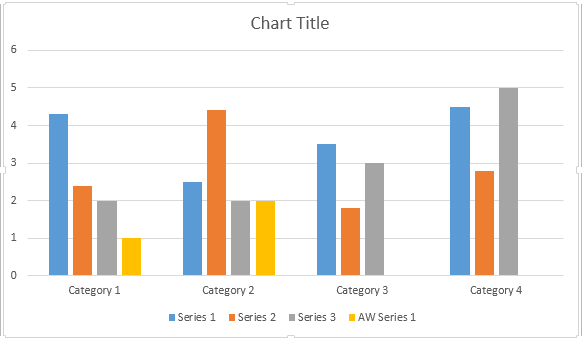
Istnieją cztery różne przeciążenia metody Add serii, która została udostępniona w celu uwzględnienia wszystkich możliwych wariantów źródeł danych dla wszystkich typów wykresów:
// For complete examples and data files, please go to https://github.com/aspose-words/Aspose.Words-for-.NET | |
Document doc = new Document(); | |
DocumentBuilder builder = new DocumentBuilder(doc); | |
// Insert Column chart. | |
Shape shape = builder.InsertChart(ChartType.Column, 432, 252); | |
Chart chart = shape.Chart; | |
// Use this overload to add series to any type of Bar, Column, Line and Surface charts. | |
chart.Series.Add("AW Series 1", new string[] { "AW Category 1", "AW Category 2" }, new double[] { 1, 2 }); | |
dataDir = dataDir + @"TestInsertChartColumn_out.doc"; | |
doc.Save(dataDir); |
Kod generuje następujący wynik:
Wstaw wykres punktowy
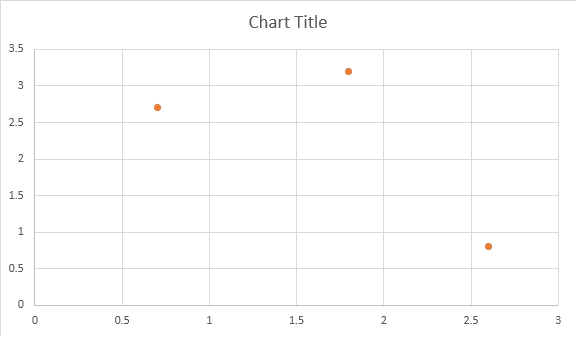
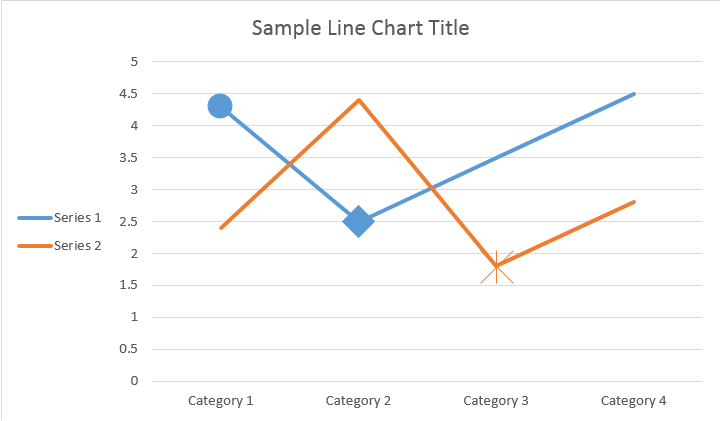
Poniższy przykład kodu pokazuje, jak wstawić wykres punktowy:
// For complete examples and data files, please go to https://github.com/aspose-words/Aspose.Words-for-.NET | |
// The path to the documents directory. | |
string dataDir = RunExamples.GetDataDir_WorkingWithCharts(); | |
Document doc = new Document(); | |
DocumentBuilder builder = new DocumentBuilder(doc); | |
// Insert Scatter chart. | |
Shape shape = builder.InsertChart(ChartType.Scatter, 432, 252); | |
Chart chart = shape.Chart; | |
// Use this overload to add series to any type of Scatter charts. | |
chart.Series.Add("AW Series 1", new double[] { 0.7, 1.8, 2.6 }, new double[] { 2.7, 3.2, 0.8 }); | |
dataDir = dataDir + "TestInsertScatterChart_out.docx"; | |
doc.Save(dataDir); |
Kod generuje następujący wynik:
Wstaw wykres warstwowy
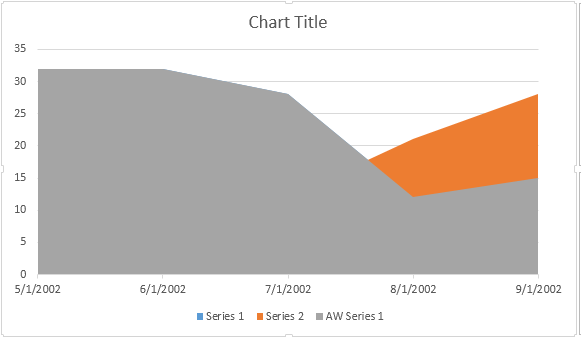
Poniższy przykład kodu pokazuje, jak wstawić wykres warstwowy:
// For complete examples and data files, please go to https://github.com/aspose-words/Aspose.Words-for-.NET | |
// The path to the documents directory. | |
string dataDir = RunExamples.GetDataDir_WorkingWithCharts(); | |
Document doc = new Document(); | |
DocumentBuilder builder = new DocumentBuilder(doc); | |
// Insert Area chart. | |
Shape shape = builder.InsertChart(ChartType.Area, 432, 252); | |
Chart chart = shape.Chart; | |
// Use this overload to add series to any type of Area, Radar and Stock charts. | |
chart.Series.Add("AW Series 1", new DateTime[] { | |
new DateTime(2002, 05, 01), | |
new DateTime(2002, 06, 01), | |
new DateTime(2002, 07, 01), | |
new DateTime(2002, 08, 01), | |
new DateTime(2002, 09, 01)}, | |
new double[] { 32, 32, 28, 12, 15 }); | |
dataDir = dataDir + @"TestInsertAreaChart_out.docx"; | |
doc.Save(dataDir); |
Kod generuje następujący wynik:
Wstaw wykres bąbelkowy
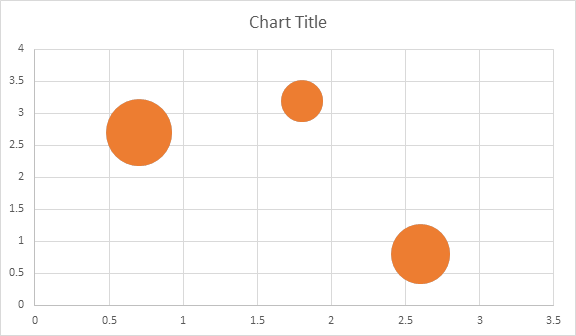
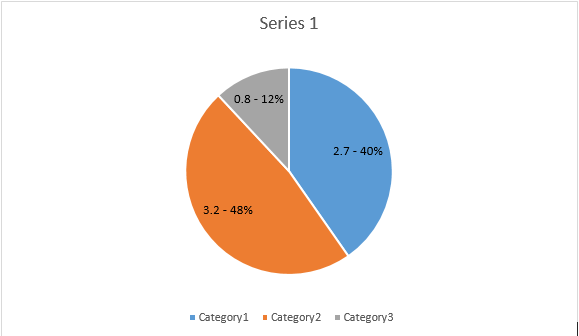
Poniższy przykład kodu pokazuje, jak wstawić wykres bąbelkowy:
// For complete examples and data files, please go to https://github.com/aspose-words/Aspose.Words-for-.NET | |
// The path to the documents directory. | |
string dataDir = RunExamples.GetDataDir_WorkingWithCharts(); | |
Document doc = new Document(); | |
DocumentBuilder builder = new DocumentBuilder(doc); | |
// Insert Bubble chart. | |
Shape shape = builder.InsertChart(ChartType.Bubble, 432, 252); | |
Chart chart = shape.Chart; | |
// Use this overload to add series to any type of Bubble charts. | |
chart.Series.Add("AW Series 1", new double[] { 0.7, 1.8, 2.6 }, new double[] { 2.7, 3.2, 0.8 }, new double[] { 10, 4, 8 }); | |
dataDir = dataDir + @"TestInsertBubbleChart_out.docx"; | |
doc.Save(dataDir); |
Kod generuje następujący wynik:
Praca z wykresami poprzez obiekt Shape.Chart
Po wstawieniu i wypełnieniu wykresu danymi istnieje możliwość zmiany jego wyglądu. Właściwość Shape.Chart
zawiera wszystkie opcje związane z wykresami dostępne w publicznym API.
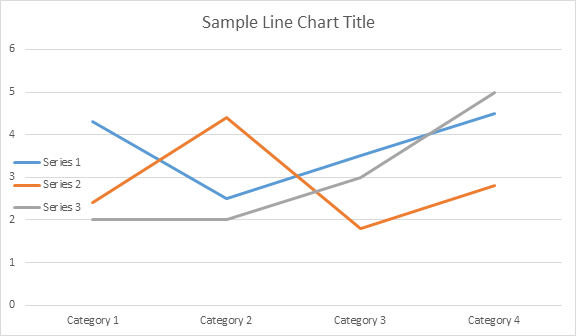
Zmieńmy na przykład tytuł wykresu lub zachowanie legendy:
// For complete examples and data files, please go to https://github.com/aspose-words/Aspose.Words-for-.NET | |
// The path to the documents directory. | |
string dataDir = RunExamples.GetDataDir_WorkingWithCharts(); | |
Document doc = new Document(); | |
DocumentBuilder builder = new DocumentBuilder(doc); | |
Shape shape = builder.InsertChart(ChartType.Line, 432, 252); | |
Chart chart = shape.Chart; | |
// Determines whether the title shall be shown for this chart. Default is true. | |
chart.Title.Show = true; | |
// Setting chart Title. | |
chart.Title.Text = "Sample Line Chart Title"; | |
// Determines whether other chart elements shall be allowed to overlap title. | |
chart.Title.Overlay = false; | |
// Please note if null or empty value is specified as title text, auto generated title will be shown. | |
// Determines how legend shall be shown for this chart. | |
chart.Legend.Position = LegendPosition.Left; | |
chart.Legend.Overlay = true; | |
dataDir = dataDir + @"SimpleLineChart_out.docx"; | |
doc.Save(dataDir); |
Kod generuje następujące wyniki:
Jak pracować z ChartSeriesCollection of Chart
Przyjrzyjmy się kolekcji ChartSeries. Wszystkie serie wykresów są dostępne poprzez kolekcję chart.Series, czyli IEnumerable:
// For complete examples and data files, please go to https://github.com/aspose-words/Aspose.Words-for-.NET | |
// Get chart series collection. | |
ChartSeriesCollection seriesColl = chart.Series; | |
// Check series count. | |
Console.WriteLine(seriesColl.Count); |
Możesz usuwać serie pojedynczo lub wyczyścić wszystkie, a jeśli zajdzie taka potrzeba, dodać nową. Nowo wstawiony wykres zawiera kilka domyślnych serii dodanych do tej kolekcji. Aby je usunąć należy wywołać metodę wykres.Seria.Clear().
Praca z klasą Single ChartSeries
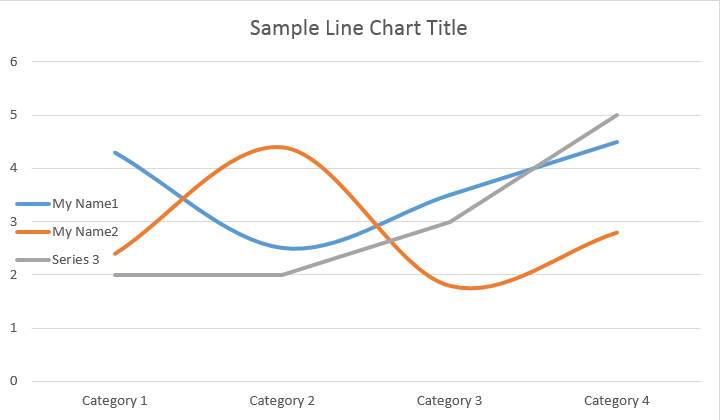
Oto jak pracować z konkretną serią:
// For complete examples and data files, please go to https://github.com/aspose-words/Aspose.Words-for-.NET | |
// Get first series. | |
ChartSeries series0 = shape.Chart.Series[0]; | |
// Get second series. | |
ChartSeries series1 = shape.Chart.Series[1]; | |
// Change first series name. | |
series0.Name = "My Name1"; | |
// Change second series name. | |
series1.Name = "My Name2"; | |
// You can also specify whether the line connecting the points on the chart shall be smoothed using Catmull-Rom splines. | |
series0.Smooth = true; | |
series1.Smooth = true; |
Proszę zobaczyć wynik poniżej:
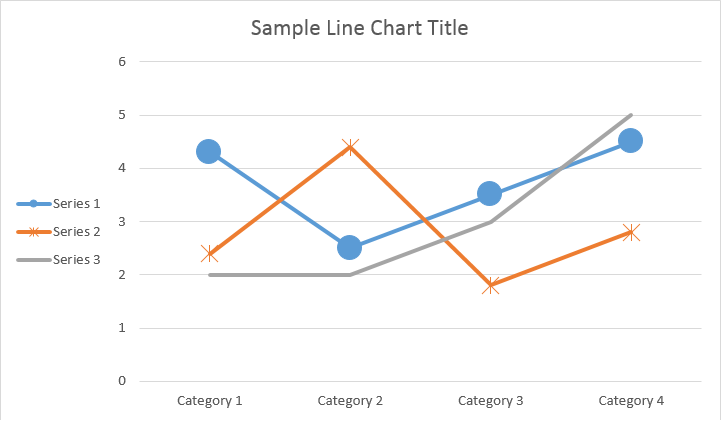
Wszystkie pojedyncze ChartSeries mają domyślne opcje ChartDataPoint. Spróbuj użyć poniższego kodu, aby je zmienić:
// For complete examples and data files, please go to https://github.com/aspose-words/Aspose.Words-for-.NET | |
// Specifies whether by default the parent element shall inverts its colors if the value is negative. | |
series0.InvertIfNegative = true; | |
// Set default marker symbol and size. | |
series0.Marker.Symbol = MarkerSymbol.Circle; | |
series0.Marker.Size = 15; | |
series1.Marker.Symbol = MarkerSymbol.Star; | |
series1.Marker.Size = 10; |
Proszę zobaczyć wynik poniżej:
Jak pracować z pojedynczym ChartDataPoint w ChartSeries
Korzystając z ChartDataPoint, możesz dostosować formatowanie pojedynczego punktu danych w serii wykresów:
// For complete examples and data files, please go to https://github.com/aspose-words/Aspose.Words-for-.NET | |
// The path to the documents directory. | |
string dataDir = RunExamples.GetDataDir_WorkingWithCharts(); | |
Document doc = new Document(); | |
DocumentBuilder builder = new DocumentBuilder(doc); | |
Shape shape = builder.InsertChart(ChartType.Line, 432, 252); | |
Chart chart = shape.Chart; | |
// Get first series. | |
ChartSeries series0 = shape.Chart.Series[0]; | |
// Get second series. | |
ChartSeries series1 = shape.Chart.Series[1]; | |
ChartDataPointCollection dataPointCollection = series0.DataPoints; | |
// Add data point to the first and second point of the first series. | |
ChartDataPoint dataPoint00 = dataPointCollection.Add(0); | |
ChartDataPoint dataPoint01 = dataPointCollection.Add(1); | |
// Set explosion. | |
dataPoint00.Explosion = 50; | |
// Set marker symbol and size. | |
dataPoint00.Marker.Symbol = MarkerSymbol.Circle; | |
dataPoint00.Marker.Size = 15; | |
dataPoint01.Marker.Symbol = MarkerSymbol.Diamond; | |
dataPoint01.Marker.Size = 20; | |
// Add data point to the third point of the second series. | |
ChartDataPoint dataPoint12 = series1.DataPoints.Add(2); | |
dataPoint12.InvertIfNegative = true; | |
dataPoint12.Marker.Symbol = MarkerSymbol.Star; | |
dataPoint12.Marker.Size = 20; | |
dataDir = dataDir + @"SingleChartDataPoint_out.docx"; | |
doc.Save(dataDir); |
Proszę zobaczyć wynik poniżej:
Jak pracować z ChartDataLabel pojedynczej serii wykresów
Używając ChartDataLabel, możesz określić formatowanie pojedynczej etykiety danych serii wykresów, np. pokaż/ukryj LegendKey, CategoryName, SeriesName, Value itp.:
// For complete examples and data files, please go to https://github.com/aspose-words/Aspose.Words-for-.NET | |
Document doc = new Document(); | |
DocumentBuilder builder = new DocumentBuilder(doc); | |
Shape shape = builder.InsertChart(ChartType.Bar, 432, 252); | |
Chart chart = shape.Chart; | |
// Get first series. | |
ChartSeries series0 = shape.Chart.Series[0]; | |
ChartDataLabelCollection labels = series0.DataLabels; | |
// Set properties. | |
labels.ShowLegendKey = true; | |
// By default, when you add data labels to the data points in a pie chart, leader lines are displayed for data labels that are | |
// Positioned far outside the end of data points. Leader lines create a visual connection between a data label and its | |
// Corresponding data point. | |
labels.ShowLeaderLines = true; | |
labels.ShowCategoryName = false; | |
labels.ShowPercentage = false; | |
labels.ShowSeriesName = true; | |
labels.ShowValue = true; | |
labels.Separator = "/"; | |
labels.ShowValue = true; | |
dataDir = dataDir + "SimpleBarChart_out.docx"; | |
doc.Save(dataDir); |
Proszę zobaczyć wynik poniżej:
Jak zdefiniować domyślne opcje dla ChartDataLabels w ChartSeries
Klasa ChartDataLabelCollection definiuje właściwości, których można użyć do ustawienia domyślnych opcji dla ChartDataLabels dla Chart Series. Te właściwości obejmują ShowCategoryName, ShowBubbleSize, ShowPercentage, ShowSeriesName, ShowValue itp.:
// For complete examples and data files, please go to https://github.com/aspose-words/Aspose.Words-for-.NET | |
Document doc = new Document(); | |
DocumentBuilder builder = new DocumentBuilder(doc); | |
Shape shape = builder.InsertChart(ChartType.Pie, 432, 252); | |
Chart chart = shape.Chart; | |
chart.Series.Clear(); | |
ChartSeries series = chart.Series.Add("Series 1", | |
new string[] { "Category1", "Category2", "Category3" }, | |
new double[] { 2.7, 3.2, 0.8 }); | |
ChartDataLabelCollection labels = series.DataLabels; | |
labels.ShowPercentage = true; | |
labels.ShowValue = true; | |
labels.ShowLeaderLines = false; | |
labels.Separator = " - "; | |
doc.Save(dataDir + "Demo.docx"); |
Proszę zobaczyć wynik poniżej:
Jak sformatować numer etykiety danych wykresu
Za pomocą NumberFormat możesz określić formatowanie liczbowe pojedynczej etykiety danych wykresu.
Poniższy przykład kodu pokazuje, jak sformatować numer etykiety danych:
// For complete examples and data files, please go to https://github.com/aspose-words/Aspose.Words-for-.NET | |
Document doc = new Document(); | |
DocumentBuilder builder = new DocumentBuilder(doc); | |
// Add chart with default data. | |
Shape shape = builder.InsertChart(ChartType.Line, 432, 252); | |
Chart chart = shape.Chart; | |
chart.Title.Text = "Data Labels With Different Number Format"; | |
// Delete default generated series. | |
chart.Series.Clear(); | |
// Add new series | |
ChartSeries series1 = chart.Series.Add("AW Series 1", | |
new string[] { "AW0", "AW1", "AW2" }, | |
new double[] { 2.5, 1.5, 3.5 }); | |
series1.HasDataLabels = true; | |
series1.DataLabels.ShowValue = true; | |
series1.DataLabels[0].NumberFormat.FormatCode = "\"$\"#,##0.00"; | |
series1.DataLabels[1].NumberFormat.FormatCode = "dd/mm/yyyy"; | |
series1.DataLabels[2].NumberFormat.FormatCode = "0.00%"; | |
// Or you can set format code to be linked to a source cell, | |
// in this case NumberFormat will be reset to general and inherited from a source cell. | |
series1.DataLabels[2].NumberFormat.IsLinkedToSource = true; | |
dataDir = dataDir + @"NumberFormat_DataLabel_out.docx"; | |
doc.Save(dataDir); |
Jak ustawić właściwości osi wykresu
Jeśli chcesz pracować z osią wykresu, skalowaniem i jednostkami wyświetlania dla osi wartości, użyj klas ChartAxis, AxisDisplayUnit i AxisScaling.
Poniższy przykład kodu pokazuje, jak zdefiniować właściwości osi X i Y:
// For complete examples and data files, please go to https://github.com/aspose-words/Aspose.Words-for-.NET | |
Document doc = new Document(); | |
DocumentBuilder builder = new DocumentBuilder(doc); | |
// Insert chart. | |
Shape shape = builder.InsertChart(ChartType.Area, 432, 252); | |
Chart chart = shape.Chart; | |
// Clear demo data. | |
chart.Series.Clear(); | |
// Fill data. | |
chart.Series.Add("AW Series 1", | |
new DateTime[] { new DateTime(2002, 01, 01), new DateTime(2002, 06, 01), new DateTime(2002, 07, 01), new DateTime(2002, 08, 01), new DateTime(2002, 09, 01) }, | |
new double[] { 640, 320, 280, 120, 150 }); | |
ChartAxis xAxis = chart.AxisX; | |
ChartAxis yAxis = chart.AxisY; | |
// Change the X axis to be category instead of date, so all the points will be put with equal interval on the X axis. | |
xAxis.CategoryType = AxisCategoryType.Category; | |
// Define X axis properties. | |
xAxis.Crosses = AxisCrosses.Custom; | |
xAxis.CrossesAt = 3; // measured in display units of the Y axis (hundreds) | |
xAxis.ReverseOrder = true; | |
xAxis.MajorTickMark = AxisTickMark.Cross; | |
xAxis.MinorTickMark = AxisTickMark.Outside; | |
xAxis.TickLabelOffset = 200; | |
// Define Y axis properties. | |
yAxis.TickLabelPosition = AxisTickLabelPosition.High; | |
yAxis.MajorUnit = 100; | |
yAxis.MinorUnit = 50; | |
yAxis.DisplayUnit.Unit = AxisBuiltInUnit.Hundreds; | |
yAxis.Scaling.Minimum = new AxisBound(100); | |
yAxis.Scaling.Maximum = new AxisBound(700); | |
dataDir = dataDir + @"SetAxisProperties_out.docx"; | |
doc.Save(dataDir); |
Jak ustawić wartość czasu Date osi
Poniższy przykład kodu pokazuje, jak ustawić wartości daty/godziny dla właściwości osi:
// For complete examples and data files, please go to https://github.com/aspose-words/Aspose.Words-for-.NET | |
Document doc = new Document(); | |
DocumentBuilder builder = new DocumentBuilder(doc); | |
// Insert chart. | |
Shape shape = builder.InsertChart(ChartType.Column, 432, 252); | |
Chart chart = shape.Chart; | |
// Clear demo data. | |
chart.Series.Clear(); | |
// Fill data. | |
chart.Series.Add("AW Series 1", | |
new DateTime[] { new DateTime(2017, 11, 06), new DateTime(2017, 11, 09), new DateTime(2017, 11, 15), | |
new DateTime(2017, 11, 21), new DateTime(2017, 11, 25), new DateTime(2017, 11, 29) }, | |
new double[] { 1.2, 0.3, 2.1, 2.9, 4.2, 5.3 }); | |
// Set X axis bounds. | |
ChartAxis xAxis = chart.AxisX; | |
xAxis.Scaling.Minimum = new AxisBound((new DateTime(2017, 11, 05)).ToOADate()); | |
xAxis.Scaling.Maximum = new AxisBound((new DateTime(2017, 12, 03)).ToOADate()); | |
// Set major units to a week and minor units to a day. | |
xAxis.MajorUnit = 7; | |
xAxis.MinorUnit = 1; | |
xAxis.MajorTickMark = AxisTickMark.Cross; | |
xAxis.MinorTickMark = AxisTickMark.Outside; | |
dataDir = dataDir + @"SetDateTimeValuesToAxis_out.docx"; | |
doc.Save(dataDir); |
Jak sformatować wartość liczbową osi
Poniższy przykład kodu pokazuje, jak zmienić format liczb na osi wartości:
// For complete examples and data files, please go to https://github.com/aspose-words/Aspose.Words-for-.NET | |
Document doc = new Document(); | |
DocumentBuilder builder = new DocumentBuilder(doc); | |
// Insert chart. | |
Shape shape = builder.InsertChart(ChartType.Column, 432, 252); | |
Chart chart = shape.Chart; | |
// Clear demo data. | |
chart.Series.Clear(); | |
// Fill data. | |
chart.Series.Add("AW Series 1", | |
new string[] { "Item 1", "Item 2", "Item 3", "Item 4", "Item 5" }, | |
new double[] { 1900000, 850000, 2100000, 600000, 1500000 }); | |
// Set number format. | |
chart.AxisY.NumberFormat.FormatCode = "#,##0"; | |
dataDir = dataDir + @"FormatAxisNumber_out.docx"; | |
doc.Save(dataDir); |
Jak ustawić granice osi
Klasa AxisBound
reprezentuje minimalną lub maksymalną granicę wartości osi. Powiązanie można określić jako wartość liczbową, datę i godzinę lub specjalną wartość “automatyczną”.
Poniższy przykład kodu pokazuje, jak ustawić granice osi:
// For complete examples and data files, please go to https://github.com/aspose-words/Aspose.Words-for-.NET | |
Document doc = new Document(); | |
DocumentBuilder builder = new DocumentBuilder(doc); | |
// Insert chart. | |
Shape shape = builder.InsertChart(ChartType.Column, 432, 252); | |
Chart chart = shape.Chart; | |
// Clear demo data. | |
chart.Series.Clear(); | |
// Fill data. | |
chart.Series.Add("AW Series 1", | |
new string[] { "Item 1", "Item 2", "Item 3", "Item 4", "Item 5" }, | |
new double[] { 1.2, 0.3, 2.1, 2.9, 4.2 }); | |
chart.AxisY.Scaling.Minimum = new AxisBound(0); | |
chart.AxisY.Scaling.Maximum = new AxisBound(6); | |
dataDir = dataDir + @"SetboundsOfAxis_out.docx"; | |
doc.Save(dataDir); |
Jak ustawić jednostkę odstępu między etykietami
Poniższy przykład kodu pokazuje, jak ustawić jednostkę odstępu między etykietami na osi:
// For complete examples and data files, please go to https://github.com/aspose-words/Aspose.Words-for-.NET | |
Document doc = new Document(); | |
DocumentBuilder builder = new DocumentBuilder(doc); | |
// Insert chart. | |
Shape shape = builder.InsertChart(ChartType.Column, 432, 252); | |
Chart chart = shape.Chart; | |
// Clear demo data. | |
chart.Series.Clear(); | |
// Fill data. | |
chart.Series.Add("AW Series 1", | |
new string[] { "Item 1", "Item 2", "Item 3", "Item 4", "Item 5" }, | |
new double[] { 1.2, 0.3, 2.1, 2.9, 4.2 }); | |
chart.AxisX.TickLabelSpacing = 2; | |
dataDir = dataDir + @"SetIntervalUnitBetweenLabelsOnAxis_out.docx"; | |
doc.Save(dataDir); |
Jak ukryć oś wykresu
Jeśli chcesz pokazać lub ukryć oś wykresu, możesz to po prostu osiągnąć, ustawiając wartość właściwości ChartAxis.Hidden
.
Poniższy przykład kodu pokazuje, jak ukryć oś Y wykresu:
// For complete examples and data files, please go to https://github.com/aspose-words/Aspose.Words-for-.NET | |
Document doc = new Document(); | |
DocumentBuilder builder = new DocumentBuilder(doc); | |
// Insert chart. | |
Shape shape = builder.InsertChart(ChartType.Column, 432, 252); | |
Chart chart = shape.Chart; | |
// Clear demo data. | |
chart.Series.Clear(); | |
// Fill data. | |
chart.Series.Add("AW Series 1", | |
new string[] { "Item 1", "Item 2", "Item 3", "Item 4", "Item 5" }, | |
new double[] { 1.2, 0.3, 2.1, 2.9, 4.2 }); | |
// Hide the Y axis. | |
chart.AxisY.Hidden = true; | |
dataDir = dataDir + @"HideChartAxis_out.docx"; | |
doc.Save(dataDir); |
Jak wyrównać etykietę wykresu
Jeśli chcesz ustawić wyrównanie tekstu dla etykiet wielowierszowych, możesz to po prostu osiągnąć, ustawiając wartość właściwości TickLabelsX**.Wyrównanie**.
Poniższy przykład kodu pokazuje, jak zaznaczyć wyrównanie etykiet:
// For complete examples and data files, please go to https://github.com/aspose-words/Aspose.Words-for-.NET | |
Document doc = new Document(dataDir + "Document.docx"); | |
Shape shape = (Shape)doc.GetChild(NodeType.Shape, 0, true); | |
ChartAxis axis = shape.Chart.AxisX; | |
//This property has effect only for multi-line labels. | |
axis.TickLabelAlignment = ParagraphAlignment.Right; | |
doc.Save(dataDir + "Document_out.docx"); |
Jak ustawić formatowanie wypełnienia i obrysu
Formatowanie wypełnienia i obrysu można ustawić dla serii wykresów, punktów danych i znaczników. Aby to zrobić, należy użyć właściwości typu ChartFormat w klasach ChartSeries, ChartDataPoint i ChartMarker, a także aliasów dla niektórych właściwości, takich jak ForeColor, BackColor, Visible i Transparency w klasie Stroke
.
Poniższy przykład kodu pokazuje, jak ustawić kolor serii:
Document doc = new Document();
DocumentBuilder builder = new DocumentBuilder(doc);
Shape shape = builder.InsertChart(ChartType.Column, 432, 252);
Chart chart = shape.Chart;
ChartSeriesCollection seriesColl = chart.Series;
// Delete default generated series.
seriesColl.Clear();
// Create category names array.
string[] categories = new string[] { "AW Category 1", "AW Category 2" };
// Adding new series. Value and category arrays must be the same size.
ChartSeries series1 = seriesColl.Add("AW Series 1", categories, new double[] { 1, 2 });
ChartSeries series2 = seriesColl.Add("AW Series 2", categories, new double[] { 3, 4 });
ChartSeries series3 = seriesColl.Add("AW Series 3", categories, new double[] { 5, 6 });
// Set series color.
series1.Format.Fill.ForeColor = Color.Red;
series2.Format.Fill.ForeColor = Color.Yellow;
series3.Format.Fill.ForeColor = Color.Blue;
doc.Save(dir + "ColumnColor.docx");
Poniższy przykład kodu pokazuje, jak ustawić kolor i wagę linii:
Document doc = new Document();
DocumentBuilder builder = new DocumentBuilder(doc);
Shape shape = builder.InsertChart(ChartType.Line, 432, 252);
Chart chart = shape.Chart;
ChartSeriesCollection seriesColl = chart.Series;
// Delete default generated series.
seriesColl.Clear();
// Adding new series.
ChartSeries series1 = seriesColl.Add("AW Series 1", new double[] { 0.7, 1.8, 2.6 },
new double[] { 2.7, 3.2, 0.8 });
ChartSeries series2 = seriesColl.Add("AW Series 2", new double[] { 0.5, 1.5, 2.5 },
new double[] { 3, 1, 2 });
// Set series color.
series1.Format.Stroke.ForeColor = Color.Red;
series1.Format.Stroke.Weight = 5;
series2.Format.Stroke.ForeColor = Color.LightGreen;
series2.Format.Stroke.Weight = 5;
doc.Save(dir + "LineColorAndWeight.docx");