Analyzing your prompt, please hold on...
An error occurred while retrieving the results. Please refresh the page and try again.
Новый InsertChart Метод был добавлен в DocumentBuilder класс. Итак, давайте посмотрим, как вставить простую таблицу столбцов в документ, используя InsertChart метод.
В этом разделе мы узнаем, как вставить карту в документ.
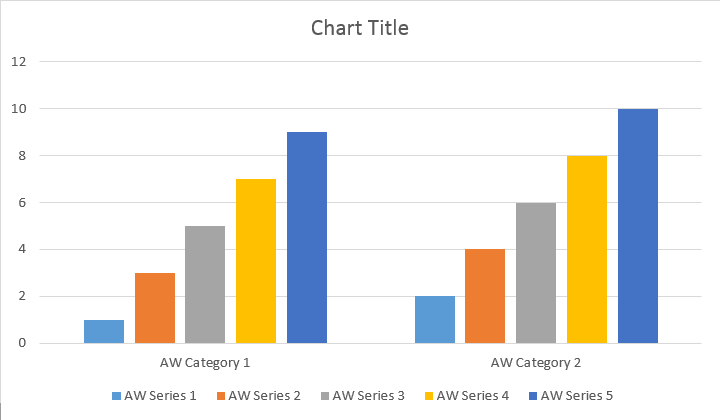
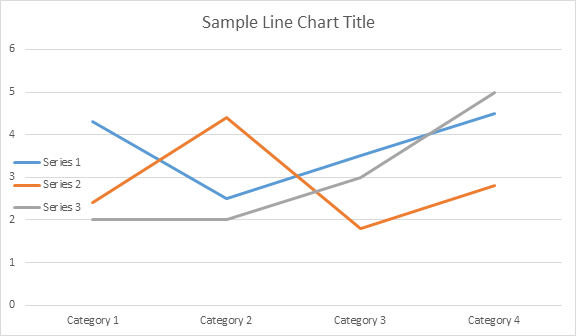
Следующий пример кода показывает, как вставить столбцовую диаграмму:
Код дает следующий результат:
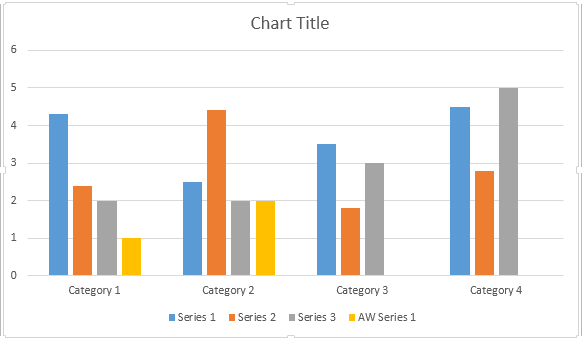
Существует четыре различных перегрузки для серии. Добавить метод, который был подвержен охвату всех возможных вариантов источников данных для всех типов диаграмм:
Код дает следующий результат:
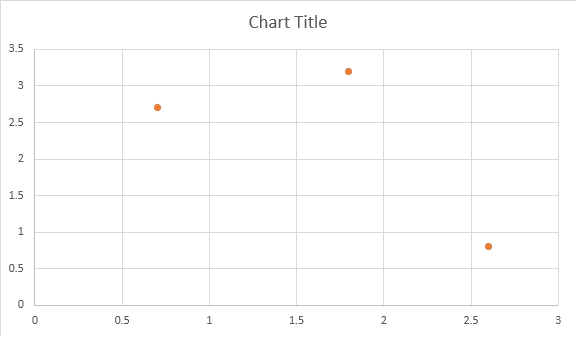
Следующий пример кода показывает, как вставить диаграмму рассеяния:
Код дает следующий результат:
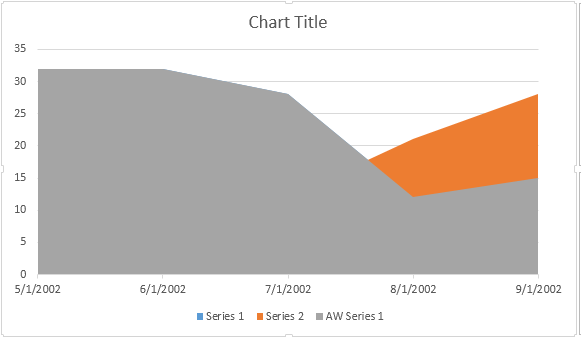
Следующий пример кода показывает, как вставить диаграмму области:
Код дает следующий результат:
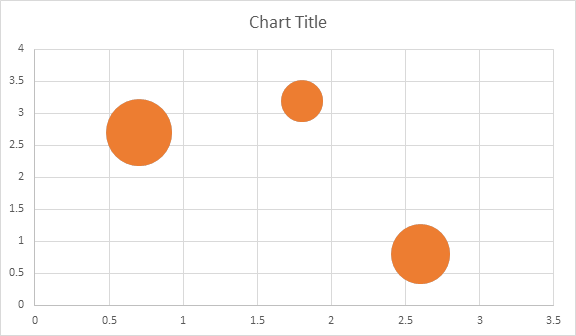
Следующий пример кода показывает, как вставить пузырьковую диаграмму:
Код дает следующий результат:
Shape.Chart ОбъектПосле того, как график был вставлен и заполнен данными, вы можете изменить его внешний вид. Shape.Chart собственность содержит все варианты, связанные с диаграммами, доступные через общественность API.
Например, давайте изменим Название диаграммы или поведение легенды:
Код генерирует следующие результаты:
Давайте посмотрим на ChartSeries Коллекция. Все серии карт доступны через chart.Series Коллекция, которая является IEnumerable:
Вы можете удалить серию по одной или очистить все из них, а также добавить новую, если это необходимо. Недавно вставленный график имеет некоторые серии по умолчанию, добавленные в эту коллекцию. Чтобы удалить их, вам нужно позвонить в Скриншоты из игры Series.Clear() метод.
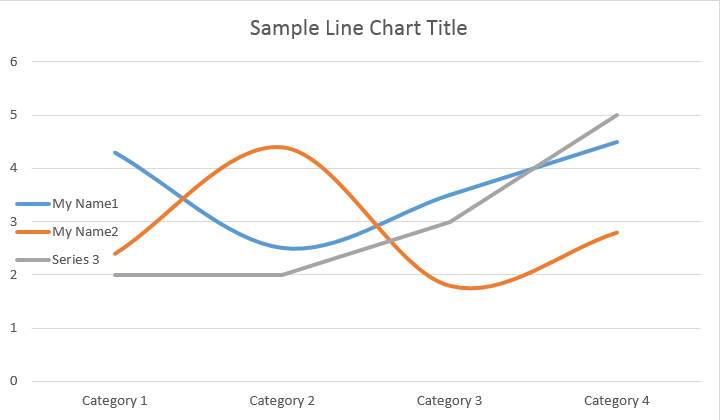
Вот как работать с конкретной серией:
Пожалуйста, смотрите результат ниже:
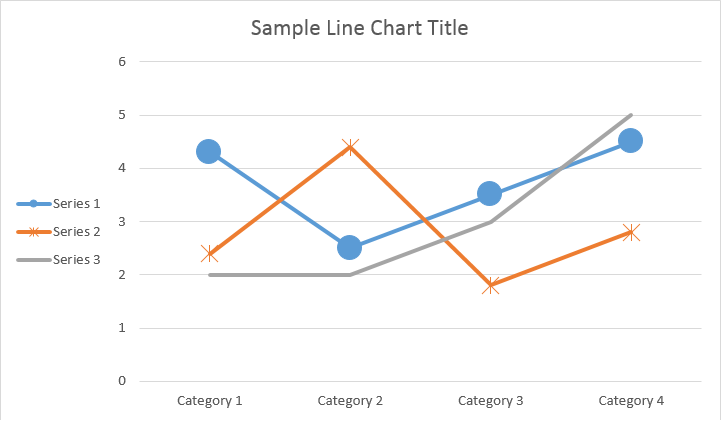
Все одинокие ChartSeries иметь дефолт ChartDataPoint Пожалуйста, попробуйте использовать следующий код, чтобы изменить их:
Пожалуйста, смотрите результат ниже:
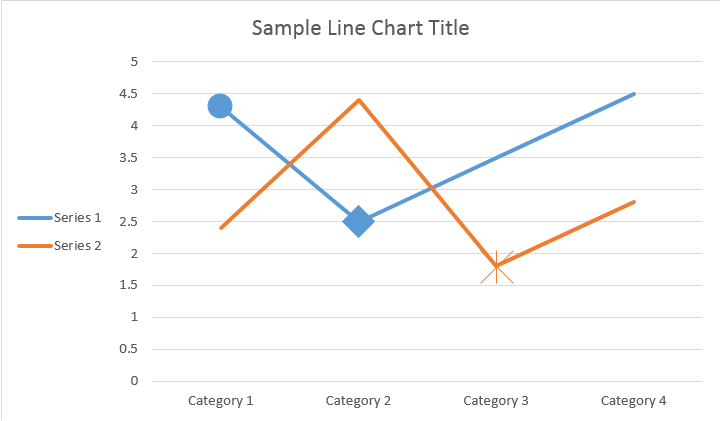
ChartSeriesИспользовать ChartDataPoint Вы можете настроить форматирование одной точки данных серии диаграмм:
Пожалуйста, смотрите результат ниже:
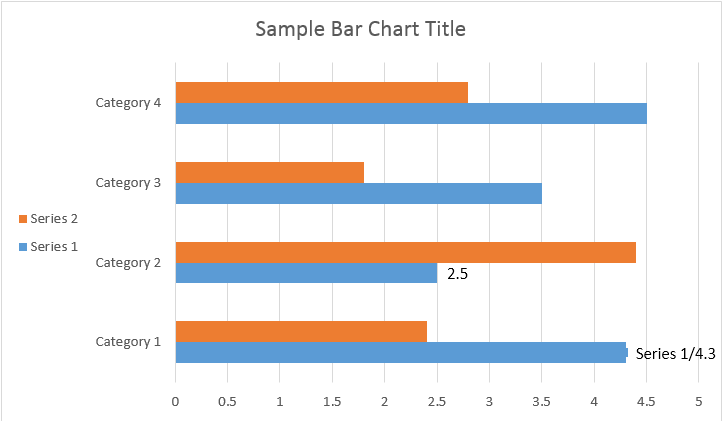
Использовать ChartDataLabel Вы можете указать форматирование одной метки данных серии диаграмм, такой как show/hide LegendKey, CategoryName, SeriesName, Стоимость и т.д
Пожалуйста, смотрите результат ниже:
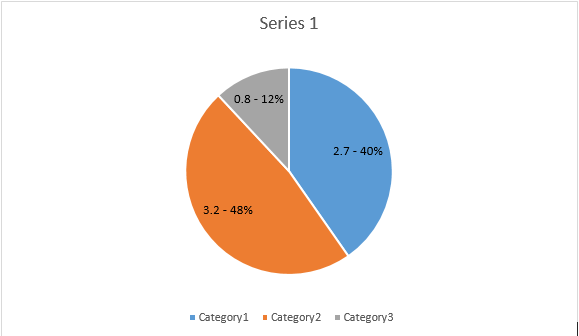
The ChartDataLabelCollection класс определяет свойства, которые могут использоваться для установки опций по умолчанию для ChartDataLabels для диаграммы Series. Эти свойства включают ShowCategoryName, ShowBubbleSize, ShowPercentage, ShowSeriesName, Show Стоимость и т.д
Пожалуйста, смотрите результат ниже:
Использовать NumberFormat Вы можете указать форматирование номера одной метки данных диаграммы.
Следующий пример кода показывает, как форматировать номер метки данных:
Если вы хотите работать с осью диаграмм, масштабированием и отображением блоков для оси значений, пожалуйста, используйте ChartAxis, AxisDisplayUnit, и AxisScaling классы.
Следующий пример кода показывает, как определить свойства оси X и Y:
Следующий пример кода показывает, как установить значения даты/времени на свойства оси:
Следующий пример кода показывает, как изменить формат чисел на оси значений:
The AxisBound Класс представляет собой минимальный или максимальный предел значений оси. Связь может быть указана как цифровое, дата-время или специальное “авто” значение.
Следующий пример кода показывает, как установить границы оси:
Следующий пример кода показывает, как установить интервал между ярлыками на оси:
Если вы хотите показать или скрыть ось диаграммы, вы можете просто достичь этого, установив значение ChartAxis.Hidden собственность.
Следующий пример кода показывает, как скрыть Y-ось диаграммы:
Если вы хотите установить текстовое выравнивание для многострочных меток, вы можете просто достичь этого, установив значение TickLabels.Выравнивание собственность.
Следующий пример кода показывает, как выравнивать этикетку:
Форматирование заполнения и хода может быть установлено для серий диаграмм, точек данных и маркеров. Для этого нужно использовать свойства ChartFormat тип в котором ChartSeries, ChartDataPoint, и ChartMarker классы, а также псевдонимы для некоторых свойств, таких как ForeColor, BackColor, Visible и Transparency Stroke класс.
Следующий пример кода показывает, как установить цвет серии:
Document doc = new Document();
DocumentBuilder builder = new DocumentBuilder(doc);

Shape shape = builder.InsertChart(ChartType.Column, 432, 252);

Chart chart = shape.Chart;
ChartSeriesCollection seriesColl = chart.Series;

// Delete default generated series.
seriesColl.Clear();

// Create category names array.
string[] categories = new string[] { "AW Category 1", "AW Category 2" };

// Adding new series. Value and category arrays must be the same size.
ChartSeries series1 = seriesColl.Add("AW Series 1", categories, new double[] { 1, 2 });
ChartSeries series2 = seriesColl.Add("AW Series 2", categories, new double[] { 3, 4 });
ChartSeries series3 = seriesColl.Add("AW Series 3", categories, new double[] { 5, 6 });

// Set series color.
series1.Format.Fill.ForeColor = Color.Red;
series2.Format.Fill.ForeColor = Color.Yellow;
series3.Format.Fill.ForeColor = Color.Blue;

doc.Save(dir + "ColumnColor.docx");
Следующий пример кода показывает, как установить цвет линии и вес:
Document doc = new Document();
DocumentBuilder builder = new DocumentBuilder(doc);

Shape shape = builder.InsertChart(ChartType.Line, 432, 252);

Chart chart = shape.Chart;
ChartSeriesCollection seriesColl = chart.Series;

// Delete default generated series.
seriesColl.Clear();

// Adding new series.
ChartSeries series1 = seriesColl.Add("AW Series 1", new double[] { 0.7, 1.8, 2.6 },
	new double[] { 2.7, 3.2, 0.8 });
ChartSeries series2 = seriesColl.Add("AW Series 2", new double[] { 0.5, 1.5, 2.5 },
	new double[] { 3, 1, 2 });

// Set series color.
series1.Format.Stroke.ForeColor = Color.Red;
series1.Format.Stroke.Weight = 5;
series2.Format.Stroke.ForeColor = Color.LightGreen;
series2.Format.Stroke.Weight = 5;

doc.Save(dir + "LineColorAndWeight.docx");
Analyzing your prompt, please hold on...
An error occurred while retrieving the results. Please refresh the page and try again.