Erstellen eines Tortendiagramms
Erstellen eines Tortendiagramms
Dieser Artikel vergleicht, wie man ein Kreisdiagramm mit Office Automation und VSTO im Vergleich zur Verwendung von Aspose.Cells for .NET erstellt. Die Schritte zum Erstellen eines Kreisdiagramms lauten:
- Erstellen eines Arbeitsblatts und Arbeitsblattes.
- Hinzufügen von Beispieldaten.
- Verweisen auf productsChart.
- Hinzufügen eines Kreisdiagramms, Definieren des Datenbereichs und des Diagrammtitels.
- Speichern der Arbeitsmappe.
Die Codebeispiele in diesem Artikel zeigen, wie man ein Kreisdiagramm mit VSTO hinzufügen kann, wahlweise mithilfe von C# oder Visual Basic, im Vergleich zur Erstellung mit Aspose.Cells, wiederum mithilfe von C# oder Visual Basic.
Erstellen eines Kreisdiagramms mit VSTO
Die folgenden Codebeispiele zeigen, wie man mithilfe von VSTO ein Kreisdiagramm zu einem Tabellenblatt hinzufügen kann.
C#
 void PieChart()

{

    //Access a Vsto Worksheet

    Microsoft.Office.Tools.Excel.Worksheet sheet = this;

    //Add sample data for pie chart

    //Add headings in A1 and B1

    sheet.Cells[1, 1] = "Products";

    sheet.Cells[1, 2] = "Users";


    //Add data from A2 till B4

    sheet.Cells[2, 1] = "Aspose.Cells";

    sheet.Cells[2, 2] = 10000;

    sheet.Cells[3, 1] = "Aspose.Slides";

    sheet.Cells[3, 2] = 8000;

    sheet.Cells[4, 1] = "Aspose.Words";

    sheet.Cells[4, 2] = 12000;

    //Chart reference

    Microsoft.Office.Tools.Excel.Chart productsChart;

    //Add a Pie Chart

    productsChart = sheet.Controls.AddChart(0, 105, 330, 200, "ProductUsers");

    productsChart.ChartType = Microsoft.Office.Interop.Excel.XlChartType.xlPie;

    //Set chart title

    productsChart.HasTitle = true;

    productsChart.ChartTitle.Text = "Users";

    //Gets the cells that define the data to be charted.

    Microsoft.Office.Interop.Excel.Range chartRange = sheet.get_Range("A2", "B4");

    productsChart.SetSourceData(chartRange, missing);

    //Access the Active workbook from Vsto sheet

    Microsoft.Office.Interop.Excel.Workbook workbook= sheet.Application.ActiveWorkbook;

    //Save the copy of workbook as OutputVsto.xlsx

    workbook.SaveCopyAs("C:\\Downloads\\OutputVsto.xlsx");

}
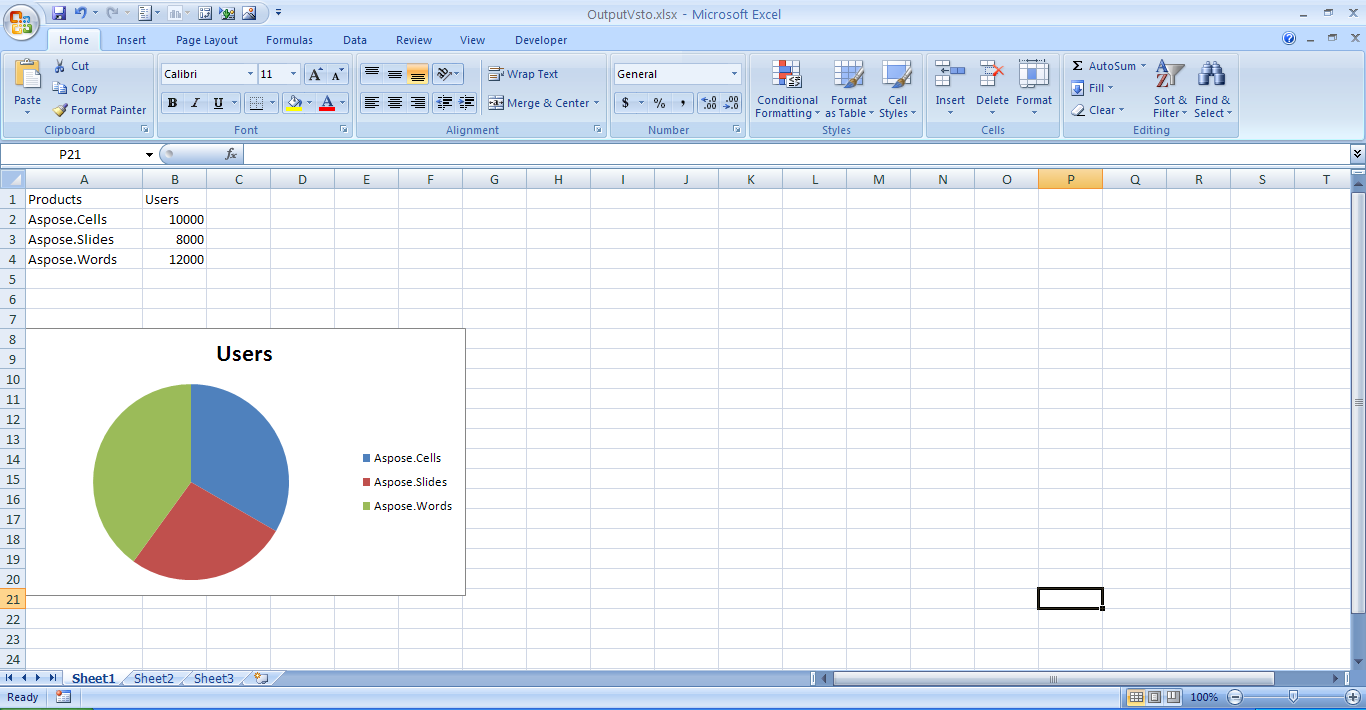
Ein mit VSTO erstelltes Kreisdiagramm
Erstellen eines Kreisdiagramms mit Aspose.Cells for .NET
Die folgenden Codebeispiele zeigen, wie man mithilfe von Aspose.Cells ein Kreisdiagramm zu einem Tabellenblatt hinzufügen kann.
C#
 private void PieChart()

{

    //Create Aspose.Cells Workbook

    Workbook workbook = new Workbook();

    //Access Aspose.Cells Worksheet

    Worksheet sheet = workbook.Worksheets[0];

    //Add sample data for pie chart

    //Add headings in A1 and B1

    sheet.Cells["A1"].PutValue("Products");

    sheet.Cells["B1"].PutValue("Users");

    //Add data from A2 till B4

    sheet.Cells["A2"].PutValue("Aspose.Cells");

    sheet.Cells["B2"].PutValue(10000);

    sheet.Cells["A3"].PutValue("Aspose.Slides");

    sheet.Cells["B3"].PutValue(8000);

    sheet.Cells["A4"].PutValue("Aspose.Words");

    sheet.Cells["B4"].PutValue(12000);

    //Chart reference

    Chart productsChart;

    //Add a Pie Chart

    int chartIdx = sheet.Charts.Add(ChartType.Pie, 7, 0, 20, 6);

    productsChart = sheet.Charts[chartIdx];

    //Gets the cells that define the data to be charted

    int seriesIdx = productsChart.NSeries.Add("=Sheet1!$B$2:$B$4", true);

    Series nSeries = productsChart.NSeries[seriesIdx];

    nSeries.XValues = "=Sheet1!$A$2:$A$4";

    //Set chart title

    productsChart.Title.Text = "Users";

    //Autofit first column

    sheet.AutoFitColumn(0);

    //Save the copy of workbook as OutputAspose.xlsx

    workbook.Save("C:\\Downloads\\OutputAspose.xlsx");

}
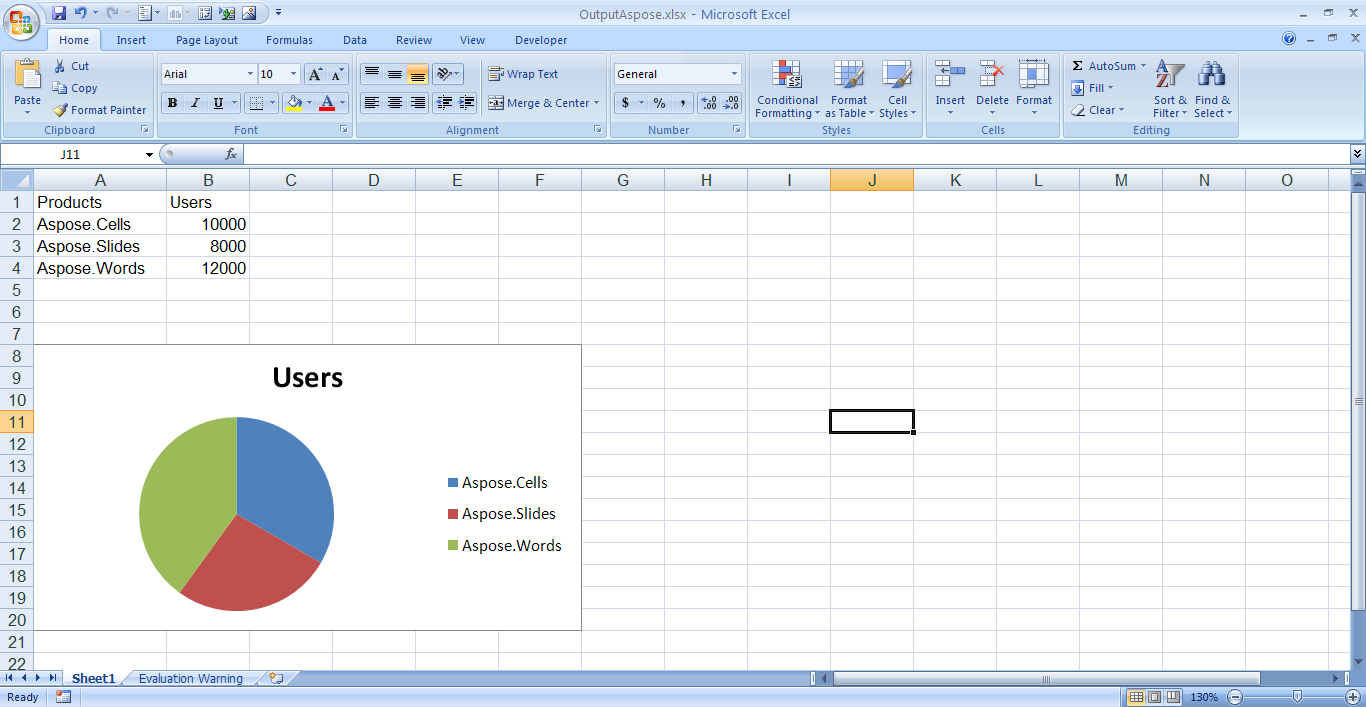
Mit Aspose.Cells for .NET erstelltes Kreisdiagramm