Créer un graphique circulaire
Création d’un graphique circulaire
Cet article compare comment créer un graphique circulaire à l’aide de l’automatisation Office et de VSTO à l’aide de Aspose.Cells for .NET. Les étapes pour créer un graphique circulaire sont :
- Créer un classeur et une feuille de calcul.
- Ajouter des données d’exemple.
- Référencer productsChart.
- Ajouter un graphique circulaire, définir la plage de données et le titre du graphique.
- Enregistrer la feuille de calcul.
Les exemples de code dans cet article montrent comment ajouter un graphique circulaire avec VSTO, en utilisant soit C# ou Visual Basic, comparé à la création avec Aspose.Cells, encore une fois en utilisant soit C# ou Visual Basic.
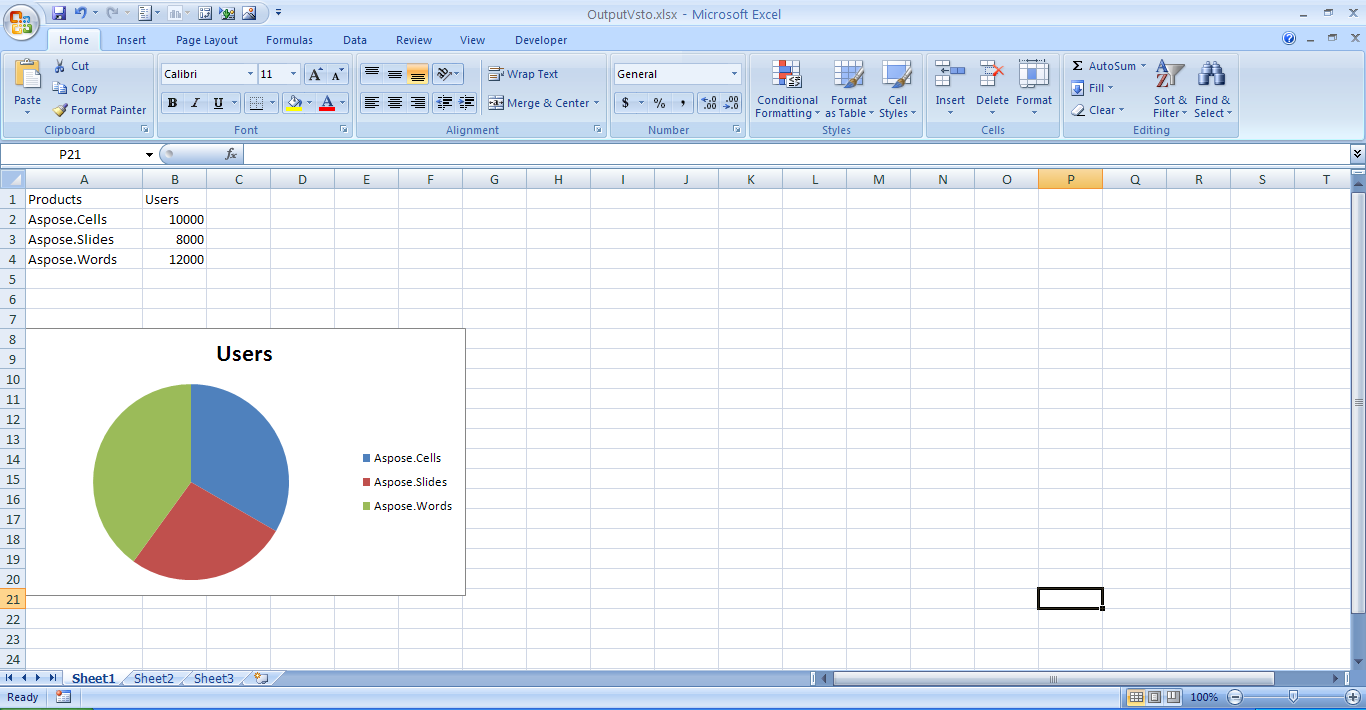
Création d’un graphique circulaire avec VSTO
Les exemples de code qui suivent montrent comment ajouter un graphique circulaire à une feuille de calcul à l’aide de VSTO.
C#
 void PieChart()

{

    //Access a Vsto Worksheet

    Microsoft.Office.Tools.Excel.Worksheet sheet = this;

    //Add sample data for pie chart

    //Add headings in A1 and B1

    sheet.Cells[1, 1] = "Products";

    sheet.Cells[1, 2] = "Users";


    //Add data from A2 till B4

    sheet.Cells[2, 1] = "Aspose.Cells";

    sheet.Cells[2, 2] = 10000;

    sheet.Cells[3, 1] = "Aspose.Slides";

    sheet.Cells[3, 2] = 8000;

    sheet.Cells[4, 1] = "Aspose.Words";

    sheet.Cells[4, 2] = 12000;

    //Chart reference

    Microsoft.Office.Tools.Excel.Chart productsChart;

    //Add a Pie Chart

    productsChart = sheet.Controls.AddChart(0, 105, 330, 200, "ProductUsers");

    productsChart.ChartType = Microsoft.Office.Interop.Excel.XlChartType.xlPie;

    //Set chart title

    productsChart.HasTitle = true;

    productsChart.ChartTitle.Text = "Users";

    //Gets the cells that define the data to be charted.

    Microsoft.Office.Interop.Excel.Range chartRange = sheet.get_Range("A2", "B4");

    productsChart.SetSourceData(chartRange, missing);

    //Access the Active workbook from Vsto sheet

    Microsoft.Office.Interop.Excel.Workbook workbook= sheet.Application.ActiveWorkbook;

    //Save the copy of workbook as OutputVsto.xlsx

    workbook.SaveCopyAs("C:\\Downloads\\OutputVsto.xlsx");

}
Un graphique circulaire créé avec VSTO
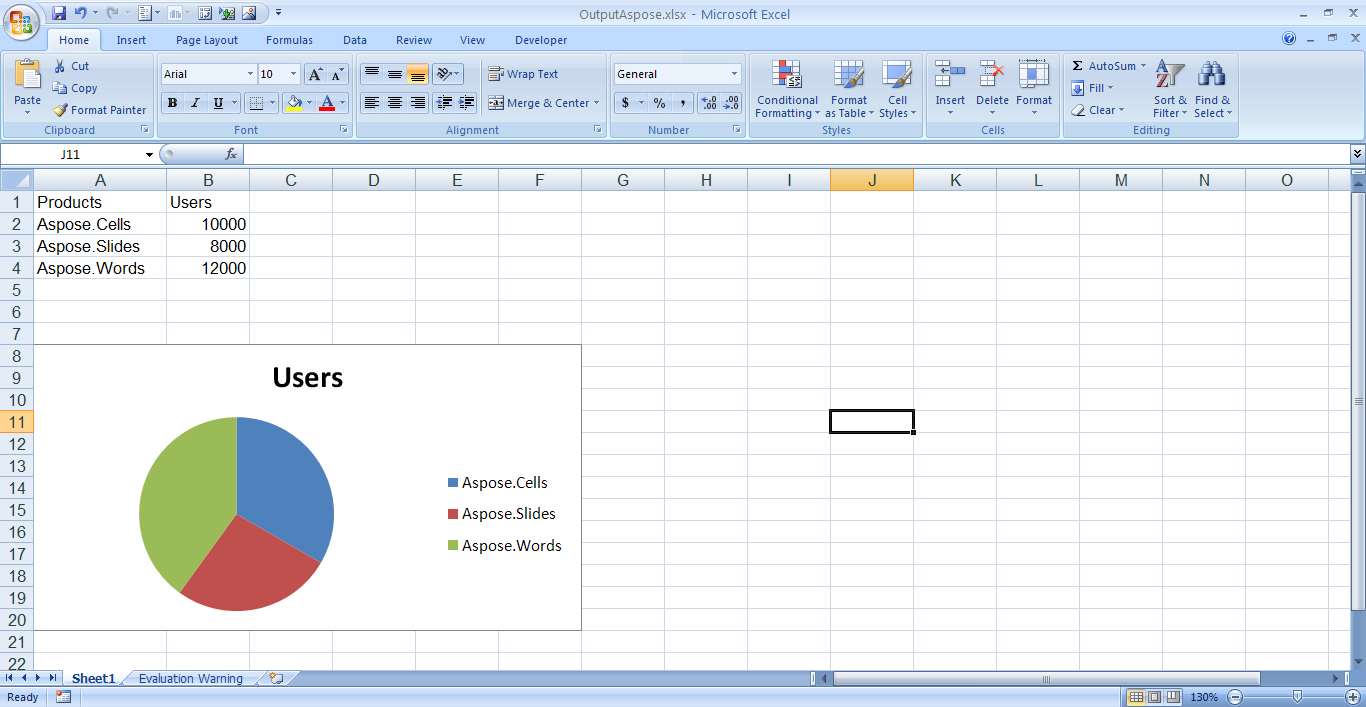
Création d’un graphique circulaire avec Aspose.Cells for .NET
Les exemples de code suivants montrent comment ajouter un graphique circulaire à une feuille de calcul à l’aide d’Aspose.Cells.
C#
 private void PieChart()

{

    //Create Aspose.Cells Workbook

    Workbook workbook = new Workbook();

    //Access Aspose.Cells Worksheet

    Worksheet sheet = workbook.Worksheets[0];

    //Add sample data for pie chart

    //Add headings in A1 and B1

    sheet.Cells["A1"].PutValue("Products");

    sheet.Cells["B1"].PutValue("Users");

    //Add data from A2 till B4

    sheet.Cells["A2"].PutValue("Aspose.Cells");

    sheet.Cells["B2"].PutValue(10000);

    sheet.Cells["A3"].PutValue("Aspose.Slides");

    sheet.Cells["B3"].PutValue(8000);

    sheet.Cells["A4"].PutValue("Aspose.Words");

    sheet.Cells["B4"].PutValue(12000);

    //Chart reference

    Chart productsChart;

    //Add a Pie Chart

    int chartIdx = sheet.Charts.Add(ChartType.Pie, 7, 0, 20, 6);

    productsChart = sheet.Charts[chartIdx];

    //Gets the cells that define the data to be charted

    int seriesIdx = productsChart.NSeries.Add("=Sheet1!$B$2:$B$4", true);

    Series nSeries = productsChart.NSeries[seriesIdx];

    nSeries.XValues = "=Sheet1!$A$2:$A$4";

    //Set chart title

    productsChart.Title.Text = "Users";

    //Autofit first column

    sheet.AutoFitColumn(0);

    //Save the copy of workbook as OutputAspose.xlsx

    workbook.Save("C:\\Downloads\\OutputAspose.xlsx");

}
Graphique circulaire créé avec Aspose.Cells for .NET