Analyzing your prompt, please hold on...
An error occurred while retrieving the results. Please refresh the page and try again.
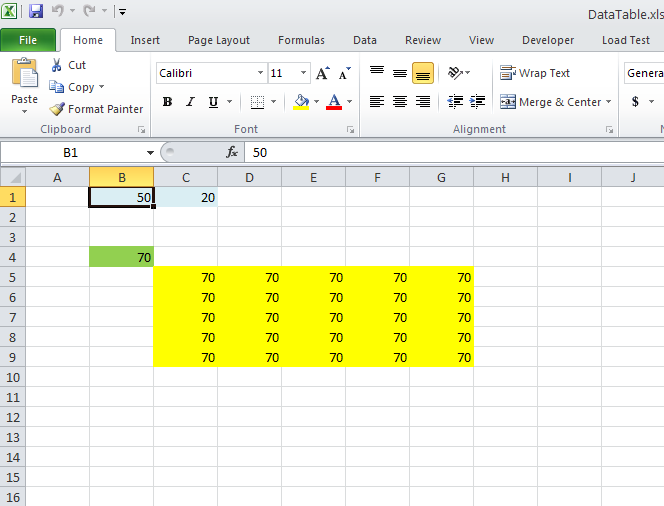
In the following sample code, we used this source Excel file, which is also shown in the image below.
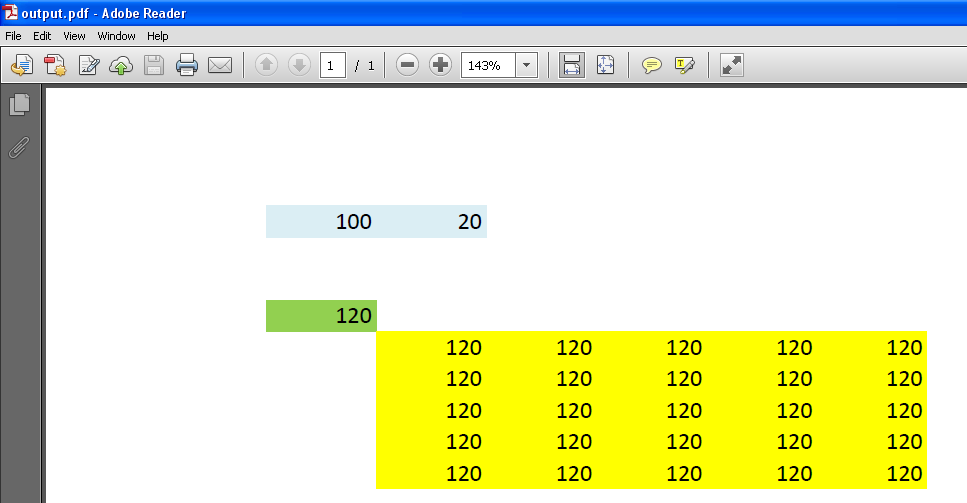
If you change the value of cell B1 to 100, the values of the data table that are filled with yellow color will become 120. The sample code generates the output PDF, which shows 120 as the values in the data table, as shown in this image.
Here is the sample code used to generate the output PDF from the source Excel file. Please read the comments for more information.
Analyzing your prompt, please hold on...
An error occurred while retrieving the results. Please refresh the page and try again.