动态生成带有精美图表的格式化 Excel 报告
概述
某些 Web 场景需要报告和演示,它们是可以很好地协同工作的部分或对象的组合。本文解释了以所见即所得的方式动态设计和生成时尚的 Excel 报告是多么容易。它将数据从 XML 文件(您也可以使用其他数据源)导出到 Aspose.Cells.GridWeb 控件,它为您提供真实的环境,允许您将丰富且吸引人的格式应用于数据并计算公式结果,如 MS Excel。它还使用 Worksheet 源数据生成复杂的图表Aspose.Cells组件并将图表图像粘贴到销售报告中。最后,使用Aspose.Cells组件将附有图表的excel报告保存到磁盘。
本文包含此类功能的源代码和功能齐全的演示项目。
它允许用户对如何创建业务报告有详细的了解,将数据输入到网格的工作表中,并对行和列中的单元格应用一些格式,在保存之前嵌入基于数据源范围的图表excel 报告到磁盘。
Aspose 组件
我用三个Aspose的组件轻松执行任务。Aspose , .NET 和Java Component Publisher,提供各种功能丰富的组件。Aspose提供大量 .NET 和 Java 组件。这些产品受到全球数以千计客户的信赖,包括文件格式组件、报告产品、可视化组件和实用程序组件,允许以编程方式打开、修改、生成、保存、合并、转换等各种格式的文档,包括 DOC、RTF、WordML、 HTML、PDF、XLS、SpreadsheetML、Tab Delimited、CSV、PPT、SWF、EMF、WMF、MPX、MPD等格式。
我想借此机会向您介绍在这个任务中使用的三个组件。
Aspose.Cells 网格控件
Aspose.Cells 网格控件是一个完整的网格解决方案。 Aspose.Cells 网格控件与两个不同的 GUI .NET 组件(Aspose.Cells.GridDesktop 和 Aspose.Cells.GridWeb)打包在一起:一个用于支持桌面应用程序,另一个用于支持 Web 应用程序。两个版本同样匹配,以便在任一平台上轻松实现。 Aspose.Cells.GridWeb 提供从 Excel 电子表格导入和导出的功能。因此任何熟悉 Excel 的人(甚至最终用户)都可以设计网格的外观。 Aspose.Cells.GridWeb 还提供易于使用、功能丰富的 API,它使开发人员可以完全控制其网格的外观、感觉和行为。要了解有关该产品、其功能和程序员指南的更多信息,请查看功能列表摘要、Aspose.Cells。GridWeb 文档和在线精选演示
Aspose.Cells
Aspose.Cells是一个 Excel 电子表格报告组件,使您能够读取和写入 Excel 电子表格,而无需使用 Microsoft 在客户端或服务器端安装 Excel。Aspose.Cells是一个功能丰富的组件,提供的不仅仅是基本的数据导出。和Aspose.Cells开发人员可以导出数据,在每个细节和每个级别格式化电子表格,导入图像,导入图表,创建图表,操作图表,流式传输 Excel 数据,以各种格式保存,包括 XLS、CSV、SpreadsheetML、TabDelimited、TXT、XML(Aspose.Pdf集成)等等。Aspose.Cells提供易于使用、功能丰富的API对于程序员。它有一个巨大的功能列表。要了解有关产品及其功能的更多信息以及程序员指南,请查看摘要功能列表, Aspose.Cells 文档和在线特色演示。你可以下载它的评估版是免费的。
设计界面
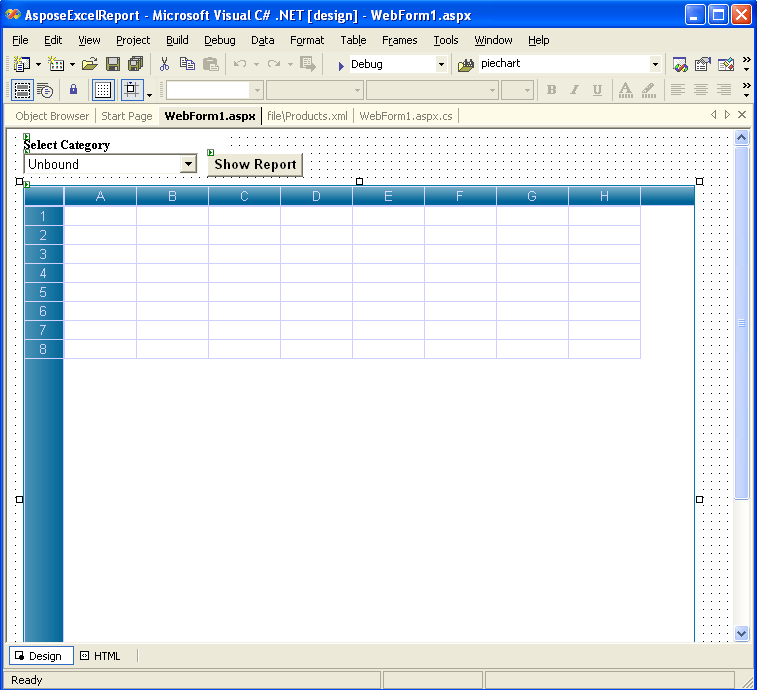
我们开始在 Visual Studio.Net 中创建一个新的 Asp.Net Web 应用程序。
我添加参考首先将三个组件 ieAspose.Cells.GridWeb.dll、Aspose.Chart.dll 和 Aspose.Cells.dll 添加到项目中。我在页面上放置了一些控件并设置了它们的属性,即下拉列表、命令按钮和标签。然后我放置Aspose.Cells.GridWeb****控制(网格网从工具箱添加到它,因为在添加对这三个组件的引用之后,网格网控件出现在工具箱上。其他两个组件(Aspose.Chart和Aspose.Cells只是库,只引用项目。
我还创建了两个文件夹“file”和“images”,分别将“Products.xml”和“chart.gif”添加到这些文件夹中。 xml 文件是一个数据源文件,将从中提取数据以填充网格网工作表。图像文件将为放置在网格网控制。
我现在创建一个自定义命令按钮。我只需右键单击网格网控制并单击“自定义命令按钮…”选项。
它将激活自定义命令按钮编辑器,该编辑器允许您创建带有工具提示的自定义命令图像按钮。我为按钮的某些属性指定值,例如,命令(名称)->“btnChart”,ImageUrl -> 给出图像文件的路径(“chart.gif”)和 ToolTip -> 给出工具提示。
因此,自定义命令按钮已添加,您可能会在以下屏幕截图中看到它(用红色圈出)。
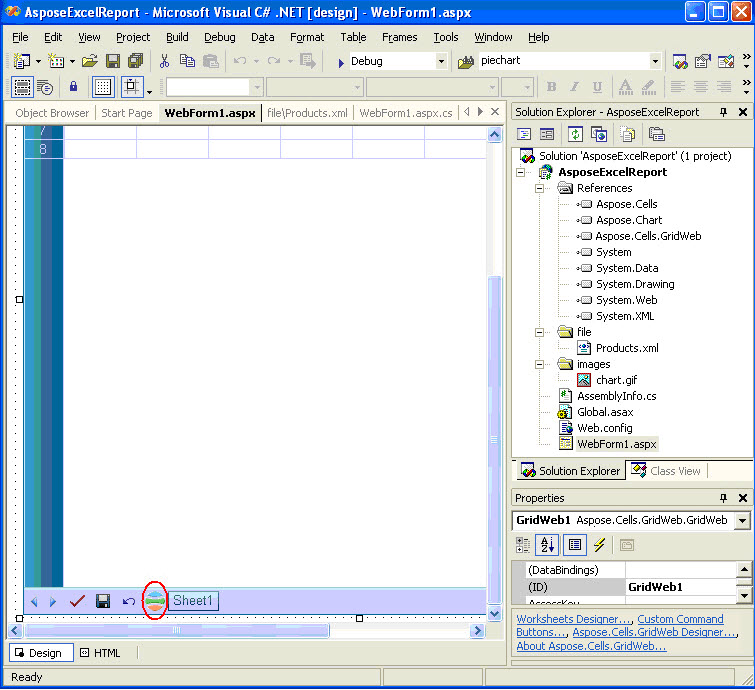 |
|---|
最后,我为标签和命令按钮设置了一些字体属性(粗体)。我还调整控件的大小以获得最终外观。
从 XML 文件中检索数据
以下是项目中使用的 XML 文件结构。
XML文件结构
XML
 <?xml version="1.0" standalone="yes"?>

<SalesData>

  <Products>

    <ProductName>Data</ProductName>

    <QuantityPerUnit>Data</QuantityPerUnit>

    <CategoryName>Data</CategoryName>

    <UnitPrice>Data</UnitPrice>

    <Sale>Data</Sale>

  </Products>

 .........

</SalesData>
 private void Page_Load(object sender, System.EventArgs e)

{

if (!IsPostBack)

{

	// Uncomment the code below when you have purchased license

	// for Aspose.Cells.GridWeb, Aspose.Chart and Aspose.Cells. You need

	// to deploy the licenses in the same folder as your executable,

      // alternatively you can add the license files as an embedded

      // resource to your project.

	//

	// Set the license for Aspose.Cells.GridWeb

	// Aspose.Cells.GridWeb.License gridwebLicense = new

	// Aspose.Cells.GridWeb.License();

	// gridwebLicense.SetLicense("Aspose.Grid.lic");

	//

	// // Set the license for Aspose.Chart

	// Aspose.Chart.License chartLicense = new

	// Aspose.Chart.License();

	// chartLicense.SetLicense("Aspose.Chart.lic");

	//

	// // Set the license for Aspose.Cells

	// Aspose.Cells.License cellsLicense = new

	// Aspose.Cells.License();

	// cellsLicense.SetLicense("Aspose.Cells.lic");

	//Create a DataSet object.

	DataSet ds = new DataSet();

	//Get the Virtual Folder Path.

	string path = MapPath(".");

	//Reads XML data from xml file into DataSet object.

	ds.ReadXml(path + "\\file\\Products.xml");

	//Call the custom method to obtain distinct values from

	//CategoryName field and store data into an object array.

	object [] drs = GetDistinctValues(ds.Tables[0],"CategoryName");

	//Fill the drop down list with distinct field items.

	for(int i = 0;i<drs.Length;i++)

	{

		DropDownList1.Items.Add(drs[i].ToString());

	}

}

}

//This method is used to filter distinct values from CategoryName field in the datatable.

private object[]GetDistinctValues(DataTable dtable, string colName)

{

	// Create a Hashtable object.

	Hashtable hTable = new Hashtable();

	// Loop through the datatable rows and add distinct values to

	// Hashtable object minimizing the duplicates in the field.

	foreach (DataRow drow in dtable.Rows)

	if(!hTable.ContainsKey(drow[colName]))

	hTable.Add(drow[colName], string.Empty);

	// Create an object array based on the distinct key values of the Hashtable object.

	object[] objArray = new object[hTable.Keys.Count];

	// Copy the disctinct values to fill the array.

	hTable.Keys.CopyTo(objArray, 0);

	// Return the array object.

	return objArray;

}
用数据填充 Aspose.Cells.GridWeb 控件的工作表
我使用了一些 API 的网格网使用源 XML 文件中的数据填充工作表的控件。我在命令按钮(标记为“显示报告”)的点击事件处理程序中编写代码。数据报告根据从下拉列表中选择的项目进行过滤。
 //Clears datasheets of the GridWeb control.

GridWeb1.WebWorksheets.Clear();

//Create a DataSet object.

DataSet ds = new DataSet();

//Get the Virtual Folder path.

string path = MapPath(".");

//Reads XML data from xml file into DataSet object.

ds.ReadXml(path + "\\file\\Products.xml");

//Create a DataView based on the datatable.

DataView dv = new DataView(ds.Tables[0]);

//Filter data in the DataView object based on the selected drop down list item.

dv.RowFilter = "CategoryName ='" + DropDownList1.SelectedItem.Text + "'";

//Importing data from the filtered DataView object to create and

//fill "Products" Worksheet start from A4 cell.

GridWeb1.WebWorksheets.ImportDataView(dv, null, null,"Products",3,0);
格式化 Cells 中的数据
为了区分工作表上不同类型的信息,为了在工作表上以最佳方式显示数据并使工作表更易于扫描,您可以设置工作表的格式。一种格式表示一种样式并被定义为一组特征,例如字体和字体大小、数字格式、单元格边框、具有纯色背景或特定颜色模式的单元格底纹、缩进、对齐方式和单元格中的文本方向。
我将更多的代码行合并到上面。我放置报告的标题/子标题,对标题、子标题和详细信息单元格进行一些格式化。我还将数字格式应用于两个字段(将货币数字格式设置为 UnitPrice 和 Sale 字段)并使用调整行和列的高度/宽度Aspose.Cells.GridWebAPI.
//在工作表中创建标题单元格 (A1) 并应用格式。

//下面几行输入一个字符串值到单元格,指定

//字体大小,指定水平和垂直对齐设置,设置

//前景色和背景色并合并单元格 (A1:E2)。

WebWorksheet sheet = GridWeb1.WebWorksheets[0];

sheet.Cells["A1"].PutValue("按类别划分的产品销售额");

sheet.Cells["A1"].Style.Font.Size = new FontUnit("20pt");

sheet.Cells["A1"].Style.HorizontalAlign = HorizontalAlign.Center;

sheet.Cells["A1"].Style.VerticalAlign = VerticalAlign.Middle;

sheet.Cells["A1"].Style.BackColor = Color.SkyBlue;

sheet.Cells["A1"].Style.ForeColor = Color.Blue;

sheet.Cells.Merge(0, 0, 2, 5);

//在工作表中创建字幕单元格 (A3) 并应用格式。

//下面几行输入一个字符串值到单元格,指定

//带属性的字体大小,指定水平和垂直对齐

//settings,设置前景色和背景色并合并单元格

//(A3:E3)。

sheet.Cells["A3"].PutValue(DropDownList1.SelectedItem.Text);

sheet.Cells["A3"].Style.Font.Size = new FontUnit("13pt");

sheet.Cells["A3"].Style.Font.Bold = true;

sheet.Cells["A3"].Style.Font.Italic = true;

sheet.Cells["A3"].Style.HorizontalAlign = HorizontalAlign.Left;

sheet.Cells["A3"].Style.VerticalAlign = VerticalAlign.Middle;

sheet.Cells["A3"].Style.BackColor = Color.SeaGreen;

sheet.Cells["A3"].Style.ForeColor = Color.Yellow;

sheet.Cells.Merge(2, 0, 1, 5);

//获取最后一行和最后一列(包含数据)的索引。

int totalrow = sheet.Cells.MaxRow +1;

int totalcol = sheet.Cells.MaxColumn;

//获取工作表Cells集合

WebCells cells = sheet.Cells;

//定义 Cell 对象。

Web细胞;细胞;细胞

//遍历工作表中的数据并格式化两个字段

//货币数字样式。

对于 (int i = 4;i<=totalrow;i++)

{

	//Format the Sale Column.

	cell = cells[i,totalcol];

	cell.PutValue(cell.StringValue,true);

	cell.NumberType = NumberType.Currency1;

	//Format the UnitPrice Column.

	cell = cells[i,totalcol-1];

	cell.PutValue(cell.StringValue,true);

	cell.NumberType = NumberType.Currency1;

}

//Insert the Total row with data, formula and formatting style.

//It will calculate the total Sales of a Category.

cells[totalrow,0].PutValue( DropDownList1.SelectedItem.Text + " Total" );

cells[totalrow,0].Style.Font.Bold = true;

cells[totalrow,totalcol].Formula = "=SUM(E5:E" + totalrow.ToString() + ")";

cells[totalrow,totalcol].Style.Font.Bold = true;

//Specify some Row and Column formattings. It will set row height

//and column width accordingly.

cells.SetRowHeight(2, new Unit("17pt"));

cells.SetColumnWidth(0, new Unit("157pt"));

cells.SetColumnWidth(1, new Unit("106pt"));

cells.SetColumnWidth(2, new Unit("87pt"));

cells.SetColumnWidth(3, new Unit("56pt"));

cells.SetColumnWidth(4, new Unit("50pt"));
使用 Aspose.Cells 组件生成带图形的格式化报告(.XLS 文件)
现在,我将编写一些代码来将带图形的格式化报告保存到磁盘。我利用网格网的救球按钮,网格网的保存命令单击“保存”按钮时会触发事件,因此,我会处理它。在这里,我使用Aspose.Cells组件将格式化报告导出到 MS Excel,生成图表并将其嵌入到输出 excel 文件中。我没有插入图表图像(由Aspose.Chart组件),而是使用 API 创建类似的图表Aspose.Cells这样您就可以根据需要在 MS Excel 中编辑图表。
 //This GridWeb control event is fired when you click on the "Save" button

//of the control. After Clicking this button "File Download" dialog is

//displayed and you may open into MS Excel / save the output excel file //with graph to disk.

private void GridWeb1_SaveCommand(object sender, System.EventArgs e)

{

	//Create MemoryStream object.

	System.IO.MemoryStream ms = new System.IO.MemoryStream();

	//Save the GridWeb's Report to the stream.

	this.GridWeb1.WebWorksheets.SaveToExcelFile(ms);

	//Create a new Workbook.

	Workbook workbook = new Workbook();

	//Open the stream into the Workbook.

	workbook.Open(ms);

	//Call the custom method which creates Chart.

	Workbook book = CellsChart(workbook);

	//Save the excel file displaying "File Download" dialog box.

	book.Save(ms, FileFormatType.Default);

	this.Response.ContentType = "application/vnd.ms-excel";

	this.Response.AddHeader("content-disposition", "attachment; filename=Export.xls");

	this.Response.BinaryWrite(ms.ToArray());

}

//This custom method is used to create the Chart based on the data source

//range in the GridWeb control. In this method we will use Aspose.Cells

//APIs to create the graph which will be saved later into the output //excel file.

private Workbook CellsChart(Workbook workbook)

{

	//Get the first Worksheet.

	Aspose.Cells.Worksheet sheet = workbook.Worksheets[0];

	//Get the Cells collection in the sheet.

	Aspose.Cells.Cells cells = workbook.Worksheets[0].Cells;

	//Get the last row index.

	int maxrow = sheet.Cells.MaxDataRow;

	//Unmerge the cells.

	sheet.Cells.UnMerge(maxrow,0,15,10);

	int chartIndex = 0;

	//Add a new Chart into the sheet's Chart Collection.

chartIndex = sheet.Charts.Add(Aspose.Cells.ChartType.Pie,maxrow,0,maxrow+28,5);

	//Get the Chart object.

	Aspose.Cells.Chart chart = sheet.Charts[chartIndex];

	//Set the Chart Area.

	Aspose.Cells.ChartArea chartarea = chart.ChartArea;

	chartarea.Area.Formatting = FormattingType.Custom;

	chartarea.Border.IsVisible = false;

		chartarea.Area.FillFormat.SetTwoColorGradient(Color.PowderBlue, Color.LightSkyBlue, GradientStyleType.FromCenter,1);

	//Set some properties of Chart Plot Area.

	chart.PlotArea.Area.Formatting = FormattingType.None;

	chart.PlotArea.Border.IsVisible = false;

	//Set properties of Chart Title.

	chart.Title.Text = DropDownList1.SelectedItem.Text + " Sales";

	chart.Title.TextFont.Size = 20;

	//Set properties of NSeries

	int lastdatarow = maxrow-1;

	chart.NSeries.Add("E5:E" + lastdatarow.ToString(), true);

	chart.NSeries.CategoryData = "A5:A" + lastdatarow.ToString();

	//Set the Data Labels in the chart

	Aspose.Cells.DataLabels datalabels;

	for ( int i = 0; i < chart.NSeries.Count ;i ++ )

	{

		datalabels = chart.NSeries[i].DataLabels;

		datalabels.Postion = Aspose.Cells.LabelPositionType.Center;

		datalabels.IsPercentageShown = true;

	}

	//Set the Legend settings.

	Aspose.Cells.Legend legend = chart.Legend;

	legend.Position = Aspose.Cells.LegendPositionType.Bottom;

	legend.Height = 85;

	legend.Width = 330;

	legend.AutoScaleFont = true;

	legend.Border.Color = Color.Blue;

	legend.Area.Formatting = FormattingType.Custom;

	FillFormat fillformat = legend.Area.FillFormat;

	legend.Area.Formatting = FormattingType.None;

	legend.Border.IsVisible = false;

	//Autofit the first column.

	sheet.AutoFitColumn(0);

	//Return the Workbook.

	return workbook;

}
运行应用程序
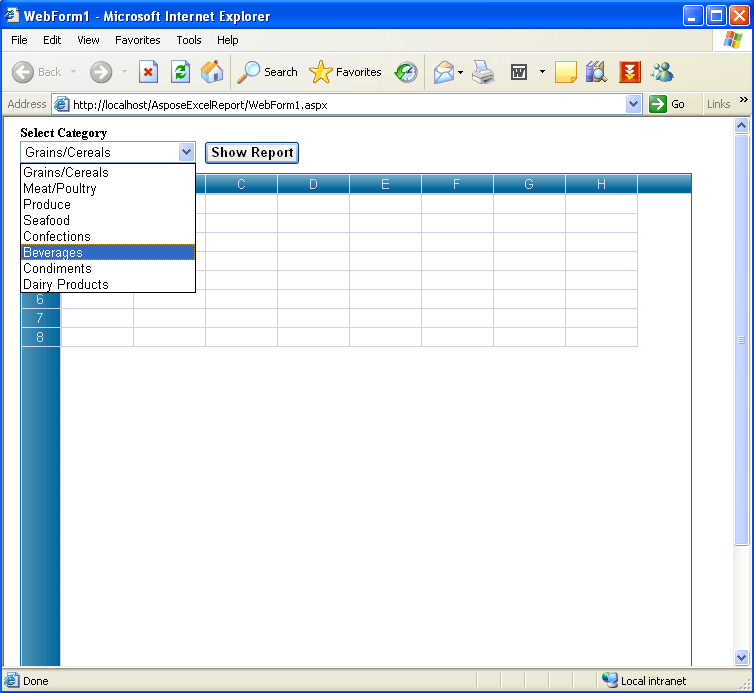
现在,我运行该应用程序。下拉列表中充满了不同的类别。
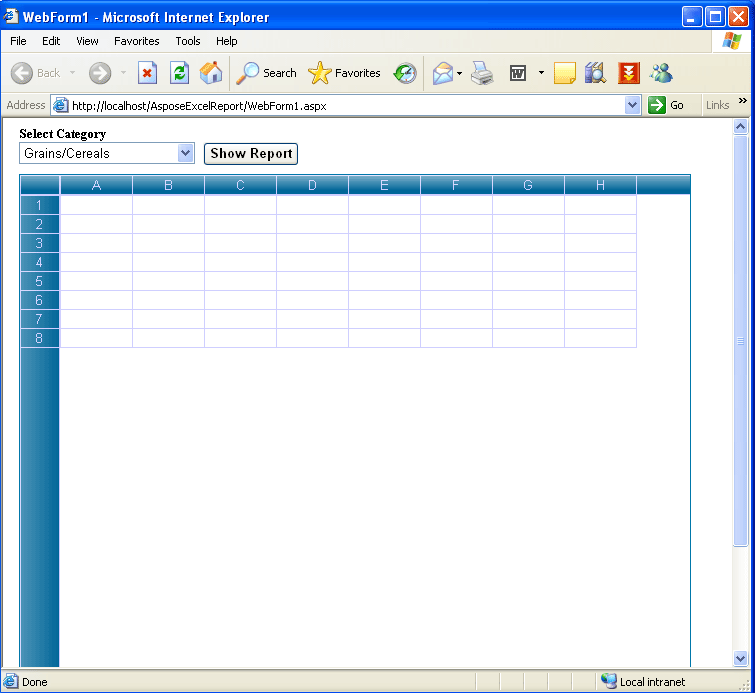
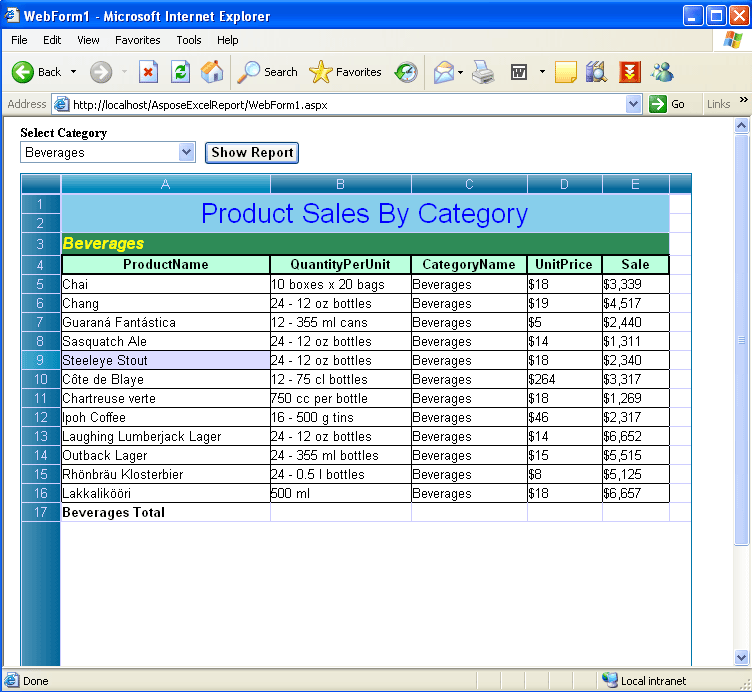
我选择要显示销售报告的类别,然后单击“显示报告”按钮。
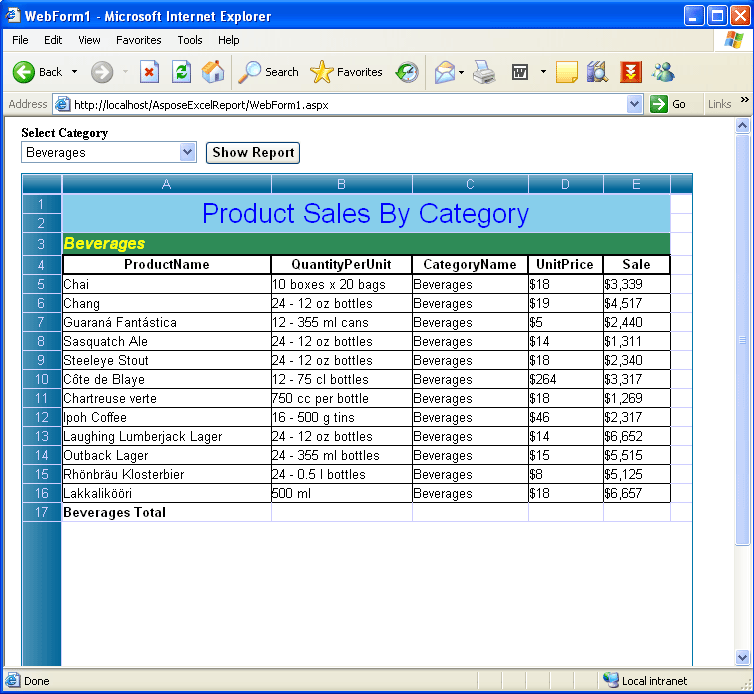
因此,报告显示在网格网基于所选类别。该报告默认根据代码(较早编写)进行格式化。
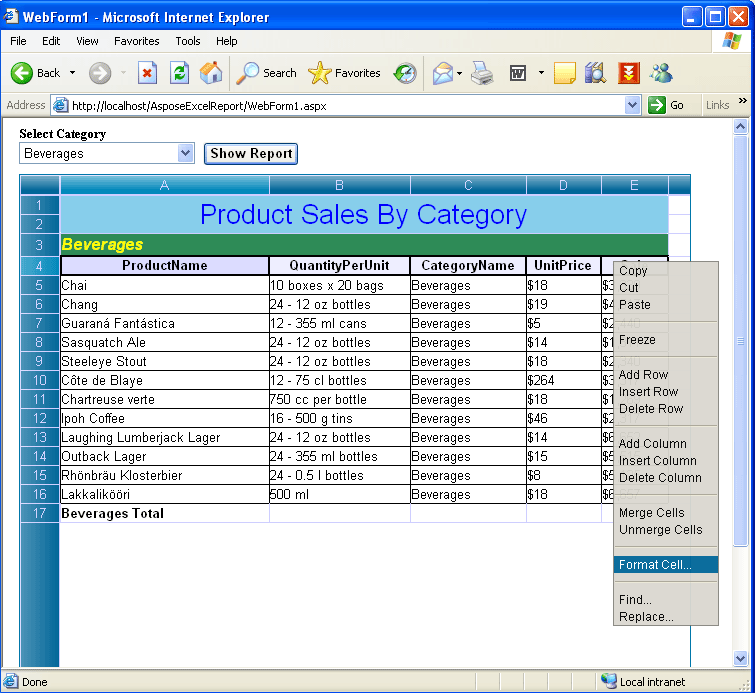
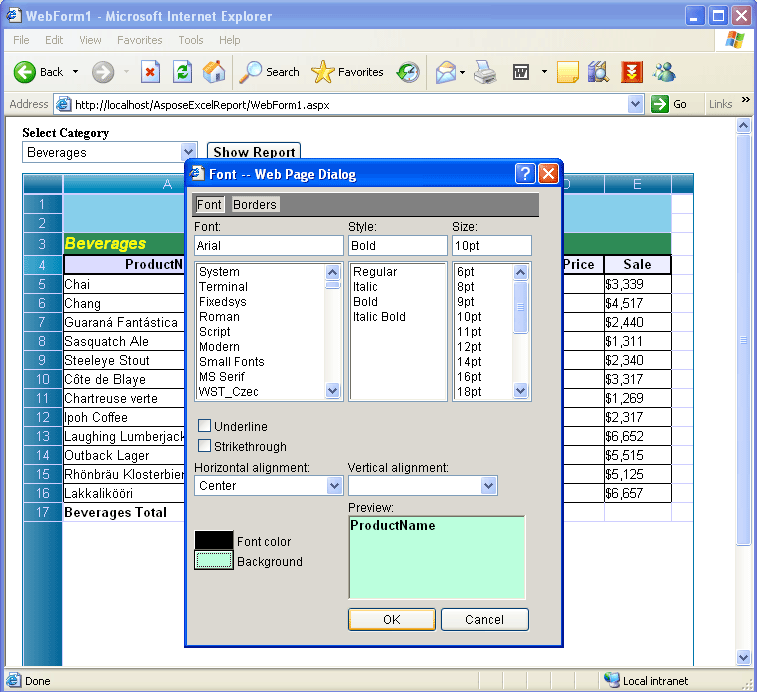
如果你想以所见即所得的方式将数据格式化到某些单元格中,你可以很容易地做到这一点。Aspose.Cells.GridWeb提供格式 Cells编辑器,选择您想要的单元格并右键单击它,单击“格式 Cell …”选项。
显示格式 Cell 对话框。
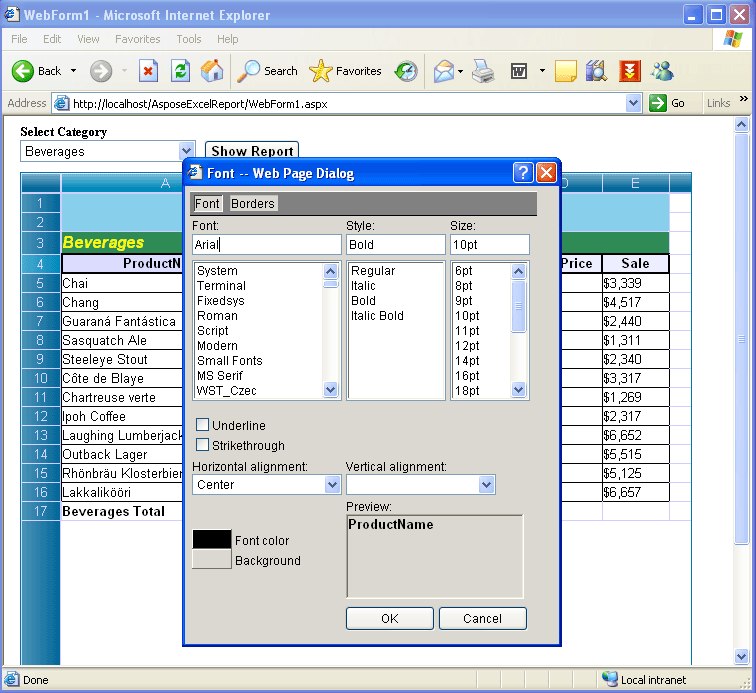
我指定了一些字体属性并单击确定。
并得到结果。
除了单元格格式之外,您还可以编辑单元格值。双击所需的单元格并编辑值。
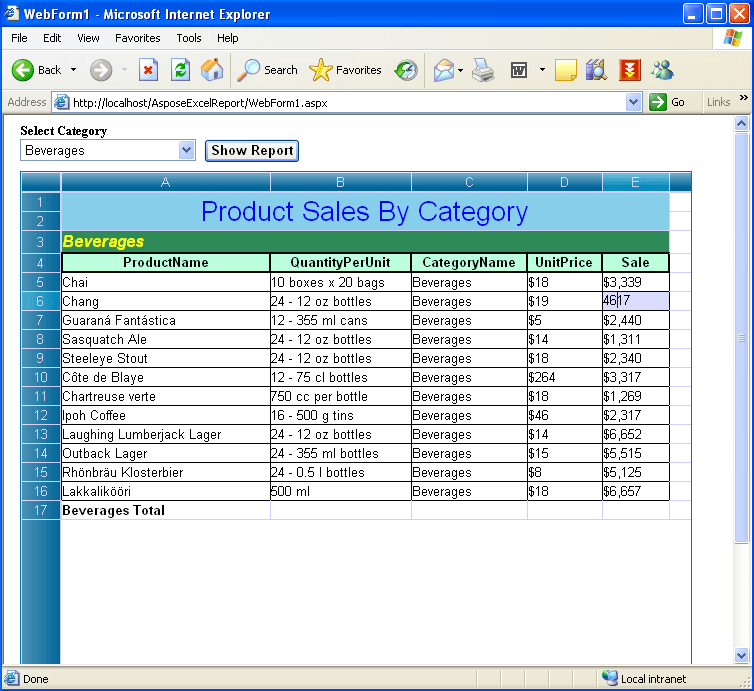
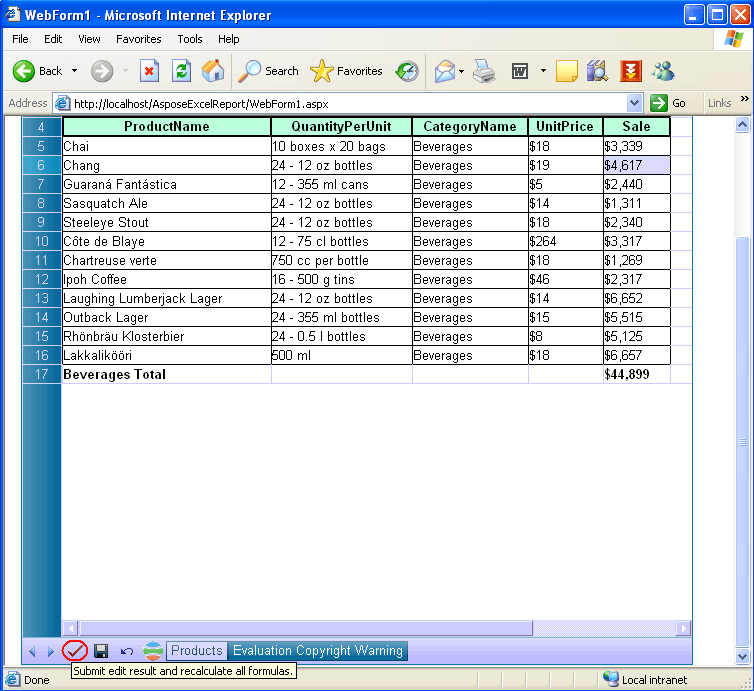
为了提交编辑结果并重新计算所有公式,我单击相关按钮(红色圈出)更新报告。
现在我将创建图表并将其粘贴到控件中。我单击自定义命令按钮(用红色圈出)以根据数据范围创建饼图。
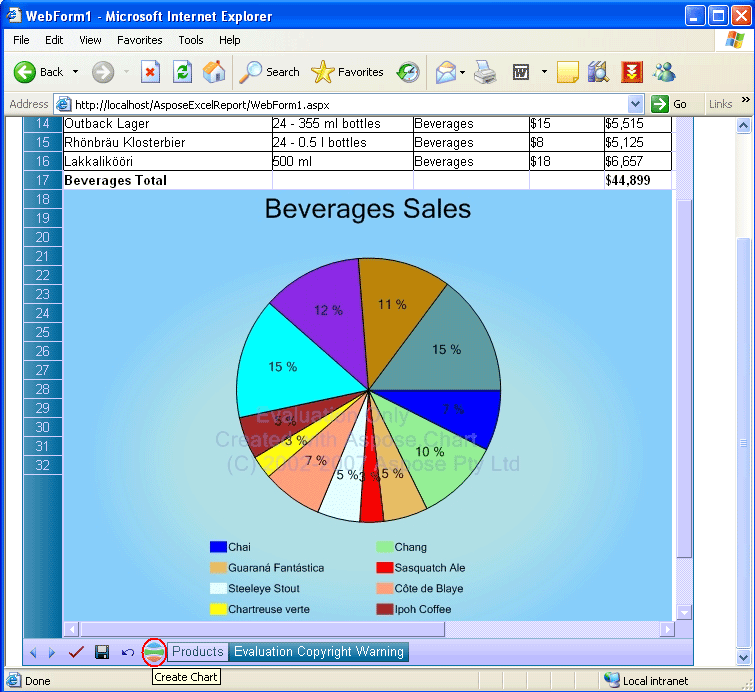
最后,我会将这个带有图表的数据报告导出到 MS Excel。我点击救球按钮(用红色包围)。点击救球按钮将显示文件下载对话,你可以打开将生成的报告(输出带图表的 excel 文件)导入 MS Excel 或将其保存到磁盘。

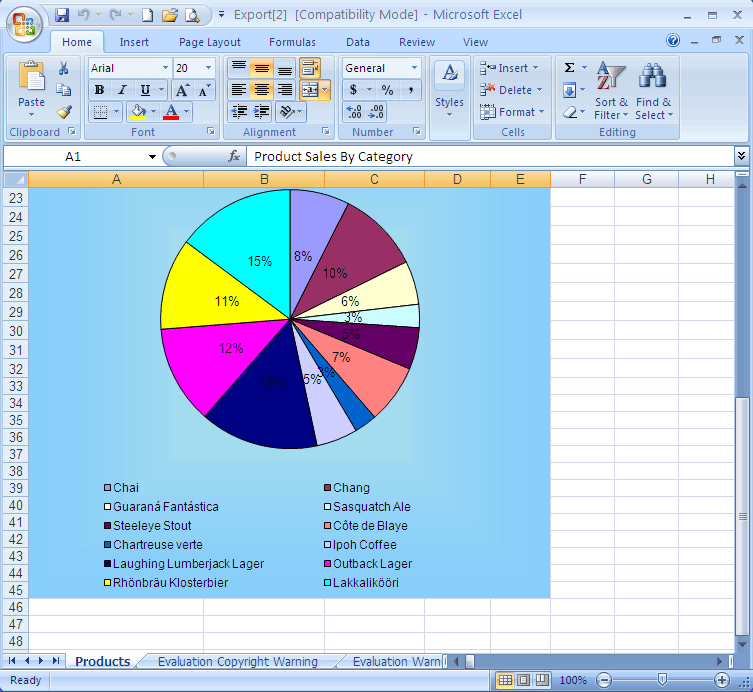
当我单击“打开”按钮(“文件下载”对话框)时,带有图表的 Excel 报告将导出到 MS Excel。显示报告的上半部分。
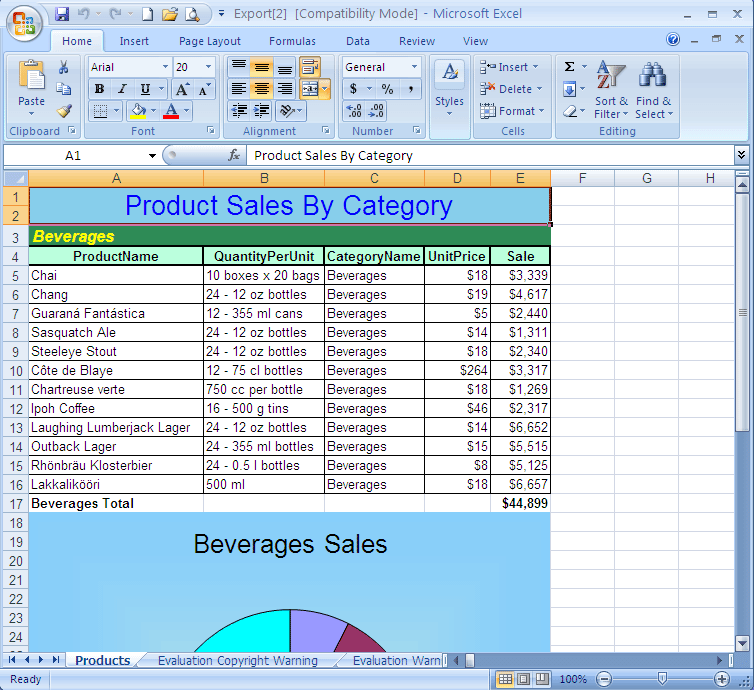
显示 excel 报告的下半部分。