洗練されたグラフを使用して書式設定された Excel レポートを動的に生成する
概要
レポートとプレゼンテーションの両方を必要とする特定の Web シナリオがあります。これは、うまく連携できるパーツまたはオブジェクトの組み合わせです。この記事では、WYSIWYG 方式でスタイリッシュな Excel レポートを動的に設計および生成することがいかに簡単かを説明しています。 XML ファイル (他のデータ ソースを利用することもできます) から Aspose.Cells.GridWeb コントロールにデータをエクスポートします。これにより、リッチで魅力的な形式をデータに適用し、MS Excel のような式の結果を計算できる実際の環境が提供されます。また、ワークシートのソース データに基づいて洗練されたグラフを生成します。Aspose.Cellsコンポーネントを作成し、チャート イメージを販売レポートに貼り付けます。最後に、グラフが添付された Excel レポートが Aspose.Cells コンポーネントを使用してディスクに保存されます。
この記事には、そのような機能のソース コードとフル機能のデモ プロジェクトが含まれています。
これにより、ビジネス レポートの作成方法に関する詳細な認識を持つユーザーは、グリッドのワークシートにデータを入力し、行と列のセルに書式設定を適用し、データを保存する前にデータのソース範囲に基づいてグラフを埋め込むことができます。ディスクへの Excel レポート。
Aspose コンポーネント
の3つを使っていますAsposeのコンポーネントを使用してタスクを簡単に実行できます。Aspose 、.NET および Java Component Publisher は、さまざまな機能豊富なコンポーネントを提供します。Aspose .NET および Java コンポーネントの優れたラインを提供します。世界中の何千もの顧客から信頼されている製品には、ファイル形式コンポーネント、レポート製品、ビジュアル コンポーネント、ユーティリティ コンポーネントが含まれており、DOC、RTF、WordML、 HTML、PDF、XLS、SpreadsheetML、タブ区切り、CSV、PPT、SWF、EMF、WMF、MPX、MPD およびその他の形式。
この機会に、このクエストで使用された 3 つのコンポーネントを紹介します。
Aspose.Cells グリッド コントロール
Aspose.Cells グリッド コントロールは、トータル グリッド ソリューションです。 Aspose.Cells グリッド コントロールには、2 つの異なる GUI .NET コンポーネント (Aspose.Cells.GridDesktop および Aspose.Cells.GridWeb) がパッケージされています。1 つはデスクトップ アプリケーションをサポートし、もう 1 つは Web アプリケーションをサポートします。どちらのプラットフォームでも簡単に実装できるように、両方のバージョンが等しく一致しています。 Aspose.Cells.GridWeb は、Excel スプレッドシートからインポートおよびエクスポートする機能を提供します。そのため、Excel に精通している人なら誰でも (エンド ユーザーであっても)、グリッドのルック アンド フィールをデザインできます。 Aspose.Cells.GridWeb は、使いやすく機能豊富な API も提供します。これにより、開発者はグリッドのルック、フィール、および動作を完全に制御できます。製品、その機能、およびプログラマー ガイドの詳細については、機能リストの概要、Aspose.Cells.GridWeb ドキュメント、およびオンラインの機能を確認してください。デモ
Aspose.Cells
Aspose.CellsMicrosoft Excel をクライアント側またはサーバー側にインストールすることなく、Excel スプレッドシートの読み書きを可能にする Excel スプレッドシート レポート コンポーネントです。Aspose.Cellsは、基本的なデータのエクスポート以上の機能を提供する豊富な機能を備えたコンポーネントです。とAspose.Cells開発者は、データのエクスポート、あらゆる詳細およびあらゆるレベルでのスプレッドシートの書式設定、画像のインポート、チャートのインポート、チャートの作成、チャートの操作、Excel データのストリーミング、XLS、CSV、SpreadsheetML、TabDelimited、TXT、XML などのさまざまなフォーマットでの保存を行うことができます (Aspose.Pdf統合) など。Aspose.Cells使いやすく、豊富な機能を提供しますAPIプログラマー向け。機能の膨大なリストがあります。製品、その機能、およびプログラマー ガイドの詳細については、次の概要を確認してください。機能一覧, Aspose.Cells ドキュメンテーションおよびオンライン特集デモ。してもいいですダウンロードその評価版は無料です。
インターフェイスの設計
Visual Studio.Net で新しい Asp.Net Web アプリケーションの作成を開始します。
私参照を追加 つのコンポーネント ieAspose.Cells.GridWeb.dll、Aspose.Chart.dll、および Aspose.Cells.dll を最初にプロジェクトに追加します。ページにいくつかのコントロールを配置し、ドロップダウン リスト、コマンド ボタン、ラベルなどのプロパティを設定します。次に配置しますAspose.Cells.GridWeb****コントロール(グリッドウェブをツールボックスから追加します。これは、3 つのコンポーネントへの参照を追加した後、グリッドウェブコントロールがツールボックスに表示されます。他の 2 つのコンポーネント (Aspose.ChartとAspose.Cellsは単なるライブラリであり、プロジェクトへの参照のみを取得します。
また、「file」と「images」という 2 つのフォルダーを作成し、これらのフォルダーにそれぞれ「Products.xml」と「chart.gif」を追加します。 xml ファイルは、データを抽出してデータを埋めるデータ ソース ファイルです。グリッドウェブワークシート。イメージ ファイルは、グリッドウェブコントロール。
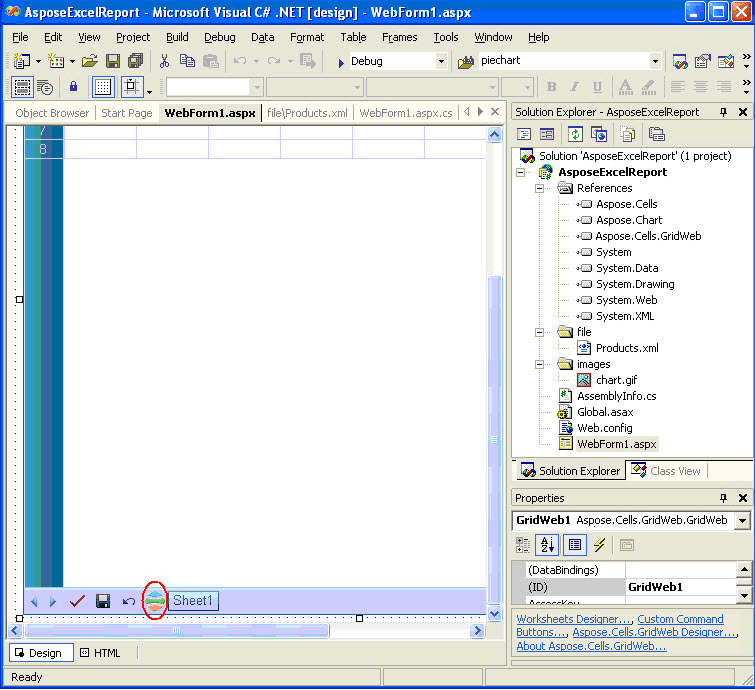
ここで、カスタム コマンド ボタンを作成します。私は単に右クリックしますグリッドウェブコントロールし、[カスタム コマンド ボタン…] オプションをクリックします。
カスタム コマンド ボタン エディターがアクティブになります。このエディターを使用すると、ツール ヒントが添付されたカスタム コマンド イメージ ボタンを作成できます。ボタンのいくつかのプロパティの値を指定します。たとえば、Command (Name) ->“btnChart”、ImageUrl -> 画像ファイル (“chart.gif”) へのパスを指定し、ToolTip -> ツール ヒントを指定します。
そのため、次のスクリーン ショットでわかるように、カスタム コマンド ボタンが追加されます (赤い色で囲まれています)。
 |
|---|
最後に、ラベルとコマンド ボタンにいくつかのフォント属性 (太字) を設定します。コントロールのサイズも調整して、最終的な外観を取得します。
XML ファイルからのデータの取得
以下は、プロジェクトで使用される XML ファイル構造です。
XML ファイル構造
XML
 <?xml version="1.0" standalone="yes"?>

<SalesData>

  <Products>

    <ProductName>Data</ProductName>

    <QuantityPerUnit>Data</QuantityPerUnit>

    <CategoryName>Data</CategoryName>

    <UnitPrice>Data</UnitPrice>

    <Sale>Data</Sale>

  </Products>

 .........

</SalesData>
 private void Page_Load(object sender, System.EventArgs e)

{

if (!IsPostBack)

{

	// Uncomment the code below when you have purchased license

	// for Aspose.Cells.GridWeb, Aspose.Chart and Aspose.Cells. You need

	// to deploy the licenses in the same folder as your executable,

      // alternatively you can add the license files as an embedded

      // resource to your project.

	//

	// Set the license for Aspose.Cells.GridWeb

	// Aspose.Cells.GridWeb.License gridwebLicense = new

	// Aspose.Cells.GridWeb.License();

	// gridwebLicense.SetLicense("Aspose.Grid.lic");

	//

	// // Set the license for Aspose.Chart

	// Aspose.Chart.License chartLicense = new

	// Aspose.Chart.License();

	// chartLicense.SetLicense("Aspose.Chart.lic");

	//

	// // Set the license for Aspose.Cells

	// Aspose.Cells.License cellsLicense = new

	// Aspose.Cells.License();

	// cellsLicense.SetLicense("Aspose.Cells.lic");

	//Create a DataSet object.

	DataSet ds = new DataSet();

	//Get the Virtual Folder Path.

	string path = MapPath(".");

	//Reads XML data from xml file into DataSet object.

	ds.ReadXml(path + "\\file\\Products.xml");

	//Call the custom method to obtain distinct values from

	//CategoryName field and store data into an object array.

	object [] drs = GetDistinctValues(ds.Tables[0],"CategoryName");

	//Fill the drop down list with distinct field items.

	for(int i = 0;i<drs.Length;i++)

	{

		DropDownList1.Items.Add(drs[i].ToString());

	}

}

}

//This method is used to filter distinct values from CategoryName field in the datatable.

private object[]GetDistinctValues(DataTable dtable, string colName)

{

	// Create a Hashtable object.

	Hashtable hTable = new Hashtable();

	// Loop through the datatable rows and add distinct values to

	// Hashtable object minimizing the duplicates in the field.

	foreach (DataRow drow in dtable.Rows)

	if(!hTable.ContainsKey(drow[colName]))

	hTable.Add(drow[colName], string.Empty);

	// Create an object array based on the distinct key values of the Hashtable object.

	object[] objArray = new object[hTable.Keys.Count];

	// Copy the disctinct values to fill the array.

	hTable.Keys.CopyTo(objArray, 0);

	// Return the array object.

	return objArray;

}
Aspose.Cells.GridWeb コントロールのワークシートにデータを入力する
私はいくつかの API を使用しますグリッドウェブコントロールを使用して、ソース XML ファイルからのデータをワークシートに入力します。コマンド ボタン (“Show Report” というラベルが付いています) のクリック イベント ハンドラーにコードを記述します。データ レポートは、ドロップダウン リストから選択した項目に基づいてフィルタリングされます。
 //Clears datasheets of the GridWeb control.

GridWeb1.WebWorksheets.Clear();

//Create a DataSet object.

DataSet ds = new DataSet();

//Get the Virtual Folder path.

string path = MapPath(".");

//Reads XML data from xml file into DataSet object.

ds.ReadXml(path + "\\file\\Products.xml");

//Create a DataView based on the datatable.

DataView dv = new DataView(ds.Tables[0]);

//Filter data in the DataView object based on the selected drop down list item.

dv.RowFilter = "CategoryName ='" + DropDownList1.SelectedItem.Text + "'";

//Importing data from the filtered DataView object to create and

//fill "Products" Worksheet start from A4 cell.

GridWeb1.WebWorksheets.ImportDataView(dv, null, null,"Products",3,0);
Cells のデータの書式設定
ワークシート上のさまざまな種類の情報を区別し、ワークシート上のデータを最適に表示し、ワークシートを簡単にスキャンできるようにするには、ワークシートを書式設定します。あフォーマットスタイルを表し、フォントとフォント サイズ、数値形式、セルの境界線、無地の背景色または特定の色パターンによるセルの陰影、インデント、配置、およびセル内のテキストの向きなどの一連の特性として定義されます。
さらにいくつかのコード行を上記に統合します。レポートのタイトル/サブタイトルを配置し、タイトル、サブタイトル、および詳細セルに書式を設定します。また、数値書式を 2 つのフィールドに適用し (通貨の数値書式を UnitPrice フィールドと Sale フィールドに設定)、行と列の高さ/幅を次のように調整します。Aspose.Cells.GridWebAPI.
 //シートにタイトル セル (A1) を作成し、書式を適用します。

//次の行はセルに文字列値を入力し、指定します

//フォント サイズ、水平方向と垂直方向の配置設定を指定、設定

//前景色と背景色と結合セル (A1:E2)。

WebWorksheet シート = GridWeb1.WebWorksheets[0];

sheet.Cells["A1"].PutValue("カテゴリ別商品売上");

sheet.Cells["A1"].Style.Font.Size = new FontUnit("20pt");

sheet.Cells["A1"].Style.HorizontalAlign = HorizontalAlign.Center;

sheet.Cells["A1"].Style.VerticalAlign = VerticalAlign.Middle;

sheet.Cells["A1"].Style.BackColor = Color.SkyBlue;

sheet.Cells["A1"].Style.ForeColor = Color.Blue;

sheet.Cells.Merge(0, 0, 2, 5);

//シートにサブタイトル セル (A3) を作成し、書式を適用します。

//次の行はセルに文字列値を入力し、指定します

// 属性付きのフォント サイズ、水平方向と垂直方向の配置を指定

//設定、前景色と背景色の設定、セルの結合

//(A3:E3).

sheet.Cells["A3"].PutValue(DropDownList1.SelectedItem.Text);

sheet.Cells["A3"].Style.Font.Size = new FontUnit("13pt");

sheet.Cells["A3"].Style.Font.Bold = true;

sheet.Cells["A3"].Style.Font.Italic = true;

sheet.Cells["A3"].Style.HorizontalAlign = HorizontalAlign.Left;

sheet.Cells["A3"].Style.VerticalAlign = VerticalAlign.Middle;

sheet.Cells["A3"].Style.BackColor = Color.SeaGreen;

sheet.Cells["A3"].Style.ForeColor = Color.Yellow;

sheet.Cells.Merge(2, 0, 1, 5);

//最後の行と列 (データを含む) のインデックスを取得します。

int totalrow = sheet.Cells.MaxRow +1;

int totalcol = sheet.Cells.MaxColumn;

// シート Cells コレクションを取得します

WebCells セル = sheet.Cells;

// Cell オブジェクトを定義します。

WebCell セル;

//シート内のデータをループし、次のように 2 つのフィールドをフォーマットします

//通貨番号スタイル。

for (int i = 4;i<=totalrow;i++)

{

	//Format the Sale Column.

	cell = cells[i,totalcol];

	cell.PutValue(cell.StringValue,true);

	cell.NumberType = NumberType.Currency1;

	//Format the UnitPrice Column.

	cell = cells[i,totalcol-1];

	cell.PutValue(cell.StringValue,true);

	cell.NumberType = NumberType.Currency1;

}

//Insert the Total row with data, formula and formatting style.

//It will calculate the total Sales of a Category.

cells[totalrow,0].PutValue( DropDownList1.SelectedItem.Text + " Total" );

cells[totalrow,0].Style.Font.Bold = true;

cells[totalrow,totalcol].Formula = "=SUM(E5:E" + totalrow.ToString() + ")";

cells[totalrow,totalcol].Style.Font.Bold = true;

//Specify some Row and Column formattings. It will set row height

//and column width accordingly.

cells.SetRowHeight(2, new Unit("17pt"));

cells.SetColumnWidth(0, new Unit("157pt"));

cells.SetColumnWidth(1, new Unit("106pt"));

cells.SetColumnWidth(2, new Unit("87pt"));

cells.SetColumnWidth(3, new Unit("56pt"));

cells.SetColumnWidth(4, new Unit("50pt"));
Aspose.Cells コンポーネントを使用して、グラフで書式設定されたレポート (.XLS ファイル) を作成する
ここで、グラフを含む書式設定されたレポートをディスクに保存するためのコードを記述します。私は利用しますグリッドウェブのセーブボタン、グリッドウェブの保存コマンド保存ボタンをクリックするとイベントが発生するので、処理します。ここで、私は使用しますAspose.Cellsコンポーネントを使用して、書式設定されたレポートを MS Excel にエクスポートし、グラフを生成して出力 Excel ファイルに埋め込みます。チャート画像を挿入していません (作成者:Aspose.Chartコンポーネント) の API を使用して同様のチャートを作成します。Aspose.Cells、必要に応じて MS Excel でチャートを編集できるようにします。
 //This GridWeb control event is fired when you click on the "Save" button

//of the control. After Clicking this button "File Download" dialog is

//displayed and you may open into MS Excel / save the output excel file //with graph to disk.

private void GridWeb1_SaveCommand(object sender, System.EventArgs e)

{

	//Create MemoryStream object.

	System.IO.MemoryStream ms = new System.IO.MemoryStream();

	//Save the GridWeb's Report to the stream.

	this.GridWeb1.WebWorksheets.SaveToExcelFile(ms);

	//Create a new Workbook.

	Workbook workbook = new Workbook();

	//Open the stream into the Workbook.

	workbook.Open(ms);

	//Call the custom method which creates Chart.

	Workbook book = CellsChart(workbook);

	//Save the excel file displaying "File Download" dialog box.

	book.Save(ms, FileFormatType.Default);

	this.Response.ContentType = "application/vnd.ms-excel";

	this.Response.AddHeader("content-disposition", "attachment; filename=Export.xls");

	this.Response.BinaryWrite(ms.ToArray());

}

//This custom method is used to create the Chart based on the data source

//range in the GridWeb control. In this method we will use Aspose.Cells

//APIs to create the graph which will be saved later into the output //excel file.

private Workbook CellsChart(Workbook workbook)

{

	//Get the first Worksheet.

	Aspose.Cells.Worksheet sheet = workbook.Worksheets[0];

	//Get the Cells collection in the sheet.

	Aspose.Cells.Cells cells = workbook.Worksheets[0].Cells;

	//Get the last row index.

	int maxrow = sheet.Cells.MaxDataRow;

	//Unmerge the cells.

	sheet.Cells.UnMerge(maxrow,0,15,10);

	int chartIndex = 0;

	//Add a new Chart into the sheet's Chart Collection.

chartIndex = sheet.Charts.Add(Aspose.Cells.ChartType.Pie,maxrow,0,maxrow+28,5);

	//Get the Chart object.

	Aspose.Cells.Chart chart = sheet.Charts[chartIndex];

	//Set the Chart Area.

	Aspose.Cells.ChartArea chartarea = chart.ChartArea;

	chartarea.Area.Formatting = FormattingType.Custom;

	chartarea.Border.IsVisible = false;

		chartarea.Area.FillFormat.SetTwoColorGradient(Color.PowderBlue, Color.LightSkyBlue, GradientStyleType.FromCenter,1);

	//Set some properties of Chart Plot Area.

	chart.PlotArea.Area.Formatting = FormattingType.None;

	chart.PlotArea.Border.IsVisible = false;

	//Set properties of Chart Title.

	chart.Title.Text = DropDownList1.SelectedItem.Text + " Sales";

	chart.Title.TextFont.Size = 20;

	//Set properties of NSeries

	int lastdatarow = maxrow-1;

	chart.NSeries.Add("E5:E" + lastdatarow.ToString(), true);

	chart.NSeries.CategoryData = "A5:A" + lastdatarow.ToString();

	//Set the Data Labels in the chart

	Aspose.Cells.DataLabels datalabels;

	for ( int i = 0; i < chart.NSeries.Count ;i ++ )

	{

		datalabels = chart.NSeries[i].DataLabels;

		datalabels.Postion = Aspose.Cells.LabelPositionType.Center;

		datalabels.IsPercentageShown = true;

	}

	//Set the Legend settings.

	Aspose.Cells.Legend legend = chart.Legend;

	legend.Position = Aspose.Cells.LegendPositionType.Bottom;

	legend.Height = 85;

	legend.Width = 330;

	legend.AutoScaleFont = true;

	legend.Border.Color = Color.Blue;

	legend.Area.Formatting = FormattingType.Custom;

	FillFormat fillformat = legend.Area.FillFormat;

	legend.Area.Formatting = FormattingType.None;

	legend.Border.IsVisible = false;

	//Autofit the first column.

	sheet.AutoFitColumn(0);

	//Return the Workbook.

	return workbook;

}
アプリケーションの実行
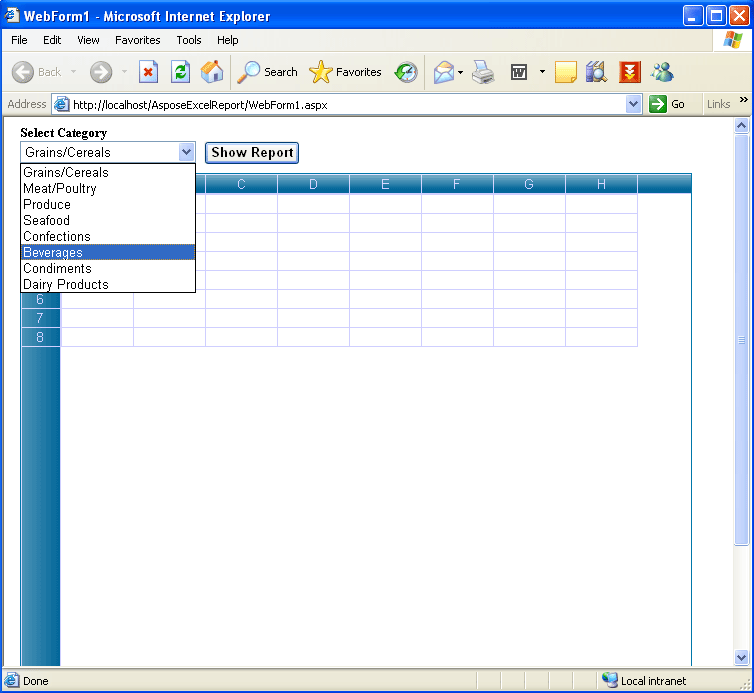
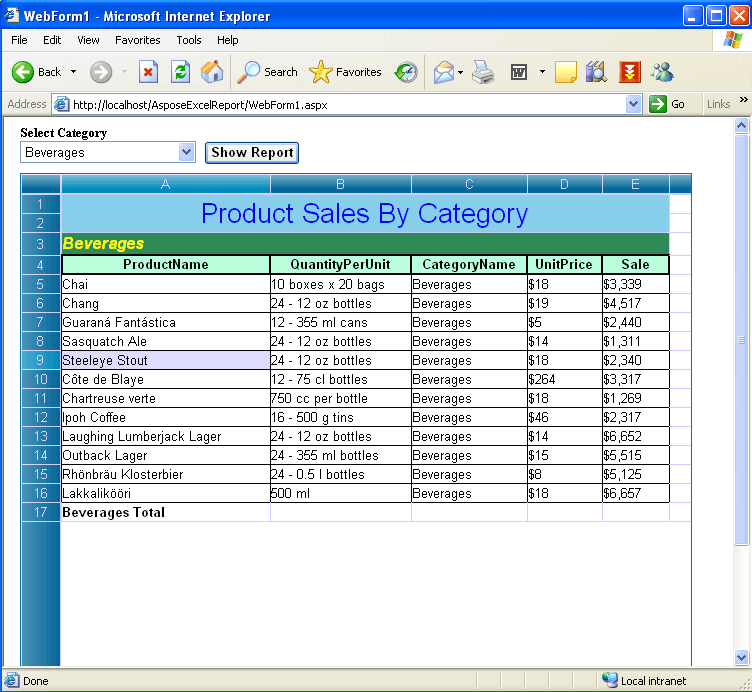
次に、アプリケーションを実行します。ドロップダウン リストには、個別のカテゴリが表示されます。
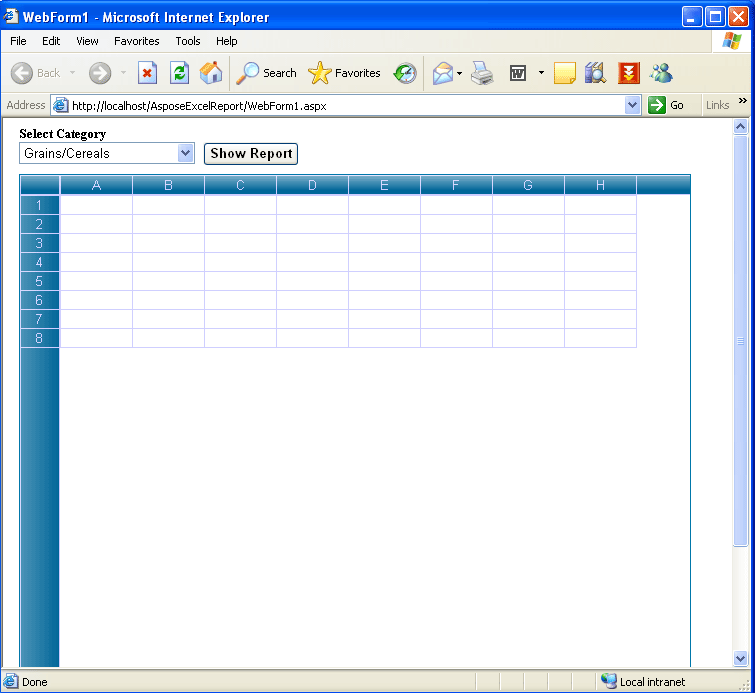
販売レポートを表示するカテゴリを選択し、[レポートを表示] ボタンをクリックします。
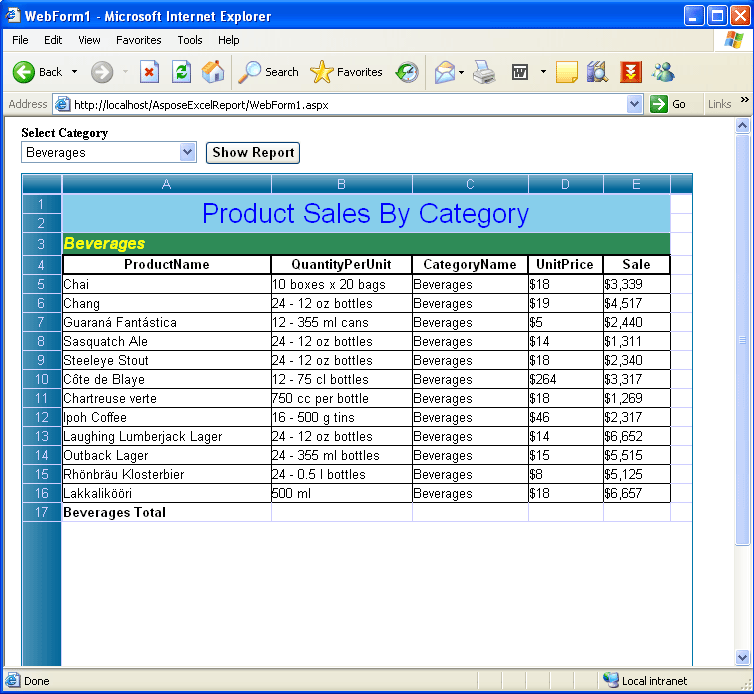
そのため、レポートはグリッドウェブ選択したカテゴリに基づいています。レポートは、コード (以前に記述) に基づいて既定で書式設定されます。
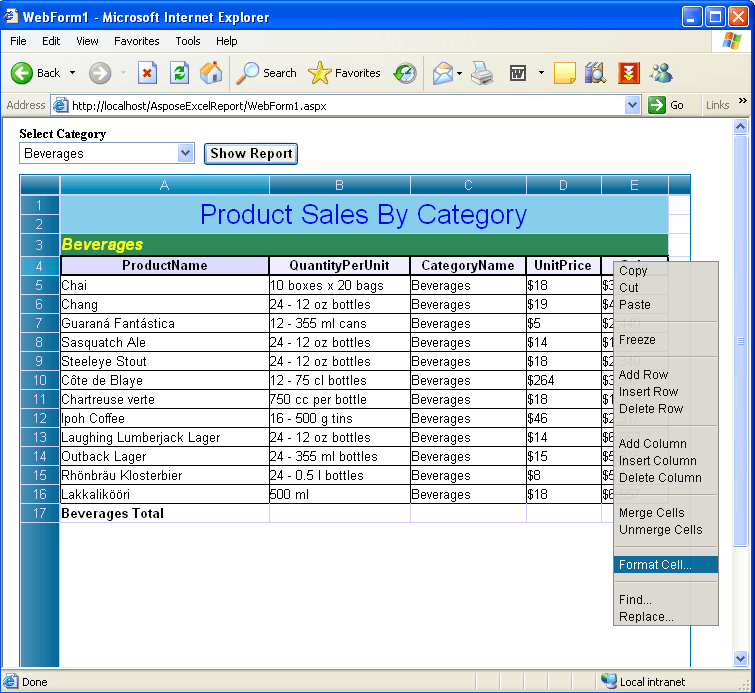
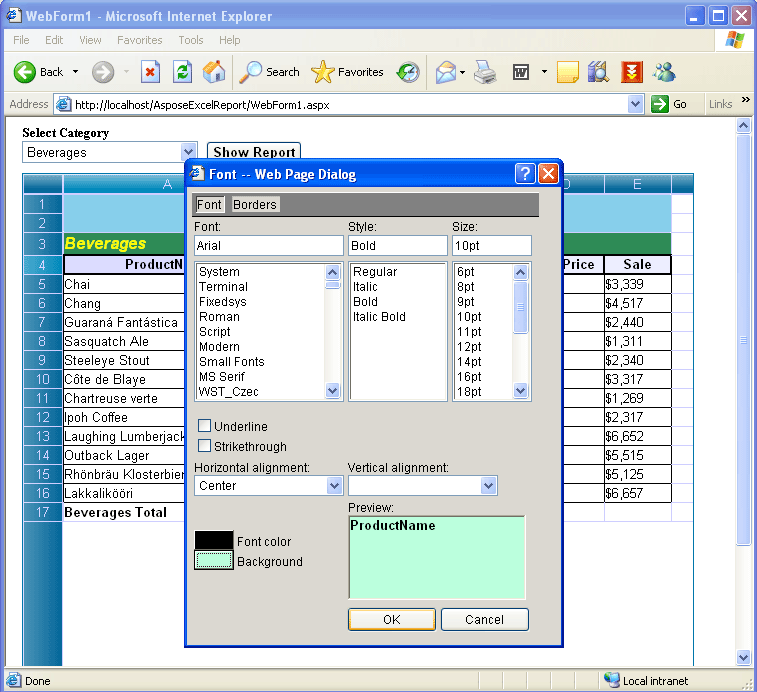
WYSIWYG 方式で一部のセルにデータをフォーマットする場合は、非常に簡単に行うことができます。Aspose.Cells.GridWeb提供しますフォーマット Cellsエディターで、目的のセルを選択して右クリックし、[フォーマット Cell…] オプションをクリックします。
フォーマット Cell ダイアログが表示されます。
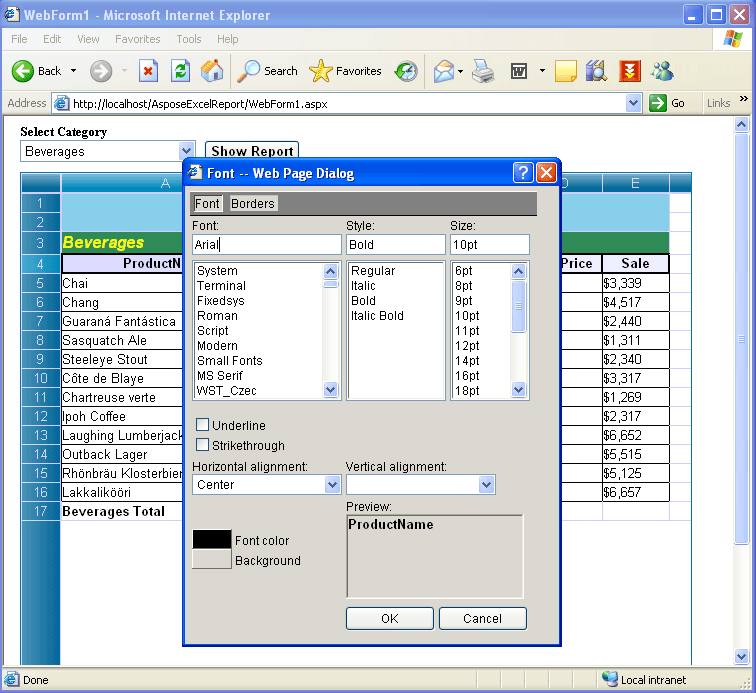
いくつかのフォント属性を指定して、[OK] をクリックします。
そして結果を得る。
セルの書式設定とは別に、セルの値を編集することもできます。目的のセルをダブルクリックして、値を編集します。
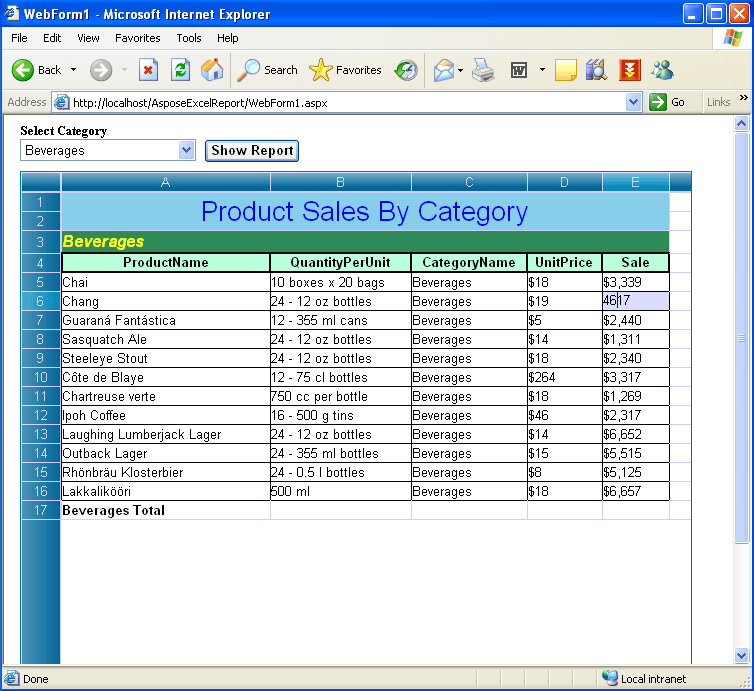
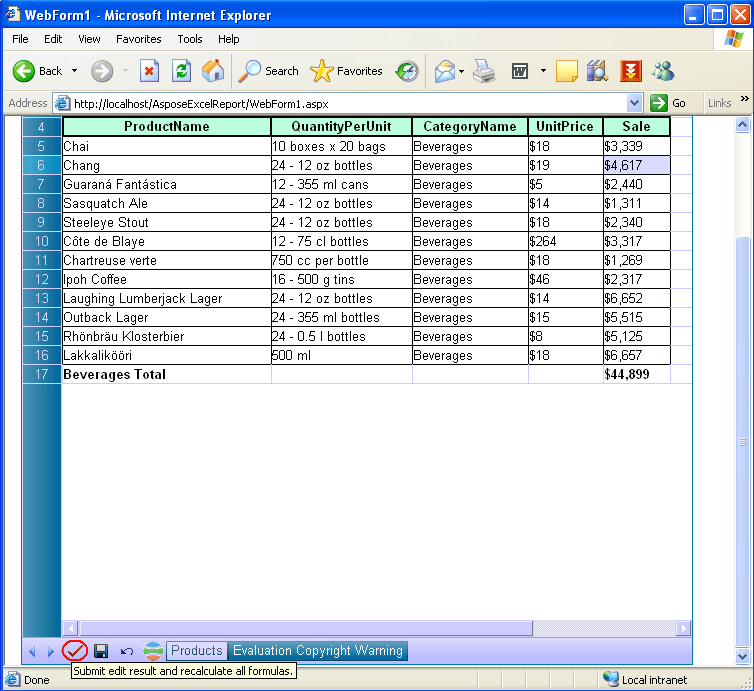
編集結果を送信し、すべての式を再計算するには、関連するボタン (赤い丸で囲んだ部分) をクリックしてレポートを更新します。
次に、グラフを作成してコントロールに貼り付けます。カスタム コマンド ボタン (赤い丸で囲んだ部分) をクリックして、データ範囲に基づいて円グラフを作成します。
最後に、このデータ レポートをグラフと共に MS Excel にエクスポートします。私はセーブボタン (赤い色で囲まれています)。をクリックするとセーブボタンが表示されますファイルのダウンロードダイアログで、次のいずれかを実行できます開ける結果のレポート (グラフを含む出力 Excel ファイル) を MS Excel に出力するか、ディスクに保存します。
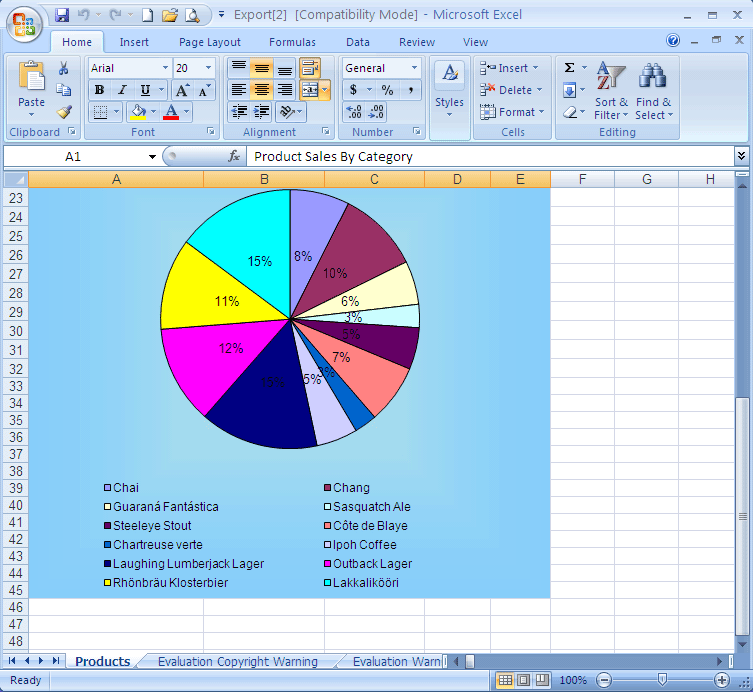
[開く] ボタン ([ファイルのダウンロード] ダイアログ) をクリックすると、グラフ付きの Excel レポートが MS Excel にエクスポートされます。レポートの上部が表示されます。
Excel レポートの下部が表示されます。