Manage Chart Data Series in Presentations Using С++
Overview
This article describes the role of ChartSeries in Aspose.Slides, focusing on how data is structured and visualized within presentations. These objects provide the foundational elements that define individual sets of data points, categories, and appearance parameters in a chart. By working with ChartSeries, developers can seamlessly integrate underlying data sources and maintain full control over how information is displayed, resulting in dynamic, data-driven presentations that clearly convey insights and analysis.
A series is a row or column of numbers plotted in a chart.
Set the Data Series Overlap
With the IChartSeries::get_Overlap() method, you can specify how much bars and columns should overlap on a 2D chart (range: -100 to 100). This property applies to all series of the parent series group: this is a projection of the appropriate group property.
Use the get_ParentSeriesGroup()::set_Overlap() method to set your preferred value for Overlap.
- Create an instance of the Presentation class.
- Add a clustered column chart on a slide.
- Access the first chart series.
- Access the chart series'
ParentSeriesGroupand set your preferred overlap value for the series. - Write the modified presentation to a PPTX file.
This C++ code shows you how to set the overlap for a chart series:
auto presentation = System::MakeObject<Presentation>();
auto shapes = presentation->get_Slides()->idx_get(0)->get_Shapes();

// Adds chart
auto chart = shapes->AddChart(ChartType::ClusteredColumn, 50.0f, 50.0f, 600.0f, 400.0f, true);
auto series = chart->get_ChartData()->get_Series();
if (series->idx_get(0)->get_Overlap() == 0)
{
    // Sets series overlap
    series->idx_get(0)->get_ParentSeriesGroup()->set_Overlap(-30);
}

// Writes the presentation file to disk
presentation->Save(u"SetChartSeriesOverlap_out.pptx", SaveFormat::Pptx);
Change the Data Series Color
Aspose.Slides for C++ allows you to change a series' color this way:
- Create an instance of the Presentation class.
- Add chart on the slide.
- Access the series whose color you want to change.
- Set your preferred fill type and fill color.
- Save the modified presentation.
This C++ code shows you how to change a series' color:
auto pres = System::MakeObject<Presentation>(u"test.pptx");
auto shapes = pres->get_Slides()->idx_get(0)->get_Shapes();

auto chart = shapes->AddChart(ChartType::Pie, 50.0f, 50.0f, 600.0f, 400.0f);
auto point = chart->get_ChartData()->get_Series()->idx_get(0)->get_DataPoints()->idx_get(1);

point->set_Explosion(30);
point->get_Format()->get_Fill()->set_FillType(FillType::Solid);
point->get_Format()->get_Fill()->get_SolidFillColor()->set_Color(Color::get_Blue());

pres->Save(u"output.pptx", SaveFormat::Pptx);
Change the Color of a Data Series Category
Aspose.Slides for C++ allows you to change a series category’s color this way:
- Create an instance of the Presentation class.
- Add chart on the slide.
- Access the series category whose color you want to change.
- Set your preferred fill type and fill color.
- Save the modified presentation.
This code in C++ shows you how to change a series category’s color:
auto pres = System::MakeObject<Presentation>();
auto shapes = pres->get_Slides()->idx_get(0)->get_Shapes();
auto chart = shapes->AddChart(ChartType::ClusteredColumn, 50.0f, 50.0f, 600.0f, 400.0f);
auto point = chart->get_ChartData()->get_Series()->idx_get(0)->get_DataPoints()->idx_get(0);

point->get_Format()->get_Fill()->set_FillType(FillType::Solid);
point->get_Format()->get_Fill()->get_SolidFillColor()->set_Color(Color::get_Blue());

pres->Save(u"output.pptx", SaveFormat::Pptx);
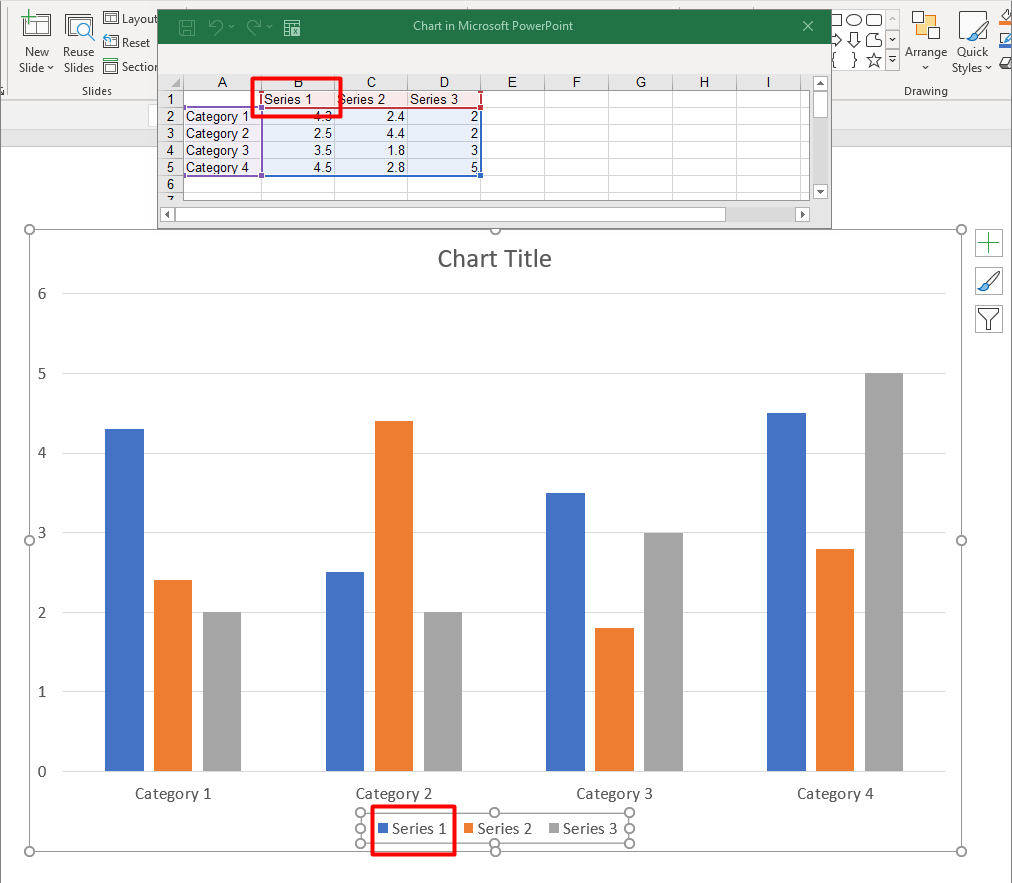
Change the Data Series Name
By default, the legend names for a chart are the contents of cells above each column or row of data.
In our example (sample image),
- the columns are Series 1, Series 2, and Series 3;
- the rows are Category 1, Category 2, Category 3, and Category 4.
Aspose.Slides for C++ allows you to update or change a series name in its chart data and legend.
This C++ code shows you how to change a series' name in its chart data ChartDataWorkbook:
auto pres = System::MakeObject<Presentation>();

auto shapes = pres->get_Slides()->idx_get(0)->get_Shapes();
auto chart = shapes->AddChart(ChartType::Column3D, 50.0f, 50.0f, 600.0f, 400.0f, true);

auto seriesCell = chart->get_ChartData()->get_ChartDataWorkbook()->GetCell(0, 0, 1);
seriesCell->set_Value(ObjectExt::Box<String>(u"New name"));

pres->Save(u"pres.pptx", SaveFormat::Pptx);
This C++ code shows you how to change a series name in its legend throughSeries:
auto pres = System::MakeObject<Presentation>();
auto shapes = pres->get_Slides()->idx_get(0)->get_Shapes();

auto chart = shapes->AddChart(ChartType::Column3D, 50.0f, 50.0f, 600.0f, 400.0f, true);
auto series = chart->get_ChartData()->get_Series()->idx_get(0);

auto name = series->get_Name();
name->get_AsCells()->idx_get(0)->set_Value(ObjectExt::Box<String>(u"New name"));
Set the Data Series Fill Color
Aspose.Slides for C++ allows you to set the automatic fill color for chart series inside a plot area this way:
- Create an instance of the Presentation class.
- Obtain a slide’s reference by its index.
- Add a chart with default data based on your preferred type (in the example below, we used
ChartType::ClusteredColumn). - Access the chart series and set the fill color to Automatic.
- Save the presentation to a PPTX file.
This C++ code shows you how to set the automatic fill color for a chart series:
auto presentation = System::MakeObject<Presentation>();
auto shapes = presentation->get_Slides()->idx_get(0)->get_Shapes();

// Creates a clustered column chart
auto chart = shapes->AddChart(ChartType::ClusteredColumn, 100.0f, 50.0f, 600.0f, 400.0f);

// Sets series fill format to automatic
for (const auto& series : chart->get_ChartData()->get_Series())
{
    series->GetAutomaticSeriesColor();
}

// Writes the presentation file to disk
presentation->Save(u"AutoFillSeries_out.pptx", SaveFormat::Pptx);
Set Data Series Invert Fill Colors
Aspose.Slides allows you to set the invert fill color for chart series inside a plot area this way:
- Create an instance of the Presentation class.
- Obtain a slide’s reference by its index.
- Add a chart with default data based on your preferred type (in the example below, we used
ChartType::ClusteredColumn). - Access the chart series and set the fill color to invert.
- Save the presentation to a PPTX file.
This C++ code demonstrates the operation:
Color inverColor = Color::get_Red();

auto pres = System::MakeObject<Presentation>();
auto shapes = pres->get_Slides()->idx_get(0)->get_Shapes();
auto chart = shapes->AddChart(ChartType::ClusteredColumn, 100.0f, 100.0f, 400.0f, 300.0f);

auto workBook = chart->get_ChartData()->get_ChartDataWorkbook();
auto chartData = chart->get_ChartData();

chartData->get_Series()->Clear();
chartData->get_Categories()->Clear();

// Adds new series and categories
chartData->get_Series()->Add(workBook->GetCell(0, 0, 1, ObjectExt::Box<String>(u"Series 1")), chart->get_Type());
chartData->get_Categories()->Add(workBook->GetCell(0, 1, 0, ObjectExt::Box<String>(u"Category 1")));
chartData->get_Categories()->Add(workBook->GetCell(0, 2, 0, ObjectExt::Box<String>(u"Category 2")));
chartData->get_Categories()->Add(workBook->GetCell(0, 3, 0, ObjectExt::Box<String>(u"Category 3")));

// Takes the first chart series and populates its series data.
auto series = chartData->get_Series()->idx_get(0);
series->get_DataPoints()->AddDataPointForBarSeries(workBook->GetCell(0, 1, 1, ObjectExt::Box<int32_t>(-20)));
series->get_DataPoints()->AddDataPointForBarSeries(workBook->GetCell(0, 2, 1, ObjectExt::Box<int32_t>(50)));
series->get_DataPoints()->AddDataPointForBarSeries(workBook->GetCell(0, 3, 1, ObjectExt::Box<int32_t>(-30)));
Color seriesColor = series->GetAutomaticSeriesColor();
series->set_InvertIfNegative(true);
series->get_Format()->get_Fill()->set_FillType(FillType::Solid);
series->get_Format()->get_Fill()->get_SolidFillColor()->set_Color(seriesColor);
series->get_InvertedSolidFillColor()->set_Color(inverColor);
pres->Save(u"SetInvertFillColorChart_out.pptx", SaveFormat::Pptx);
Set Invert Fill Color for a Chart Series
Aspose.Slides allows you to set inverts through theIChartDataPoint::set_InvertIfNegative() and ChartDataPoint.set_InvertIfNegative() methods. When an invert is set using the methods, the data point inverts its colors when it gets a negative value.
This C++ code demonstrates the operation:
auto pres = System::MakeObject<Presentation>();
auto shapes = pres->get_Slides()->idx_get(0)->get_Shapes();
auto chart = shapes->AddChart(ChartType::ClusteredColumn, 50.0f, 50.0f, 600.0f, 400.0f, true);
auto series = chart->get_ChartData()->get_Series();
chart->get_ChartData()->get_Series()->Clear();

auto workBook = chart->get_ChartData()->get_ChartDataWorkbook();
series->Add(workBook->GetCell(0, u"B1"), chart->get_Type());
auto dataPoints = series->idx_get(0)->get_DataPoints();
dataPoints->AddDataPointForBarSeries(workBook->GetCell(0, u"B2", ObjectExt::Box<int32_t>(-5)));
dataPoints->AddDataPointForBarSeries(workBook->GetCell(0, u"B3", ObjectExt::Box<int32_t>(3)));
dataPoints->AddDataPointForBarSeries(workBook->GetCell(0, u"B4", ObjectExt::Box<int32_t>(-2)));
dataPoints->AddDataPointForBarSeries(workBook->GetCell(0, u"B5", ObjectExt::Box<int32_t>(1)));

series->idx_get(0)->set_InvertIfNegative(false);

series->idx_get(0)->get_DataPoints()->idx_get(2)->set_InvertIfNegative(true);

pres->Save(u"out.pptx", SaveFormat::Pptx);
Clear Specific Data Point Values
Aspose.Slides for C++ allows you to clear the DataPoints data for a specific chart series this way:
- Create an instance of the Presentation class.
- Obtain the reference of a slide through its index.
- Obtain the reference of a chart through its index.
- Iterate through all the chart
DataPointsand setXValueandYValueto null. - Clear all
DataPointsfor specific chart series. - Write the modified presentation to a PPTX file.
This C++ code demonstrates the operation:
auto pres = System::MakeObject<Presentation>(u"TestChart.pptx");
auto sl = pres->get_Slides()->idx_get(0);

auto chart = System::ExplicitCast<IChart>(sl->get_Shapes()->idx_get(0));
auto dataPoints = chart->get_ChartData()->get_Series()->idx_get(0)->get_DataPoints();

for (const auto& dataPoint : dataPoints)
{
    dataPoint->get_XValue()->get_AsCell()->set_Value(nullptr);
    dataPoint->get_YValue()->get_AsCell()->set_Value(nullptr);
}

dataPoints->Clear();

pres->Save(u"ClearSpecificChartSeriesDataPointsData.pptx", SaveFormat::Pptx);
Set the Data Series Gap Width
Aspose.Slides for C++ allows you to set a series' Gap Width through the set_GapWidth() method this way:
- Create an instance of the Presentation class.
- Access first slide.
- Add chart with default data.
- Access any chart series.
- Set the
GapWidthproperty. - Write the modified presentation to a PPTX file.
This code in C++ shows you how to set a series' Gap Width:
// Creates empty presentation
auto presentation = System::MakeObject<Presentation>();

// Accesses the presentation's first slide
auto slide = presentation->get_Slides()->idx_get(0);

// Adds a chart with default data
auto chart = slide->get_Shapes()->AddChart(ChartType::StackedColumn, 0.0f, 0.0f, 500.0f, 500.0f);

// Sets the index of the chart data sheet
int32_t worksheetIndex = 0;

// Gets the chart data worksheet
auto workbook = chart->get_ChartData()->get_ChartDataWorkbook();

// Adds series
chart->get_ChartData()->get_Series()->Add(workbook->GetCell(worksheetIndex, 0, 1, ObjectExt::Box<String>(u"Series 1")), chart->get_Type());
chart->get_ChartData()->get_Series()->Add(workbook->GetCell(worksheetIndex, 0, 2, ObjectExt::Box<String>(u"Series 2")), chart->get_Type());

// Adds Categories
chart->get_ChartData()->get_Categories()->Add(workbook->GetCell(worksheetIndex, 1, 0, ObjectExt::Box<String>(u"Category 1")));
chart->get_ChartData()->get_Categories()->Add(workbook->GetCell(worksheetIndex, 2, 0, ObjectExt::Box<String>(u"Category 2")));
chart->get_ChartData()->get_Categories()->Add(workbook->GetCell(worksheetIndex, 3, 0, ObjectExt::Box<String>(u"Category 3")));

// Takes the second chart series
auto series = chart->get_ChartData()->get_Series()->idx_get(1);
auto dataPoints = series->get_DataPoints();

// Populates the series data
dataPoints->AddDataPointForBarSeries(workbook->GetCell(worksheetIndex, 1, 1, ObjectExt::Box<int32_t>(20)));
dataPoints->AddDataPointForBarSeries(workbook->GetCell(worksheetIndex, 2, 1, ObjectExt::Box<int32_t>(50)));
dataPoints->AddDataPointForBarSeries(workbook->GetCell(worksheetIndex, 3, 1, ObjectExt::Box<int32_t>(30)));
dataPoints->AddDataPointForBarSeries(workbook->GetCell(worksheetIndex, 1, 2, ObjectExt::Box<int32_t>(30)));
dataPoints->AddDataPointForBarSeries(workbook->GetCell(worksheetIndex, 2, 2, ObjectExt::Box<int32_t>(10)));
dataPoints->AddDataPointForBarSeries(workbook->GetCell(worksheetIndex, 3, 2, ObjectExt::Box<int32_t>(60)));

// Sets GapWidth value
series->get_ParentSeriesGroup()->set_GapWidth(50);

// Saves presentation to disk
presentation->Save(u"GapWidth_out.pptx", SaveFormat::Pptx);
FAQ
Is there a limit to how many series a single chart can contain?
Aspose.Slides imposes no fixed cap on the number of series you add. The practical ceiling is set by chart readability and by the memory available to your application.
What if the columns within a cluster are too close together or too far apart?
Adjust the gap width setting for that series (or its parent series group). Increasing the value widens the space between columns, while decreasing it brings them closer together.