Treemap と Sunburst チャートのデータポイントを .NET でカスタマイズする
PowerPoint の他のチャートタイプの中で、階層型のチャートが 2 つあります – Treemap と Sunburst チャート(Sunburst Graph、Sunburst Diagram、Radial Chart、Radial Graph、Multi Level Pie Chart とも呼ばれます)。これらのチャートは、葉から枝の先端へとツリー構造で階層データを表示します。葉はシリーズのデータポイントで定義され、以降の各ネストされたグループレベルは対応するカテゴリで定義されます。Aspose.Slides for .NET を使用すると、C# で Sunburst Chart と Treemap のデータポイントの書式設定が可能です。
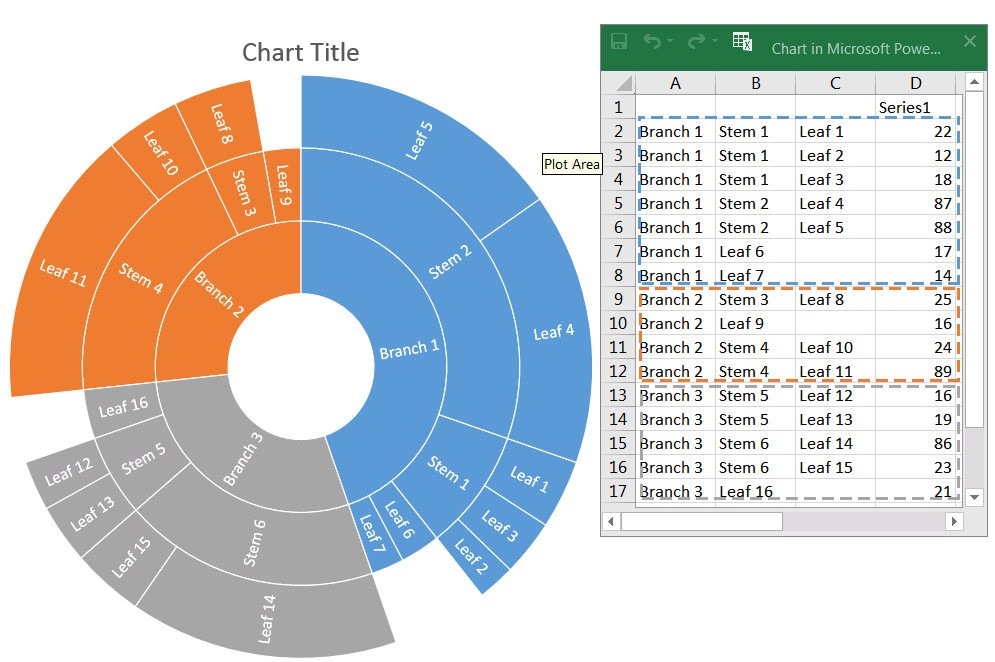
以下は Sunburst Chart で、Series1 列のデータが葉ノードを定義し、他の列が階層データポイントを定義します:
プレゼンテーションに新しい Sunburst チャートを追加するところから始めましょう:
using (Presentation pres = new Presentation())
{
    IChart chart = pres.Slides[0].Shapes.AddChart(ChartType.Sunburst, 100, 100, 450, 400);
    // ...
}
See also
チャートのデータポイントの書式設定が必要な場合は、次のものを使用します:
IChartDataPointLevelsManager、IChartDataPointLevel クラスとIChartDataPoint.DataPointLevels プロパティは、Treemap および Sunburst チャートのデータポイントの書式設定へのアクセスを提供します。
IChartDataPointLevelsManager はマルチレベルカテゴリにアクセスするために使用され、IChartDataPointLevel オブジェクトのコンテナを表します。基本的には、データポイント固有のプロパティが追加されたIChartCategoryLevelsManager のラッパーです。
IChartDataPointLevel クラスは、Format とDataLabel の 2 つのプロパティを持ち、対応する設定へのアクセスを提供します。
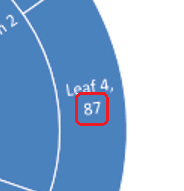
データポイントの値を表示
「Leaf 4」データポイントの値を表示します:
IChartDataPointCollection dataPoints = chart.ChartData.Series[0].DataPoints;
dataPoints[3].DataPointLevels[0].Label.DataLabelFormat.ShowValue = true;
データポイントのラベルと色を設定
「Branch 1」データラベルをカテゴリ名の代わりにシリーズ名(「Series1」)を表示するように設定し、テキスト色を黄色にします:
IDataLabel branch1Label = dataPoints[0].DataPointLevels[2].Label;
branch1Label.DataLabelFormat.ShowCategoryName = false;
branch1Label.DataLabelFormat.ShowSeriesName = true;

branch1Label.DataLabelFormat.TextFormat.PortionFormat.FillFormat.FillType = FillType.Solid;
branch1Label.DataLabelFormat.TextFormat.PortionFormat.FillFormat.SolidFillColor.Color = Color.Yellow;

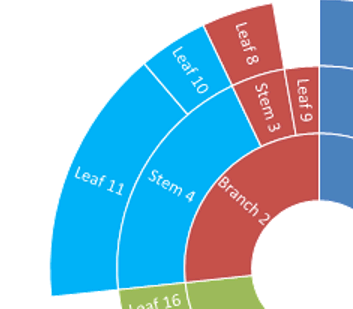
データポイントのブランチの色を設定
「Stem 4」ブランチの色を変更します:
using (Presentation pres = new Presentation())
{
    IChart chart = pres.Slides[0].Shapes.AddChart(ChartType.Sunburst, 100, 100, 450, 400);

    IChartDataPointCollection dataPoints = chart.ChartData.Series[0].DataPoints;

    IChartDataPointLevel stem4branch = dataPoints[9].DataPointLevels[1];

    stem4branch.Format.Fill.FillType = FillType.Solid;
    stem4branch.Format.Fill.SolidFillColor.Color = Color.Red;

    pres.Save("pres.pptx", SaveFormat.Pptx);
}
FAQ
Sunburst/Treemap のセグメントの順序(ソート)を変更できますか?
いいえ。PowerPoint はセグメントを自動的に(通常は降順で時計回りに)ソートします。Aspose.Slides も同様の動作を再現しており、直接順序を変更することはできません。データを事前に加工して順序を調整してください。
プレゼンテーションのテーマはセグメントやラベルの色にどのように影響しますか?
チャートの色は、明示的に塗りやフォントを設定しない限り、プレゼンテーションのテーマ/パレット を継承します。一定の結果が必要な場合は、必要なレベルで実線の塗りとテキスト書式を固定してください。
PDF/PNG へエクスポートすると、カスタムブランチ色やラベル設定は保持されますか?
はい。プレゼンテーションをエクスポートする際、チャートの設定(塗り、ラベル)は出力形式に保持されます。Aspose.Slides はチャートの書式設定を適用した状態でレンダリングします。
ラベルや要素の実際の座標を取得して、チャート上にカスタムオーバーレイを配置できますか?
はい。チャートのレイアウトが確定した後、要素(例: DataLabel)に対して ActualX / ActualY が利用可能です。これにより、オーバーレイの正確な位置決めが可能になります。