
Apply Chart Worksheet Formulas in Presentations with Python
Overview
PowerPoint charts usually store their source data in an embedded worksheet. In Aspose.Slides for Python via .NET, you can access that worksheet through the chart data workbook, write input values, assign formulas to cells, calculate supported formulas, and use the calculated cells as chart data.
This article explains the complete formula workflow: create a chart, populate its worksheet, assign A1-style or R1C1-style formulas, recalculate them, read the calculated values, connect those cells to a chart series, and save the presentation. It also describes the supported formula syntax, the built-in function subset, cached values, unsupported formulas, and spreadsheet-specific errors.
Chart Worksheets and Formulas
A chart worksheet contains the categories, series names, and values used by a chart. In PowerPoint, you can inspect the worksheet by opening the chart data editor:
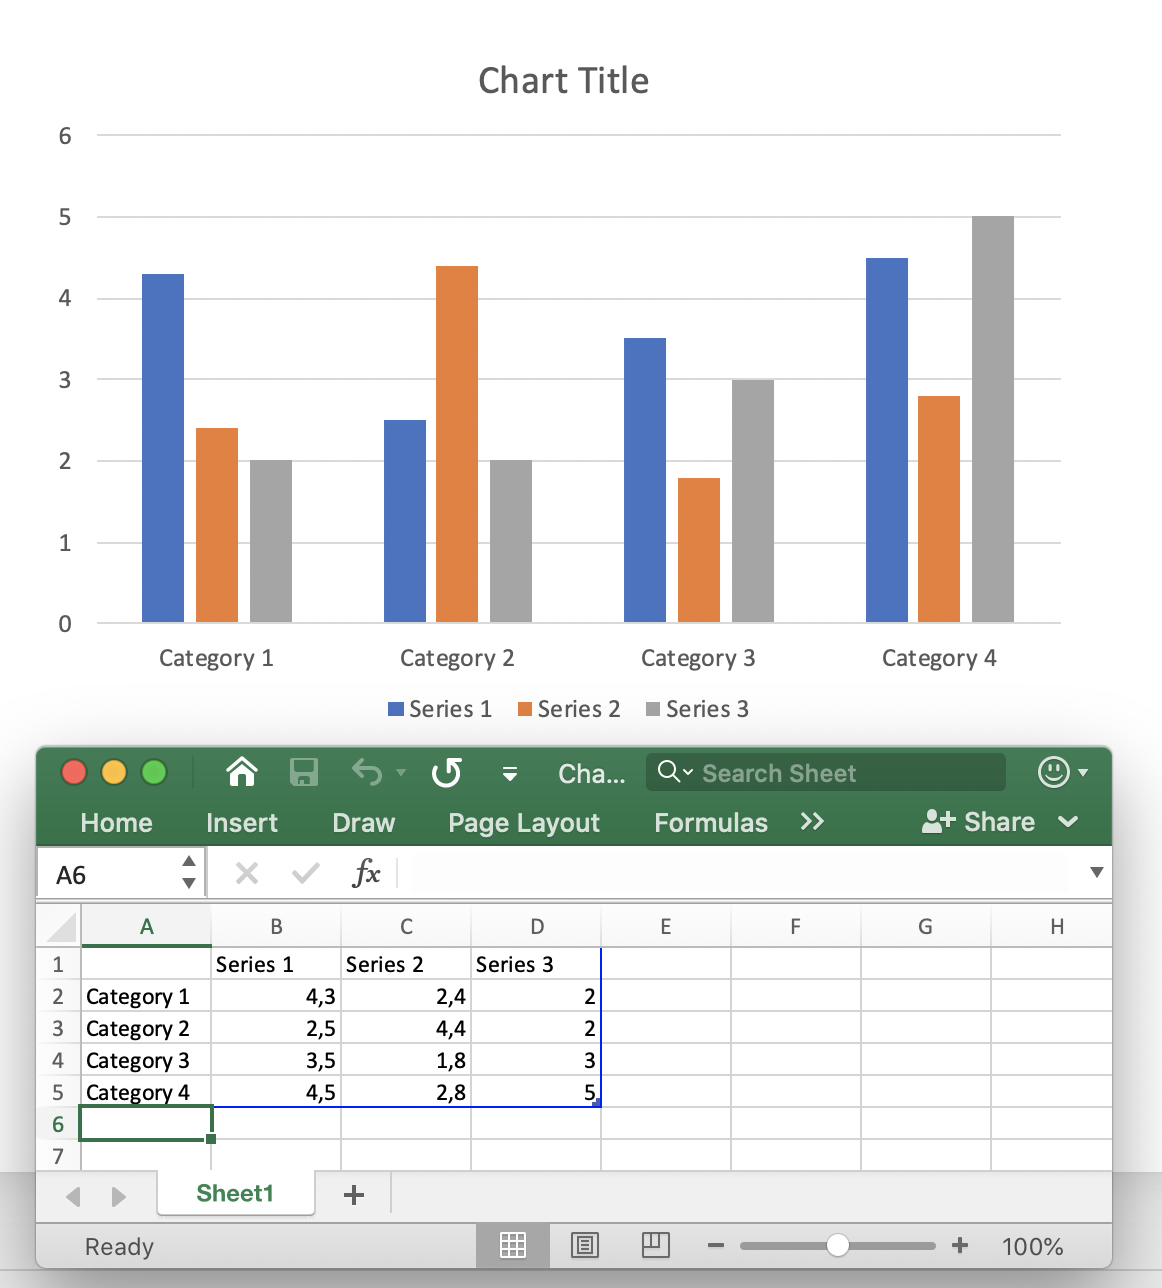
In Aspose.Slides, the worksheet is exposed through the chart data workbook. Use the formula property for A1-style formulas and the r1c1_formula property for R1C1-style formulas. After changing input cells or formulas, call calculate_formulas to recalculate supported formulas and update the corresponding cell values.
A calculated cell still exposes its result through the value property. This is important when you need to inspect a formula result in code or use the cell as a chart data point.
Create a Chart and Calculate Worksheet Formulas
The following example demonstrates an end-to-end workflow. It creates a clustered column chart, clears the sample data, writes quarterly revenue and expense values, calculates profit with formulas, reads the results, uses the calculated cells as chart values, and saves the presentation.
import aspose.slides as slides
import aspose.slides.charts as charts

with slides.Presentation() as presentation:
    slide = presentation.slides[0]
    chart = slide.shapes.add_chart(charts.ChartType.CLUSTERED_COLUMN, 50, 50, 600, 350)
    workbook = chart.chart_data.chart_data_workbook
    worksheet_index = 0

    chart.chart_data.series.clear()
    chart.chart_data.categories.clear()
    workbook.clear(worksheet_index)

    category1 = workbook.get_cell(worksheet_index, "A2", "Q1")
    category2 = workbook.get_cell(worksheet_index, "A3", "Q2")
    category3 = workbook.get_cell(worksheet_index, "A4", "Q3")

    workbook.get_cell(worksheet_index, "B1", "Revenue")
    workbook.get_cell(worksheet_index, "C1", "Expenses")
    workbook.get_cell(worksheet_index, "D1", "Profit")

    workbook.get_cell(worksheet_index, "B2").value = 120.0
    workbook.get_cell(worksheet_index, "C2").value = 80.0
    workbook.get_cell(worksheet_index, "B3").value = 150.0
    workbook.get_cell(worksheet_index, "C3").value = 95.0
    workbook.get_cell(worksheet_index, "B4").value = 135.0
    workbook.get_cell(worksheet_index, "C4").value = 110.0

    profit1 = workbook.get_cell(worksheet_index, "D2")
    profit2 = workbook.get_cell(worksheet_index, "D3")
    profit3 = workbook.get_cell(worksheet_index, "D4")

    profit1.formula = "B2-C2"
    profit2.formula = "B3-C3"
    profit3.formula = "B4-C4"

    workbook.calculate_formulas()

    q1_profit = profit1.value  # 40
    q2_profit = profit2.value  # 55
    q3_profit = profit3.value  # 25

    print(f"Q1 profit: {q1_profit}")
    print(f"Q2 profit: {q2_profit}")
    print(f"Q3 profit: {q3_profit}")

    chart.chart_data.categories.add(category1)
    chart.chart_data.categories.add(category2)
    chart.chart_data.categories.add(category3)

    profit_series = chart.chart_data.series.add(workbook.get_cell(worksheet_index, "D1"), chart.type)
    profit_series.data_points.add_data_point_for_bar_series(profit1)
    profit_series.data_points.add_data_point_for_bar_series(profit2)
    profit_series.data_points.add_data_point_for_bar_series(profit3)
    profit_series.labels.default_data_label_format.show_value = True

    presentation.save("chart-formulas.pptx", slides.export.SaveFormat.PPTX)
The chart data points reference D2:D4, so the chart uses the calculated profit values. There is no separate chart-refresh call in this workflow: recalculate the workbook first, then use or save the chart data that points to the calculated cells.
Use A1-Style Formulas
A1 notation identifies columns with letters and rows with numbers. Assign A1-style expressions through IChartDataCell.formula.
import aspose.slides as slides
import aspose.slides.charts as charts

with slides.Presentation() as presentation:
    slide = presentation.slides[0]
    chart = slide.shapes.add_chart(charts.ChartType.CLUSTERED_COLUMN, 50, 50, 500, 300)
    workbook = chart.chart_data.chart_data_workbook

    workbook.get_cell(0, "C3").value = 10
    workbook.get_cell(0, "F2").value = 2
    workbook.get_cell(0, "G2").value = 3
    workbook.get_cell(0, "H2").value = 4

    cell = workbook.get_cell(0, "A2")
    cell.formula = "C3+SUM(F2:H2)"

    workbook.calculate_formulas()

    value = cell.value  # 19
Common A1 reference forms are:
| Reference | Relative | Absolute | Mixed |
|---|---|---|---|
| Cell | A2 |
$A$2 |
A$2, $A2 |
| Row | 2:2 |
$2:$2 |
— |
| Column | A:A |
$A:$A |
— |
| Range | A2:C4 |
$A$2:$C$4 |
A$2:$C4, $A2:C$4 |
Relative references can change when a formula is moved or copied by a spreadsheet application. Absolute references keep both coordinates fixed, while mixed references fix only a row or a column.
Use R1C1-Style Formulas
R1C1 notation identifies both rows and columns numerically. Relative references use offsets in square brackets. Assign this syntax through IChartDataCell.r1c1_formula.
import aspose.slides as slides
import aspose.slides.charts as charts

with slides.Presentation() as presentation:
    slide = presentation.slides[0]
    chart = slide.shapes.add_chart(charts.ChartType.CLUSTERED_COLUMN, 50, 50, 500, 300)
    workbook = chart.chart_data.chart_data_workbook

    workbook.get_cell(0, "B2").value = 12
    workbook.get_cell(0, "C2").value = 5

    cell = workbook.get_cell(0, "D2")
    cell.r1c1_formula = "RC[-2]-RC[-1]"

    workbook.calculate_formulas()

    value = cell.value  # 7
Common R1C1 reference forms are:
| Reference | Relative | Absolute | Mixed |
|---|---|---|---|
| Cell | R[2]C[3] |
R2C3 |
R2C[3], R[2]C3 |
| Row | R[2] |
R2 |
— |
| Column | C[3] |
C3 |
— |
| Range | R[2]C[3]:R[5]C[7] |
R2C3:R5C7 |
R2C3:R[5]C[7], R[2]C3:R5C[7] |
For example, in cell D2, RC[-2] means the cell in the same row two columns to the left (B2).
Formula Constants and Operators
The built-in formula evaluator supports logical values, numeric literals, strings, spreadsheet error values, arithmetic operators, and comparison operators.
Constants and Literals
| Type | Examples | Notes |
|---|---|---|
| Logical | TRUE, FALSE |
Can be used directly in logical expressions such as A2=TRUE. |
| Numeric | 1, 0.5, .3, 1E-2 |
Common and scientific notation are supported. |
| String | "abc", "2/3/2020 12:00" |
Text literals are enclosed in double quotation marks inside the formula. |
| Error result | #DIV/0!, #N/A, #REF! |
A valid formula can evaluate to a spreadsheet error value instead of a normal result. |
This example uses several constant types:
import aspose.slides as slides
import aspose.slides.charts as charts

with slides.Presentation() as presentation:
    slide = presentation.slides[0]
    chart = slide.shapes.add_chart(charts.ChartType.CLUSTERED_COLUMN, 50, 50, 500, 300)
    workbook = chart.chart_data.chart_data_workbook

    workbook.get_cell(0, "A2").value = False
    workbook.get_cell(0, "B2").formula = "A2=TRUE"
    workbook.get_cell(0, "C2").formula = "1+0.5"
    workbook.get_cell(0, "D2").formula = ".3*1E-2"
    workbook.get_cell(0, "E2").formula = "\"abc\""
    workbook.get_cell(0, "F2").formula = "2/0"

    workbook.calculate_formulas()

    logical_value = workbook.get_cell(0, "B2").value  # False
    numeric_value = workbook.get_cell(0, "C2").value  # 1.5
    scientific_value = workbook.get_cell(0, "D2").value  # 0.003
    string_value = workbook.get_cell(0, "E2").value  # abc
    error_value = workbook.get_cell(0, "F2").value  # #DIV/0!
Arithmetic Operators
| Operator | Meaning | Example |
|---|---|---|
+ |
Addition or unary plus | 2+3 |
- |
Subtraction or negation | 2-3, -3 |
* |
Multiplication | 2*3 |
/ |
Division | 2/3 |
% |
Percent | 30% |
^ |
Exponentiation | 2^3 |
Use parentheses to make evaluation order explicit, for example (A2+B2)*C2.
Comparison Operators
Comparison expressions return logical values.
| Operator | Meaning | Example |
|---|---|---|
= |
Equal to | A2=3 |
<> |
Not equal to | A2<>3 |
> |
Greater than | A2>3 |
>= |
Greater than or equal to | A2>=3 |
< |
Less than | A2<3 |
<= |
Less than or equal to | A2<=3 |
Supported Predefined Functions
Aspose.Slides includes a built-in formula evaluator for chart worksheets, but it is not a complete Excel calculation engine. The documented function set is limited to the functions below. Do not assume that an arbitrary Excel function can be recalculated by calculate_formulas.
| Function | Purpose or supported form | Example |
|---|---|---|
ABS |
Absolute value | ABS(A2) |
AVERAGE |
Arithmetic mean | AVERAGE(B2:B5) |
CEILING |
Round a number upward to a multiple | CEILING(A2,5) |
CHOOSE |
Select a value by index | CHOOSE(A2,"Low","High") |
CONCAT |
Join text values | CONCAT(A2,B2) |
CONCATENATE |
Join text values | CONCATENATE(A2," ",B2) |
DATE |
Create a date value using the 1900 date system | DATE(2026,8,19) |
DAYS |
Return the number of days between dates | DAYS(B2,A2) |
FIND |
Find one text value inside another | FIND("-",A2) |
FINDB |
Byte-oriented text search | FINDB("a",A2) |
IF |
Conditional result | IF(A2>0,A2,0) |
INDEX |
Reference form | INDEX(A2:C4,2,3) |
LOOKUP |
Vector form | LOOKUP(A2,B2:B5,C2:C5) |
MATCH |
Vector form | MATCH(A2,B2:B5,0) |
MAX |
Maximum value | MAX(B2:B5) |
SUM |
Sum values | SUM(B2:B5) |
VLOOKUP |
Vertical lookup | VLOOKUP(A2,B2:D10,3,FALSE) |
The restrictions shown in the table are significant: INDEX is documented in reference form, while LOOKUP and MATCH are documented in their vector forms. DATE uses the 1900 date system. Features and functions not listed here should be treated as unsupported by the Aspose.Slides formula evaluator unless they are documented separately.
Calculate Formulas with a Preferred Culture
Some chart workbook functions interpret text according to culture-specific rules. This is especially important for functions intended for languages that use double-byte character sets (DBCS). To calculate such formulas correctly, create LoadOptions, set SpreadsheetOptions.preferred_culture through LoadOptions.spreadsheet_options, and then load the presentation.
The following example selects the Japanese culture, opens a presentation with the configured load options, and calls ChartDataWorkbook.calculate_formulas for every chart workbook:
import aspose.slides as slides
import aspose.slides.charts as charts

load_options = slides.LoadOptions()
load_options.spreadsheet_options.preferred_culture = "ja-JP"

with slides.Presentation("presentation.pptx", load_options) as presentation:
    for slide in presentation.slides:
        for shape in slide.shapes:
            if isinstance(shape, charts.Chart):
                shape.chart_data.chart_data_workbook.calculate_formulas()
The preferred culture is part of the presentation loading configuration, so specify it before creating the Presentation instance. Use the culture expected by the workbook formulas; for example, use ja-JP for formulas that should follow Japanese DBCS calculation rules.
Recalculation and Cached Values
Spreadsheet files commonly store both a formula and its last calculated value. Aspose.Slides can therefore read a cached value from IChartDataCell.value when a presentation is loaded and the relevant chart data has not been changed.
After changing input cells or formulas, do not rely on an old cached result. Call ChartDataWorkbook.calculate_formulas before reading calculated values or saving chart data that depends on them.
For formulas outside the supported subset, Aspose.Slides may be unable to parse the formula or establish its dependencies. If the workbook has been modified, the previous cached value can no longer be considered reliable. In that situation, reading the value of a cell with unsupported data can raise CellUnsupportedDataException.
If your chart depends on Excel functions that Aspose.Slides does not evaluate, calculate those formulas with a spreadsheet engine that supports them and write the resulting values back to the chart workbook. Do not replace unsupported formulas with guessed values.
Handle Formula Errors
There are two different kinds of problems to distinguish.
A formula can be valid but produce a spreadsheet error result such as #DIV/0!, #N/A, #NAME?, #NULL!, #NUM!, #REF!, or #VALUE!. In this case, the error token is a cell result and can be returned through value.
A formula can also fail at the parsing, reference, dependency, or supported-data level. Aspose.Slides provides spreadsheet-specific exceptions for these cases: CellInvalidFormulaException, CellInvalidReferenceException, CellCircularReferenceException, and CellUnsupportedDataException.
When formulas come from templates or user input, handle these exceptions around recalculation and value access:
import aspose.slides as slides
import aspose.slides.charts as charts
import aspose.slides.spreadsheet as spreadsheet

with slides.Presentation() as presentation:
    slide = presentation.slides[0]
    chart = slide.shapes.add_chart(charts.ChartType.CLUSTERED_COLUMN, 50, 50, 500, 300)
    workbook = chart.chart_data.chart_data_workbook
    cell = workbook.get_cell(0, "A2")
    cell.formula = "SUM(B2:B5)"

    try:
        workbook.calculate_formulas()
        print(cell.value)
    except spreadsheet.CellInvalidFormulaException as ex:
        print(f"Invalid formula: {ex}")
    except spreadsheet.CellInvalidReferenceException as ex:
        print(f"Invalid cell reference: {ex}")
    except spreadsheet.CellCircularReferenceException as ex:
        print(f"Circular reference: {ex}")
    except spreadsheet.CellUnsupportedDataException as ex:
        print(f"Unsupported spreadsheet data: {ex}")
Practical Limitations
The formula support in chart worksheets is intended for a defined subset of spreadsheet calculations, not for full Excel compatibility. Keep these constraints in mind when designing a reporting workflow:
- Use only the documented constants, operators, references, and functions when you need Aspose.Slides to recalculate formulas.
- Recalculate after changing cells that formula results depend on.
- Treat cached values from loaded presentations as snapshots, not as a replacement for recalculation after edits.
- Test formulas from existing templates before relying on their calculated values, especially when they use functions outside the documented list.
- For formulas that require a full spreadsheet calculation engine, calculate them externally and then update the chart workbook with the resulting values.
FAQ
What is the difference between formula and r1c1_formula?
formula stores an A1-style expression such as B2-C2. r1c1_formula stores an R1C1-style expression such as RC[-2]-RC[-1]. Use the notation that best matches how you generate or copy formulas.
Do I need to read the cell itself or its value after calculation?
ChartDataWorkbook.get_cell returns an IChartDataCell. To obtain the calculated result, read that cell’s value property after recalculation.
When should I call calculate_formulas?
Call calculate_formulas after changing input values or formulas and before you depend on the calculated results. This updates the values of formulas that the built-in evaluator supports.
Does Aspose.Slides support every Excel function?
No. The built-in evaluator supports a documented subset of functions. Functions outside that subset should not be assumed to recalculate correctly. If full Excel formula compatibility is required, perform the calculation with an appropriate spreadsheet engine and write the final values to the chart workbook.
What happens if a loaded presentation contains an unsupported formula?
If the chart data has not changed, the workbook may still contain a previously calculated cached value. After related data is modified, that cached value may no longer be valid. Accessing a cell whose formula cannot be handled can raise CellUnsupportedDataException.
Are formula error values the same as Python exceptions?
No. A result such as #DIV/0! is a spreadsheet value produced by a valid calculation. Exceptions such as CellInvalidFormulaException or CellCircularReferenceException indicate that the formula cannot be processed normally.
Does a chart update automatically when a formula cell changes?
A chart series can reference workbook cells. Recalculate the workbook first, then save or render the presentation. If the chart data points reference the calculated cells, the chart uses those updated cell values; no separate chart-refresh method is required for this workflow.
Can charts use an external Excel workbook?
Yes, chart data can be configured to use an external workbook through the chart data API. However, the formula calculation workflow described in this article concerns the chart data workbook and the formula subset evaluated by Aspose.Slides. Do not assume that calculate_formulas provides full recalculation of arbitrary formulas in an external XLSX file.
Can I use formulas that reference another worksheet or workbook?
Excel-style references may exist in chart workbooks, but formula evaluation is limited by the supported parser and function set. If a cross-sheet or external reference is essential, validate that exact formula with your target Aspose.Slides version. For workflows that require broad Excel reference compatibility, calculate the workbook externally and write the resolved values back to the chart data.
Should formula strings start with =?
The Aspose.Slides API examples assign expressions such as B2-C2 or SUM(B2:B5) without a leading =. Using that form keeps generated formulas consistent with the documented API examples.