
在 Python 中自動化 PowerPoint 產生:輕鬆建立動態簡報
簡介
手動建立 PowerPoint 簡報可能既耗時又重複——尤其是當內容基於經常變動的動態資料時。無論是產生每週的業務報告、彙整教學素材,或是製作可直接交付客戶的銷售簡報,自動化都能節省大量時間,並確保團隊間的一致性。
對於 Python 開發者而言,自動化建立 PowerPoint 簡報能開啟強大的可能性。您可以將投影片產生整合至 Web 入口網站、桌面工具、後端服務或雲端平台,即時將資料轉換為專業且具品牌形象的簡報——按需生成。
在本篇文章中,我們將探討在 Python 應用程式(包括雲端平台部署)中自動化產生 PowerPoint 的常見使用情境,以及其為何成為現代解決方案的關鍵功能。從即時抓取業務資料到將文字或圖像轉換為投影片,目標是將原始內容轉化為結構化、視覺化的格式,讓受眾能立即理解。
在 Python 中使用 PowerPoint 自動化的常見情境
在需要動態組合、個人化或頻繁更新簡報內容的情境中,自動化產生 PowerPoint 尤其有用。以下列舉幾個最常見的實務情境:
-
業務報告與儀表板
透過從資料庫或 API 抓取即時資料,產生銷售摘要、關鍵績效指標(KPI)或財務績效報告。 -
個人化銷售與行銷簡報
自動使用 CRM 或表單資料建立針對特定客戶的提案簡報,確保快速交付與品牌一致性。 -
教育內容
將學習教材、測驗或課程摘要轉換為結構化的投影片套件,供 e‑learning 平台使用。 -
資料與 AI 驅動的洞察
使用自然語言處理或分析引擎,將原始資料或長篇文字轉換為精簡的簡報。 -
媒體為主的投影片
從上傳的圖片、帶註解的螢幕擷取圖或影片關鍵畫面組成簡報,並附上說明文字。 -
文件轉換
自動將 Word 文件、PDF 或表單輸入轉換為視覺化簡報,減少人工操作。 -
開發者與技術工具
直接從程式碼或 Markdown 內容產生技術示範、文件概覽或更新日誌的投影片。
透過自動化這些工作流程,組織能擴大內容產出規模、維持一致性,並釋放時間投入更具策略性的工作。
開始編寫程式
在此範例中,我們選擇 Aspose.Slides for Python 來示範 PowerPoint 自動化,因為它具備完整的功能套件,且在程式化操作簡報時使用簡便。
相較於需要直接操作 Open XML 結構的低階函式庫(往往導致程式碼冗長且不易閱讀),Aspose.Slides 提供更高階的 API。它抽象掉複雜性,讓開發者專注於簡報邏輯——如版面配置、格式設定與資料繫結——而不必深入了解 PowerPoint 檔案格式的細節。
雖然 Aspose.Slides 為商業函式庫,但它提供可完整執行本文示例的 免費試用 版本。為了示範概念、測試功能或打造本文所示的概念驗證,試用版已足夠使用。這使得在未先行購買授權的情況下,仍能方便地嘗試自動化產生 PowerPoint。
好,讓我們逐步建立一個使用真實內容的範例簡報。
建立標題投影片
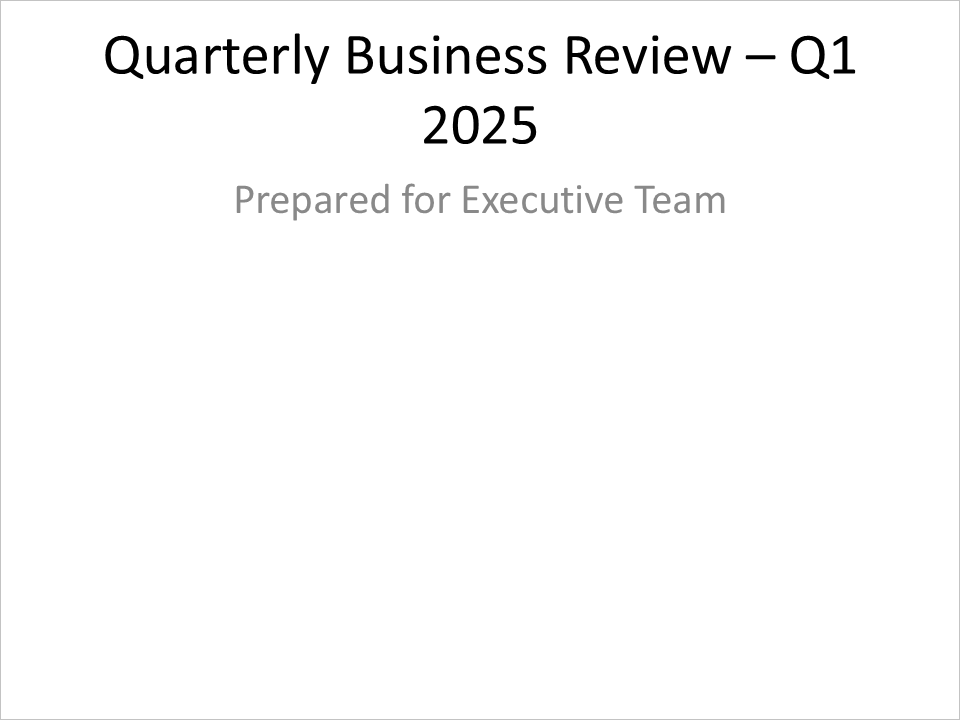
我們將先建立新的簡報,並新增一張包含主標題與副標題的標題投影片。
import aspose.slides as slides
import aspose.slides.charts as charts
import aspose.pydrawing as draw

with slides.Presentation() as presentation:

    slide_0 = presentation.slides[0]
    slide_0.layout_slide = presentation.layout_slides.get_by_type(slides.SlideLayoutType.TITLE)

    title_shape = slide_0.shapes[0]
    subtitle_shape = slide_0.shapes[1]

    title_shape.text_frame.text = "Quarterly Business Review – Q1 2025"
    subtitle_shape.text_frame.text = "Prepared for Executive Team"
新增含直條圖的投影片
layout_slide_1 = presentation.layout_slides.get_by_type(slides.SlideLayoutType.BLANK)
slide_1 = presentation.slides.add_empty_slide(layout_slide_1)

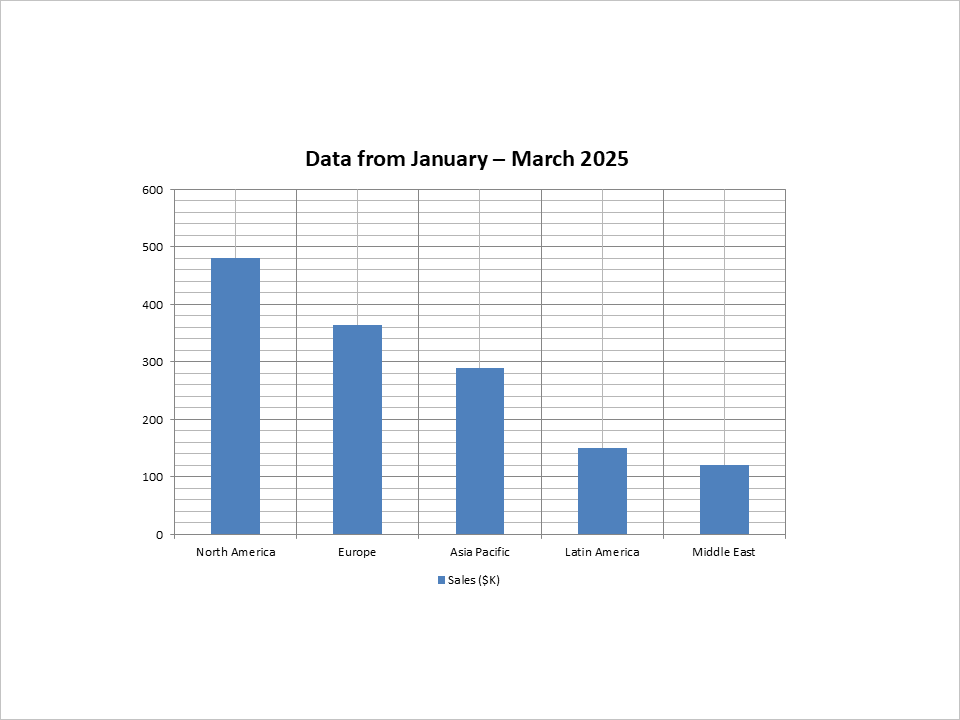
chart = slide_1.shapes.add_chart(charts.ChartType.CLUSTERED_COLUMN, 100, 100, 500, 350, False)
chart.legend.position = charts.LegendPositionType.BOTTOM
chart.has_title = True
chart.chart_title.add_text_frame_for_overriding("Data from January – March 2025")
chart.chart_title.overlay = False

workbook = chart.chart_data.chart_data_workbook
worksheet_index = 0

chart.chart_data.categories.add(workbook.get_cell(worksheet_index, 1, 0, "North America"))
chart.chart_data.categories.add(workbook.get_cell(worksheet_index, 2, 0, "Europe"))
chart.chart_data.categories.add(workbook.get_cell(worksheet_index, 3, 0, "Asia Pacific"))
chart.chart_data.categories.add(workbook.get_cell(worksheet_index, 4, 0, "Latin America"))
chart.chart_data.categories.add(workbook.get_cell(worksheet_index, 5, 0, "Middle East"))

series = chart.chart_data.series.add(workbook.get_cell(worksheet_index, 0, 1, "Sales ($K)"), chart.type)
series.data_points.add_data_point_for_bar_series(workbook.get_cell(worksheet_index, 1, 1, 480))
series.data_points.add_data_point_for_bar_series(workbook.get_cell(worksheet_index, 2, 1, 365))
series.data_points.add_data_point_for_bar_series(workbook.get_cell(worksheet_index, 3, 1, 290))
series.data_points.add_data_point_for_bar_series(workbook.get_cell(worksheet_index, 4, 1, 150))
series.data_points.add_data_point_for_bar_series(workbook.get_cell(worksheet_index, 5, 1, 120))
新增含表格的投影片
layout_slide_2 = presentation.layout_slides.get_by_type(slides.SlideLayoutType.BLANK)
slide_2 = presentation.slides.add_empty_slide(layout_slide_2)

column_widths = [200, 100]
row_heights = [40, 40, 40, 40, 40]

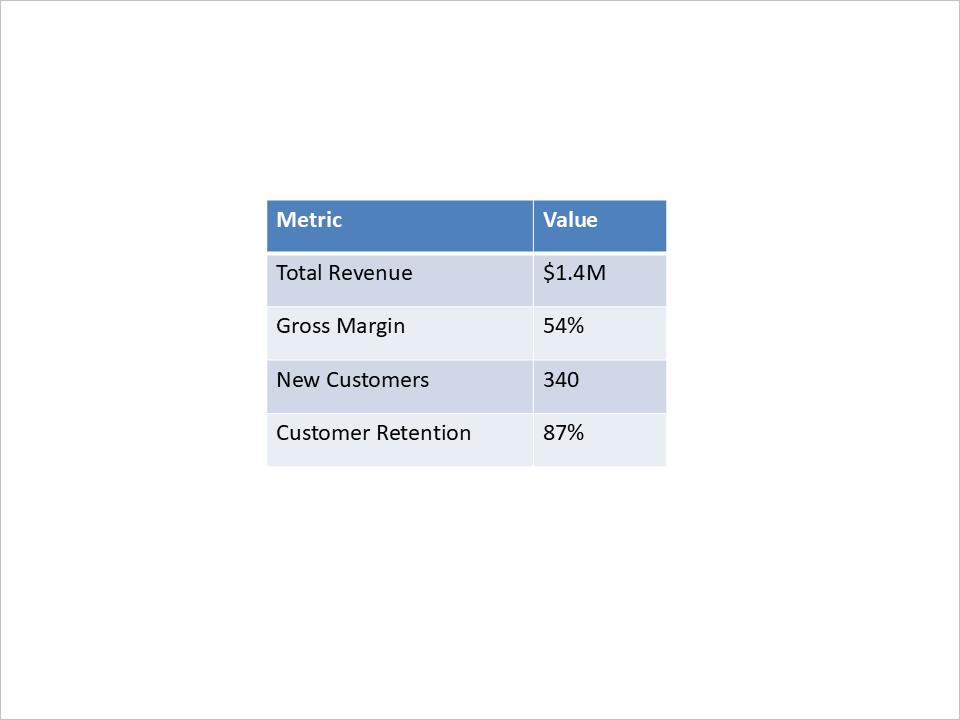
table = slide_2.shapes.add_table(200, 200, column_widths, row_heights)
table.columns[0][0].text_frame.text = "Metric"
table.columns[1][0].text_frame.text = "Value"
table.columns[0][1].text_frame.text = "Total Revenue"
table.columns[1][1].text_frame.text = "$1.4M"
table.columns[0][2].text_frame.text = "Gross Margin"
table.columns[1][2].text_frame.text = "54%"
table.columns[0][3].text_frame.text = "New Customers"
table.columns[1][3].text_frame.text = "340"
table.columns[0][4].text_frame.text = "Customer Retention"
table.columns[1][4].text_frame.text = "87%"
新增含項目符號的摘要投影片
def create_bullet_paragraph(text):
    paragraph = slides.Paragraph()
    paragraph.paragraph_format.bullet.type = slides.BulletType.SYMBOL
    paragraph.paragraph_format.indent = 15
    paragraph.paragraph_format.default_portion_format.fill_format.fill_type = slides.FillType.SOLID
    paragraph.paragraph_format.default_portion_format.fill_format.solid_fill_color.color = draw.Color.black
    paragraph.text = text
    return paragraph
layout_slide_3 = presentation.layout_slides.get_by_type(slides.SlideLayoutType.BLANK)
slide_3 = presentation.slides.add_empty_slide(layout_slide_3)

bullet_list = slide_3.shapes.add_auto_shape(slides.ShapeType.RECTANGLE, 100, 50, 600, 200)
bullet_list.fill_format.fill_type = slides.FillType.NO_FILL
bullet_list.line_format.fill_format.fill_type = slides.FillType.NO_FILL

bullet_list.text_frame.paragraphs.clear()
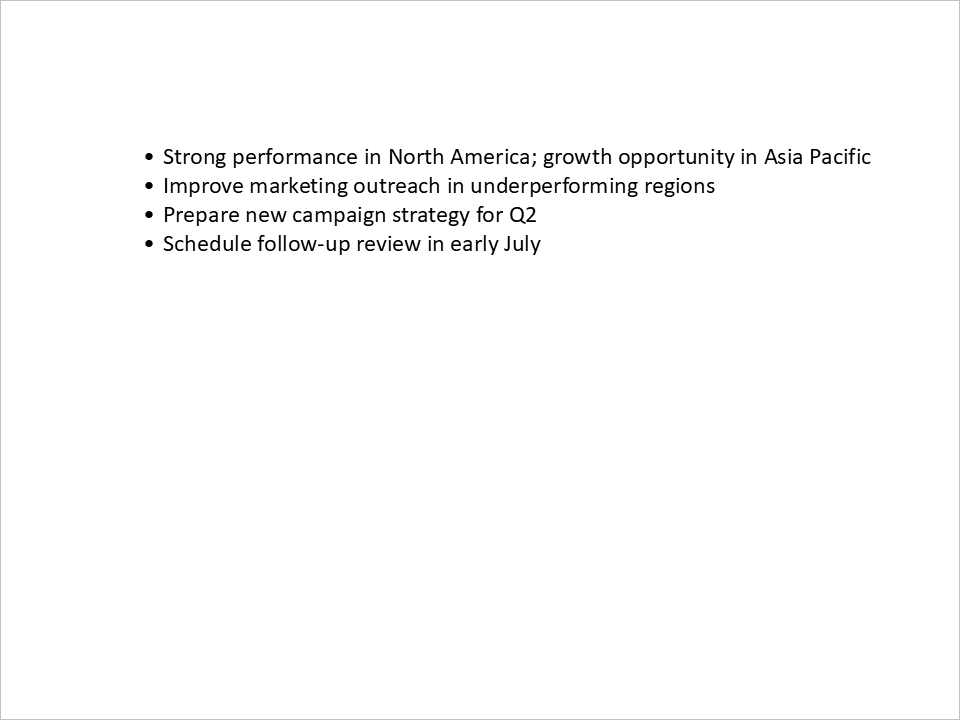
bullet_list.text_frame.paragraphs.add(create_bullet_paragraph("Strong performance in North America; growth opportunity in Asia Pacific"))
bullet_list.text_frame.paragraphs.add(create_bullet_paragraph("Improve marketing outreach in underperforming regions"))
bullet_list.text_frame.paragraphs.add(create_bullet_paragraph("Prepare new campaign strategy for Q2"))
bullet_list.text_frame.paragraphs.add(create_bullet_paragraph("Schedule follow-up review in early July"))
儲存簡報
presentation.save("presentation.pptx", slides.export.SaveFormat.PPTX)
結論
在 Python 應用程式中自動化產生 PowerPoint 明顯可節省時間並減少手動工作。透過整合圖表、表格與文字等動態內容,開發者能快速產出一致且專業的簡報—非常適合業務報告、客戶會議或教育教材。
本文示範了如何從頭開始自動化建立簡報,包括新增標題投影片、圖表與表格。此方式可套用於各種需要自動化、資料驅動簡報的情境。
藉由善用合適的工具,Python 開發者即可高效自動化 PowerPoint 的產生,提升生產力並確保簡報的一致性。