Analyzing your prompt, please hold on...
An error occurred while retrieving the results. Please refresh the page and try again.
Il nuovo metodo InsertChart è stato aggiunto alla classe DocumentBuilder. Vediamo quindi come inserire un semplice istogramma all’interno del documento utilizzando il metodo InsertChart.
In questa sezione impareremo come inserire un grafico in un documento.
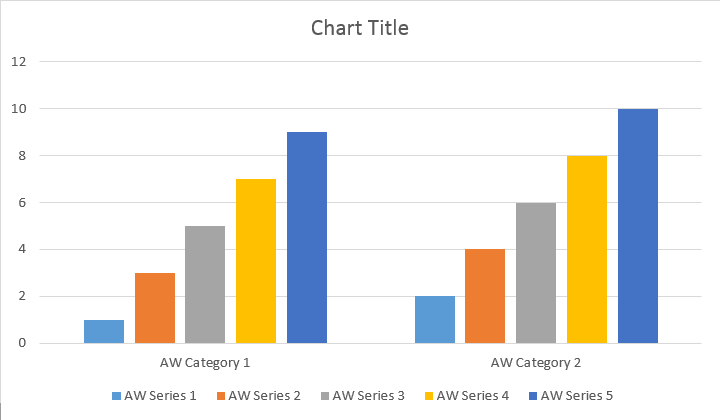
L’esempio di codice seguente mostra come inserire un istogramma:
Il codice produce il seguente risultato:
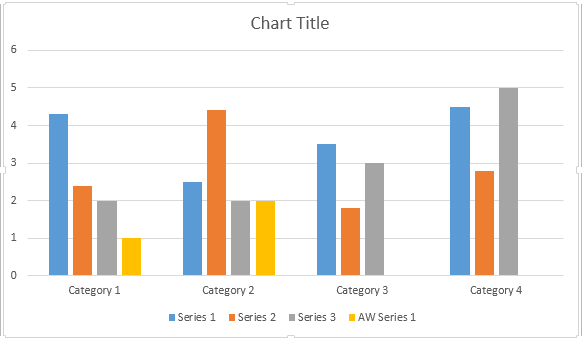
Esistono quattro diversi sovraccarichi per il metodo Add della serie, che è stato esposto per coprire tutte le possibili varianti delle origini dati per tutti i tipi di grafico:
Il codice produce il seguente risultato:
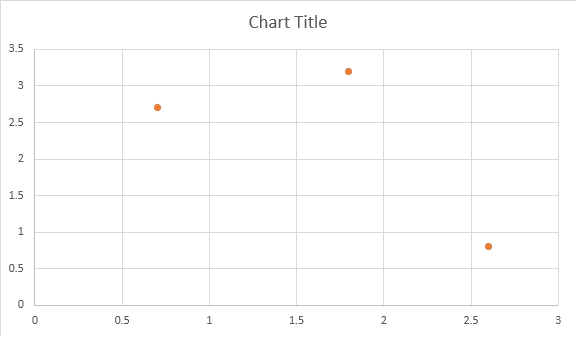
L’esempio di codice seguente mostra come inserire un grafico a dispersione:
Il codice produce il seguente risultato:
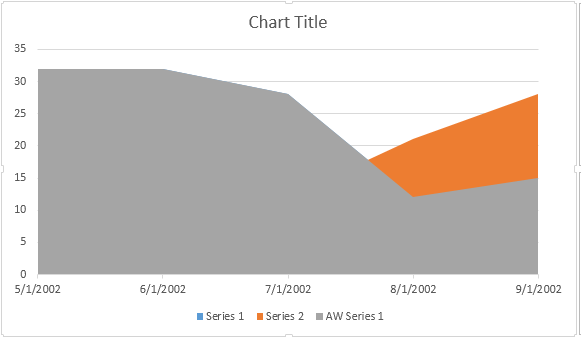
L’esempio di codice seguente mostra come inserire un grafico ad area:
Il codice produce il seguente risultato:
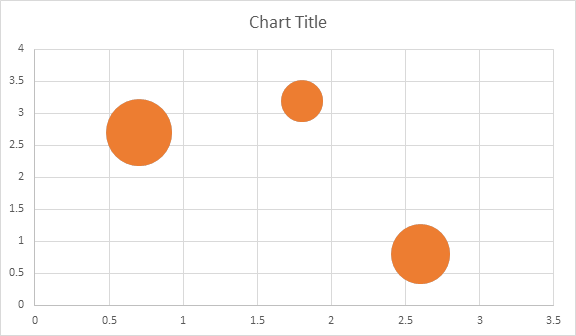
L’esempio di codice seguente mostra come inserire un grafico a bolle:
Il codice produce il seguente risultato:
Shape.ChartUna volta inserito e riempito di dati il grafico, puoi modificarne l’aspetto. La proprietà Shape.Chart contiene tutte le opzioni relative al grafico disponibili tramite il API pubblico.
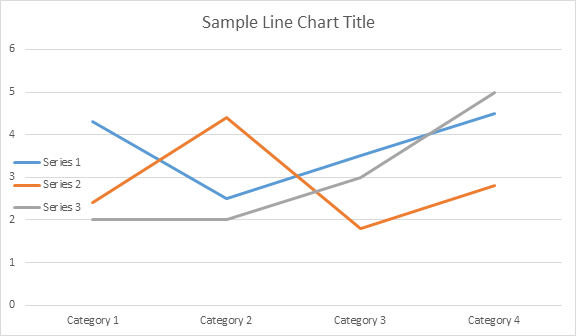
Ad esempio, modifichiamo il titolo del grafico o il comportamento della legenda:
Il codice genera i seguenti risultati:
Diamo un’occhiata alla raccolta ChartSeries. Tutte le serie di grafici sono disponibili tramite la raccolta chart.Series, che è IEnumerable:
Puoi rimuovere le serie una per una o cancellarle tutte e aggiungerne una nuova se necessario. Il grafico appena inserito presenta alcune serie predefinite aggiunte a questa raccolta. Per rimuoverli è necessario chiamare il metodo grafico.Series.Clear().
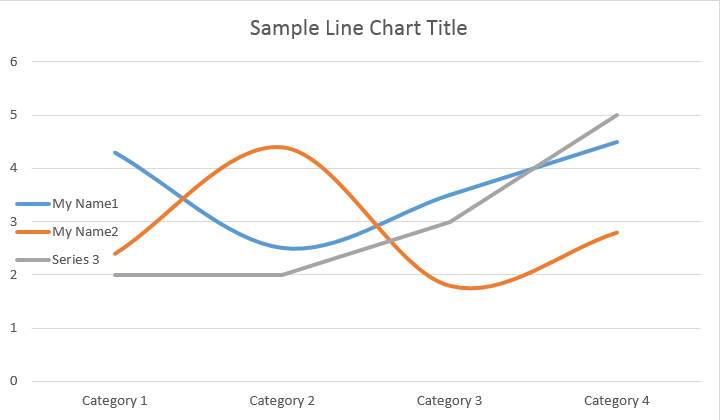
Ecco come lavorare con una serie particolare:
Si prega di vedere il risultato qui sotto:
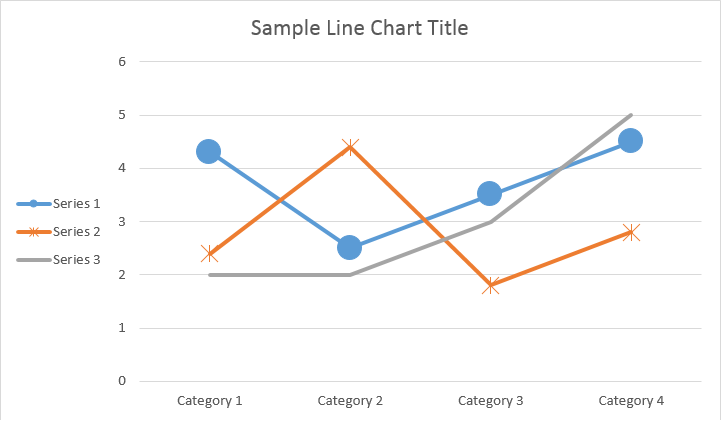
Tutti i singoli ChartSeries hanno opzioni ChartDataPoint predefinite, prova a utilizzare il seguente codice per modificarle:
Si prega di vedere il risultato qui sotto:
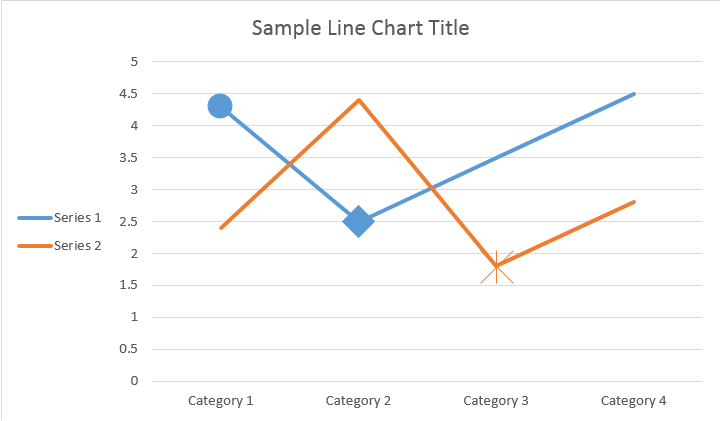
ChartSeriesUtilizzando ChartDataPoint puoi personalizzare la formattazione di un singolo punto dati della serie di grafici:
Si prega di vedere il risultato qui sotto:
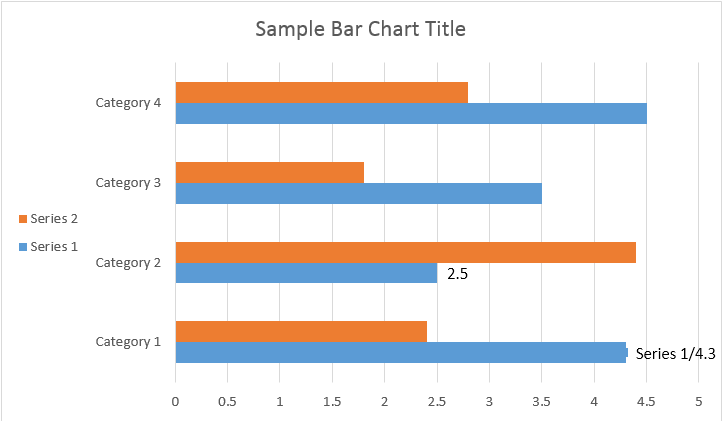
Utilizzando ChartDataLabel è possibile specificare la formattazione di una singola etichetta dati della serie di grafici, come mostrare/nascondere LegendKey, CategoryName, SeriesName, Value ecc.:
Si prega di vedere il risultato qui sotto:
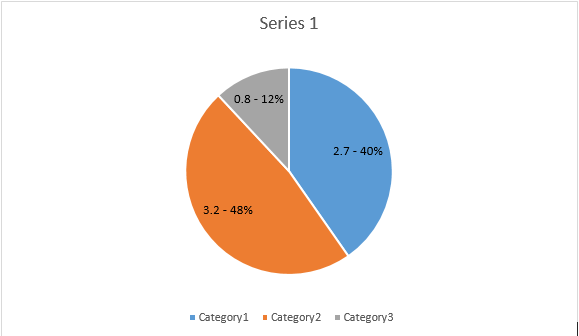
La classe ChartDataLabelCollection definisce le proprietà che possono essere utilizzate per impostare le opzioni predefinite per ChartDataLabels per Chart Series. Queste proprietà includono ShowCategoryName, ShowBubbleSize, ShowPercentage, ShowSeriesName, ShowValue ecc.:
Si prega di vedere il risultato qui sotto:
Utilizzando NumberFormat è possibile specificare la formattazione numerica di una singola etichetta dati del grafico.
Il seguente esempio di codice mostra come formattare un numero dell’etichetta dati:
Se desideri lavorare con l’asse del grafico, il ridimensionamento e le unità di visualizzazione per l’asse dei valori, utilizza le classi ChartAxis, AxisDisplayUnit e AxisScaling.
Il seguente esempio di codice mostra come definire le proprietà degli assi X e Y:
L’esempio di codice seguente mostra come impostare i valori di data/ora sulle proprietà dell’asse:
L’esempio di codice seguente mostra come modificare il formato dei numeri sull’asse dei valori:
La classe AxisBound rappresenta un limite minimo o massimo dei valori degli assi. Il limite può essere specificato come valore numerico, data-ora o speciale “automatico”.
L’esempio di codice seguente mostra come impostare i limiti di un asse:
L’esempio di codice seguente mostra come impostare l’unità di intervallo tra le etichette su un asse:
Se vuoi mostrare o nascondere l’asse del grafico, puoi semplicemente farlo impostando il valore della proprietà ChartAxis.Hidden.
L’esempio di codice seguente mostra come nascondere l’asse Y del grafico:
Se desideri impostare un allineamento del testo per le etichette su più righe, puoi semplicemente farlo impostando il valore della proprietà TickLabels.Allineamento.
L’esempio di codice seguente mostra come selezionare l’allineamento dell’etichetta:
È possibile impostare la formattazione di riempimento e tratto per serie di grafici, punti dati e indicatori. Per fare ciò, è necessario utilizzare le proprietà del tipo ChartFormat nelle classi ChartSeries, ChartDataPoint e ChartMarker, nonché gli alias per alcune proprietà, come ForeColor, BackColor, Visible e Transparency nella classe Stroke.
L’esempio di codice seguente mostra come impostare il colore della serie:
Document doc = new Document();
DocumentBuilder builder = new DocumentBuilder(doc);

Shape shape = builder.InsertChart(ChartType.Column, 432, 252);

Chart chart = shape.Chart;
ChartSeriesCollection seriesColl = chart.Series;

// Delete default generated series.
seriesColl.Clear();

// Create category names array.
string[] categories = new string[] { "AW Category 1", "AW Category 2" };

// Adding new series. Value and category arrays must be the same size.
ChartSeries series1 = seriesColl.Add("AW Series 1", categories, new double[] { 1, 2 });
ChartSeries series2 = seriesColl.Add("AW Series 2", categories, new double[] { 3, 4 });
ChartSeries series3 = seriesColl.Add("AW Series 3", categories, new double[] { 5, 6 });

// Set series color.
series1.Format.Fill.ForeColor = Color.Red;
series2.Format.Fill.ForeColor = Color.Yellow;
series3.Format.Fill.ForeColor = Color.Blue;

doc.Save(dir + "ColumnColor.docx");
L’esempio di codice seguente mostra come impostare il colore e lo spessore della linea:
Document doc = new Document();
DocumentBuilder builder = new DocumentBuilder(doc);

Shape shape = builder.InsertChart(ChartType.Line, 432, 252);

Chart chart = shape.Chart;
ChartSeriesCollection seriesColl = chart.Series;

// Delete default generated series.
seriesColl.Clear();

// Adding new series.
ChartSeries series1 = seriesColl.Add("AW Series 1", new double[] { 0.7, 1.8, 2.6 },
	new double[] { 2.7, 3.2, 0.8 });
ChartSeries series2 = seriesColl.Add("AW Series 2", new double[] { 0.5, 1.5, 2.5 },
	new double[] { 3, 1, 2 });

// Set series color.
series1.Format.Stroke.ForeColor = Color.Red;
series1.Format.Stroke.Weight = 5;
series2.Format.Stroke.ForeColor = Color.LightGreen;
series2.Format.Stroke.Weight = 5;

doc.Save(dir + "LineColorAndWeight.docx");
Analyzing your prompt, please hold on...
An error occurred while retrieving the results. Please refresh the page and try again.