การทำงานกับแผนภูมิ

Contents
[ ]

วิธีการใหม่insertChartถูกเพิ่มเข้าไปในชั้นเรียนDocumentBuilder ดังนั้น,เรามาดูวิธีการแทรกแผนภูมิคอลัมน์ง่ายๆลงในเอกสารโดยใช้วิธีการinsertChart.

วิธีการแทรกแผนภูมิจากรอยขีดข่วนโดยใช้Aspose.Words

ในส่วนนี้เราจะเรียนรู้วิธีการแทรกแผนภูมิลงในเอกสาร.

แทรกแผนภูมิคอลัมน์

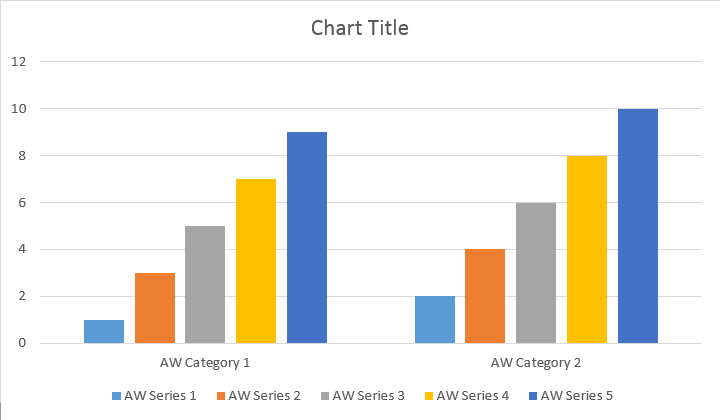
ตัวอย่างรหัสต่อไปนี้แสดงวิธีการแทรกแผนภูมิคอลัมน์:

// For complete examples and data files, please go to https://github.com/aspose-words/Aspose.Words-for-Java
Document doc = new Document();
DocumentBuilder builder = new DocumentBuilder(doc);
// Add chart with default data. You can specify different chart types and sizes.
Shape shape = builder.insertChart(ChartType.COLUMN, 432, 252);
// Chart property of Shape contains all chart related options.
Chart chart = shape.getChart();
// Get chart series collection.
ChartSeriesCollection seriesColl = chart.getSeries();
// Delete default generated series.
seriesColl.clear();
// Create category names array, in this example we have two categories.
String[] categories = new String[]{"AW Category 1", "AW Category 2"};
// Adding new series. Please note, data arrays must not be empty and arrays must be the same size.
seriesColl.add("AW Series 1", categories, new double[]{1, 2});
seriesColl.add("AW Series 2", categories, new double[]{3, 4});
seriesColl.add("AW Series 3", categories, new double[]{5, 6});
seriesColl.add("AW Series 4", categories, new double[]{7, 8});
seriesColl.add("AW Series 5", categories, new double[]{9, 10});
doc.save(dataDir + "TestInsertChartColumn1_out.docx");

รหัสสร้างผลลัพธ์ต่อไปนี้:

column-chart-aspose-words-java-1

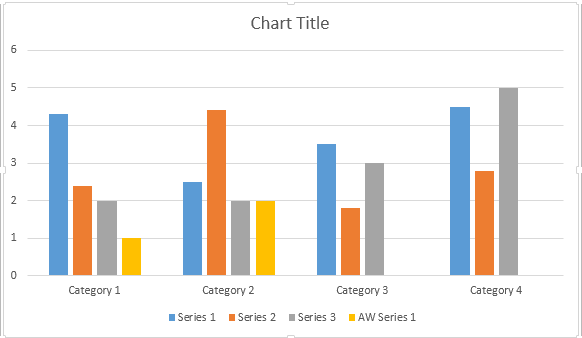
มีสี่โอเวอร์โหลดที่แตกต่างกันสำหรับวิธีการเพิ่มชุดซึ่งได้สัมผัสกับครอบคลุมทุกสายพันธุ์ที่เ:

// For complete examples and data files, please go to https://github.com/aspose-words/Aspose.Words-for-Java
Document doc = new Document();
DocumentBuilder builder = new DocumentBuilder(doc);
// Insert Column chart.
Shape shape = builder.insertChart(ChartType.COLUMN, 432, 252);
Chart chart = shape.getChart();
// Use this overload to add series to any type of Bar, Column, Line and Surface charts.
chart.getSeries().add("AW Series 1", new String[]{"AW Category 1", "AW Category 2"}, new double[]{1, 2});
doc.save(dataDir + "TestInsertColumnChart2_out.docx");

รหัสสร้างผลลัพธ์ต่อไปนี้:

column-chart-aspose-words-java-2

แทรกแผนภูมิกระจาย

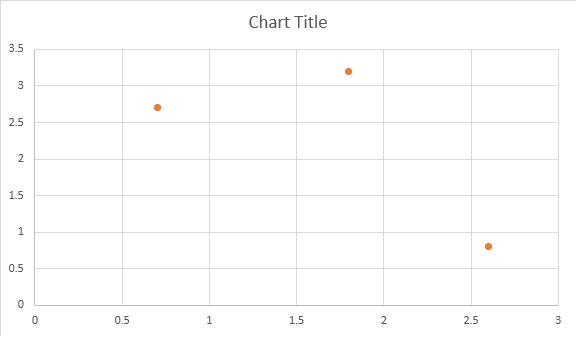
ตัวอย่างรหัสต่อไปนี้แสดงวิธีการแทรกแผนภูมิกระจาย:

// For complete examples and data files, please go to https://github.com/aspose-words/Aspose.Words-for-Java
Document doc = new Document();
DocumentBuilder builder = new DocumentBuilder(doc);
// Insert Scatter chart.
Shape shape = builder.insertChart(ChartType.SCATTER, 432, 252);
Chart chart = shape.getChart();
// Use this overload to add series to any type of Scatter charts.
chart.getSeries().add("AW Series 1", new double[]{0.7, 1.8, 2.6}, new double[]{2.7, 3.2, 0.8});
doc.save(dataDir + "TestInsertScatterChart_out.docx");

รหัสสร้างผลลัพธ์ต่อไปนี้:

scutter-chart-aspose-words-java

แทรกแผนภูมิพื้นที่

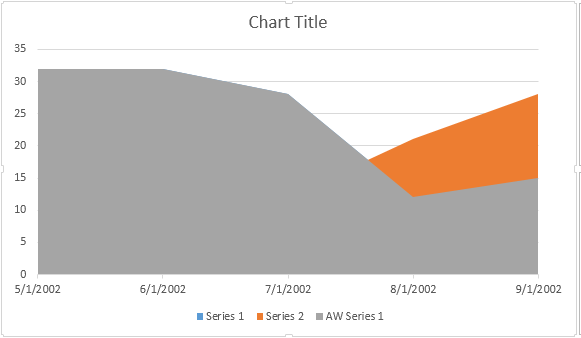
ตัวอย่างรหัสต่อไปนี้แสดงวิธีการแทรกแผนภูมิพื้นที่:

// For complete examples and data files, please go to https://github.com/aspose-words/Aspose.Words-for-Java
Document doc = new Document();
DocumentBuilder builder = new DocumentBuilder(doc);
// Insert Area chart.
Shape shape = builder.insertChart(ChartType.AREA, 432, 252);
Chart chart = shape.getChart();
SimpleDateFormat sdf = new SimpleDateFormat("dd/MM/yyyy");
Date date1 = sdf.parse("01/01/2016");
Date date2 = sdf.parse("02/02/2016");
Date date3 = sdf.parse("03/03/2016");
Date date4 = sdf.parse("04/04/2016");
Date date5 = sdf.parse("05/05/2016");
// Use this overload to add series to any type of Area, Radar and Stock charts.
chart.getSeries().add("AW Series 1", new Date[]{date1, date2, date3, date4, date5}, new double[]{32, 32, 28, 12, 15});
doc.save(dataDir + "TestInsertAreaChart_out.docx");

รหัสสร้างผลลัพธ์ต่อไปนี้:

area-chart-aspose-words-java

แทรกแผนภูมิฟอง

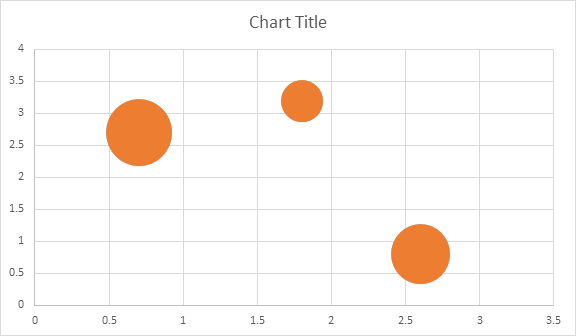
ตัวอย่างรหัสต่อไปนี้แสดงวิธีการแทรกแผนภูมิฟอง:

// For complete examples and data files, please go to https://github.com/aspose-words/Aspose.Words-for-Java
Document doc = new Document();
DocumentBuilder builder = new DocumentBuilder(doc);
// Insert Bubble chart.
Shape shape = builder.insertChart(ChartType.BUBBLE, 432, 252);
Chart chart = shape.getChart();
// Use this overload to add series to any type of Bubble charts.
chart.getSeries().add("AW Series 1", new double[]{0.7, 1.8, 2.6}, new double[]{2.7, 3.2, 0.8}, new double[]{10, 4, 8});
doc.save(dataDir + "TestInsertBubbleChart_out.docx");

รหัสสร้างผลลัพธ์ต่อไปนี้:

bubble-chart-aspose-words-java

การทำงานกับแผนภูมิผ่านShape.Chartวัตถุ

เมื่อแผนภูมิถูกแทรกและเต็มไปด้วยข้อมูลที่คุณสามารถที่จะเปลี่ยนรูปลักษณ์ของมัน Shape.Chartสถานที่ให้บริการประกอบด้วยตัวเลือกทั้งหมดที่เกี่ยวข้องกับแผนภูมิที่มีอยู่ผ่านสาธารณะAPI.

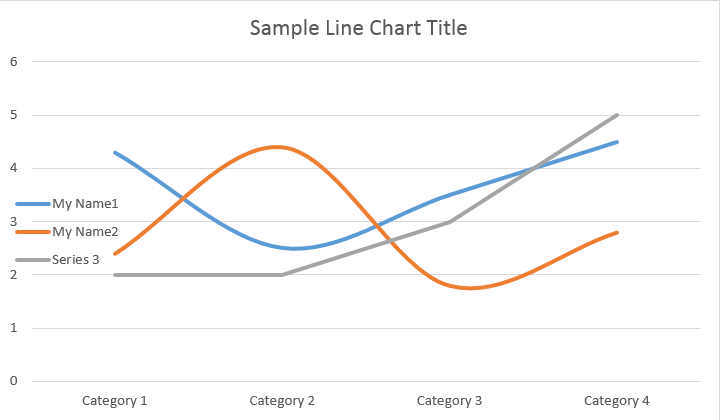
ตัวอย่างเช่นลองเปลี่ยนชื่อแผนภูมิหรือพฤติกรรมตำนาน:

// For complete examples and data files, please go to https://github.com/aspose-words/Aspose.Words-for-Java
Document doc = new Document();
DocumentBuilder builder = new DocumentBuilder(doc);
Shape shape = builder.insertChart(ChartType.LINE, 432, 252);
Chart chart = shape.getChart();
// Determines whether the title shall be shown for this chart. Default is true.
chart.getTitle().setShow(true);
// Setting chart Title.
chart.getTitle().setText("Sample Line Chart Title");
// Determines whether other chart elements shall be allowed to overlap title.
chart.getTitle().setOverlay(false);
// Please note if null or empty value is specified as title text, auto generated title will be shown.
// Determines how legend shall be shown for this chart.
chart.getLegend().setPosition(LegendPosition.LEFT);
chart.getLegend().setOverlay(true);
doc.save(dataDir + "ChartAppearance_out.docx");

รหัสสร้างผลลัพธ์ต่อไปนี้:

line-chart-aspose-words-java-1

วิธีการทำงานกับChartSeriesCollectionของแผนภูมิ

ลองดูในChartSeriesคอลเลกชัน ชุดแผนภูมิทั้งหมดสามารถใช้ได้ผ่านคอลเลกชันchart.getSeries()ซึ่งเป็นIterable:

// For complete examples and data files, please go to https://github.com/aspose-words/Aspose.Words-for-Java
Document doc = new Document();
DocumentBuilder builder = new DocumentBuilder(doc);
Shape shape = builder.insertChart(ChartType.LINE, 432, 252);
// Chart property of Shape contains all chart related options.
Chart chart = shape.getChart();
// Get chart series collection.
ChartSeriesCollection seriesCollection = chart.getSeries();
// Check series count.
System.out.println(seriesCollection.getCount());

คุณสามารถลบชุดหนึ่งโดยหนึ่งหรือล้างทั้งหมดของพวกเขาเช่นเดียวกับการเพิ่มใหม่ถ้าจ แผนภูมิที่แทรกใหม่มีชุดค่าเริ่มต้นบางส่วนเพิ่มในคอลเล็กชันนี้ ในการลบออกคุณจะต้องเรียกวิธีการchart.getSeries().clear().

การทำงานกับชั้นเดียวChartSeries

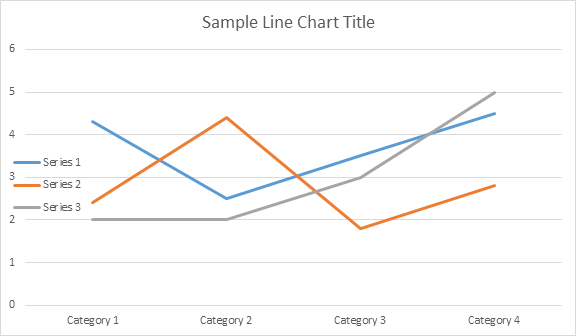
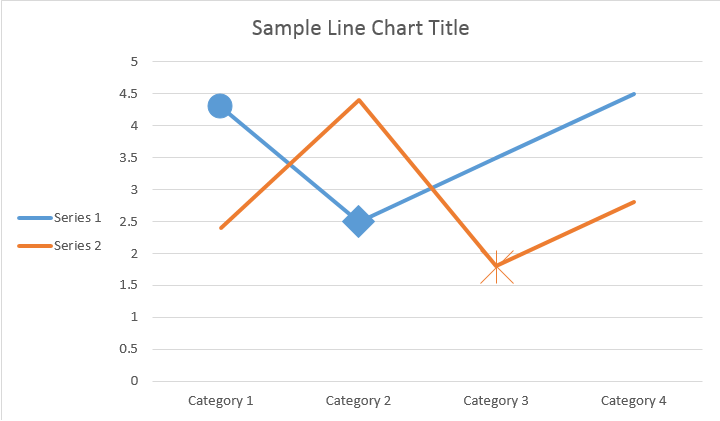
นี่คือวิธีการทำงานกับชุดโดยเฉพาะอย่างยิ่ง.

// For complete examples and data files, please go to https://github.com/aspose-words/Aspose.Words-for-Java
Document doc = new Document();
DocumentBuilder builder = new DocumentBuilder(doc);
Shape shape = builder.insertChart(ChartType.LINE, 432, 252);
// Get first series.
ChartSeries series0 = shape.getChart().getSeries().get(0);
// Get second series.
ChartSeries series1 = shape.getChart().getSeries().get(1);
// Change first series name.
series0.setName("My Name1");
// Change second series name.
series1.setName("My Name2");
// You can also specify whether the line connecting the points on the chart shall be smoothed using Catmull-Rom splines.
series0.setSmooth(true);
series1.setSmooth(true);
doc.save(dataDir + "SingleChartSeries_out.docx");

โปรดดูผลลัพธ์ด้านล่าง:

line-chart-aspose-words-java-2

ทั้งหมดเดียวChartSeriesมีค่าเริ่มต้นChartDataPointตัวเลือก,โปรดลองใช้รหัสต่อไปนี้เพื่อเปลี่ยนพวกเขา:
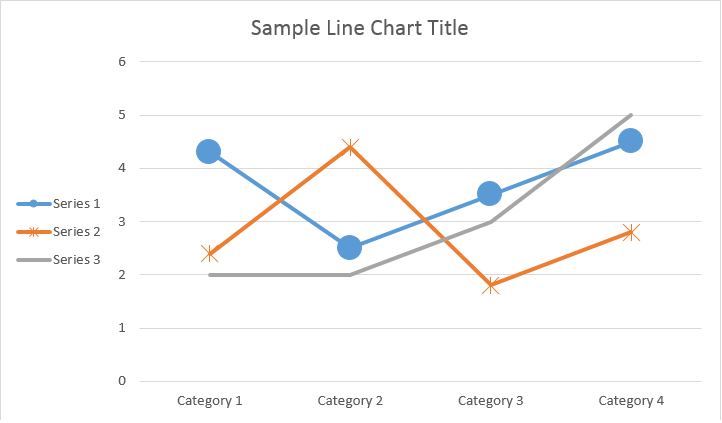
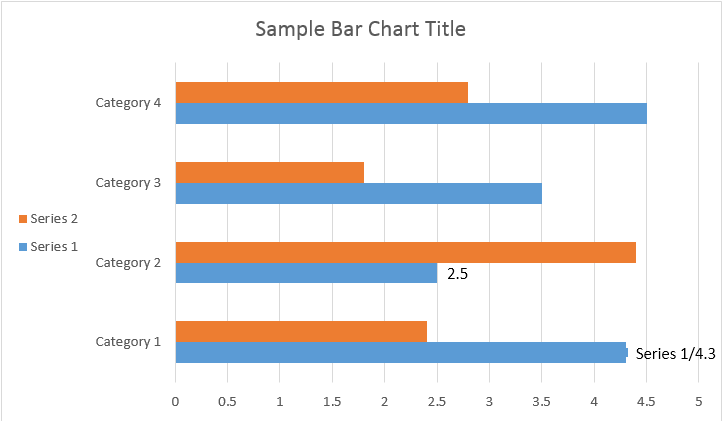
// For complete examples and data files, please go to https://github.com/aspose-words/Aspose.Words-for-Java
Document doc = new Document();
DocumentBuilder builder = new DocumentBuilder(doc);
Shape shape = builder.insertChart(ChartType.LINE, 432, 252);
// Get first series.
ChartSeries series0 = shape.getChart().getSeries().get(0);
// Get second series.
ChartSeries series1 = shape.getChart().getSeries().get(1);
// Specifies whether by default the parent element shall inverts its colors if the value is negative.
series0.setInvertIfNegative(true);
// Set default marker symbol and size.
series0.getMarker().setSymbol(MarkerSymbol.CIRCLE);
series0.getMarker().setSize(15);
series1.getMarker().setSymbol(MarkerSymbol.STAR);
series1.getMarker().setSize(10);
doc.save(dataDir + "ChartDataPoints_out.docx");//

line-chart-aspose-words-java3

วิธีการทำงานกับเดียวChartDataPointของChartSeries

โดยใช้ChartDataPointคุณสามารถปรับแต่งการจัดรูปแบบของจุดข้อมูลเดียวของชุดแผนภูมิ:

// For complete examples and data files, please go to https://github.com/aspose-words/Aspose.Words-for-Java
Document doc = new Document();
DocumentBuilder builder = new DocumentBuilder(doc);
Shape shape = builder.insertChart(ChartType.LINE, 432, 252);
// Get first series.
ChartSeries series0 = shape.getChart().getSeries().get(0);
// Get second series.
ChartSeries series1 = shape.getChart().getSeries().get(1);
ChartDataPointCollection dataPointCollection = series0.getDataPoints();
// Add data point to the first and second point of the first series.
ChartDataPoint dataPoint00 = dataPointCollection.add(0);
ChartDataPoint dataPoint01 = dataPointCollection.add(1);
// Set explosion.
dataPoint00.setExplosion(50);
// Set marker symbol and size.
dataPoint00.getMarker().setSymbol(MarkerSymbol.CIRCLE);
dataPoint00.getMarker().setSize(15);
dataPoint01.getMarker().setSymbol(MarkerSymbol.DIAMOND);
dataPoint01.getMarker().setSize(20);
// Add data point to the third point of the second series.
ChartDataPoint dataPoint12 = series1.getDataPoints().add(2);
dataPoint12.setInvertIfNegative(true);
dataPoint12.getMarker().setSymbol(MarkerSymbol.STAR);
dataPoint12.getMarker().setSize(20);
doc.save(dataDir + "SingleChartDataPointOfAChartSeries_out.docx");

โปรดดูผลลัพธ์ด้านล่าง:

line-chart-aspose-words-java-4

วิธีการทำงานกับChartDataLabelของเดียวChartSeries

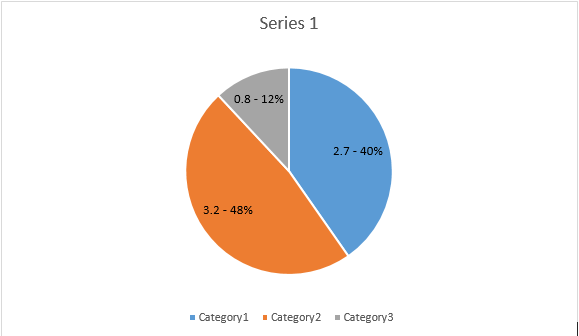
โดยใช้ChartDataLabelคุณสามารถระบุการจัดรูปแบบของฉลากข้อมูลเดียวของชุดแผนภูมิเช่นแสดง/ซ่อนLegendKey, CategoryName, SeriesName, ค่าฯลฯ:

// For complete examples and data files, please go to https://github.com/aspose-words/Aspose.Words-for-Java
Document doc = new Document();
DocumentBuilder builder = new DocumentBuilder(doc);
Shape shape = builder.insertChart(ChartType.BAR, 432, 252);
// Get first series.
ChartSeries series0 = shape.getChart().getSeries().get(0);
series0.hasDataLabels(true);
// Set properties.
series0.getDataLabels().setShowLegendKey(true);
// By default, when you add data labels to the data points in a pie chart, leader lines are displayed for data labels that are
// positioned far outside the end of data points. Leader lines create a visual connection between a data label and its
// corresponding data point.
series0.getDataLabels().setShowLeaderLines(true);
series0.getDataLabels().setShowCategoryName(false);
series0.getDataLabels().setShowPercentage(false);
series0.getDataLabels().setShowSeriesName(true);
series0.getDataLabels().setShowValue(true);
series0.getDataLabels().setSeparator("/");
series0.getDataLabels().setShowValue(true);
doc.save(dataDir + "ChartDataLabelOfASingleChartSeries_out.docx");

โปรดดูผลลัพธ์ด้านล่าง:

bar-chart-aspose-words-java

วิธีการกำหนดตัวเลือกเริ่มต้นสำหรับChartDataLabelsของChartSeries

คลาสChartDataLabelCollectionกำหนดคุณสมบัติที่สามารถใช้เพื่อตั้งค่าตัวเลือกเริ่มต้นสำหรับChartDataLabelsสำหรับแผนภูมิSeries คุณสมบัติเหล่านี้รวมถึงsetShowCategoryName, setShowBubbleSize, setShowPercentage, setShowSeriesName, setShowValue ฯลฯ:

// For complete examples and data files, please go to https://github.com/aspose-words/Aspose.Words-for-Java
Document doc = new Document();
DocumentBuilder builder = new DocumentBuilder(doc);
Shape shape = builder.insertChart(ChartType.PIE, 432, 252);
Chart chart = shape.getChart();
chart.getSeries().clear();
ChartSeries series = chart.getSeries().add("Series 1", new String[] { "Category1", "Category2", "Category3" },
new double[] { 2.7, 3.2, 0.8 });
ChartDataLabelCollection labels = series.getDataLabels();
labels.setShowPercentage(true);
labels.setShowValue(true);
labels.setShowLeaderLines(false);
labels.setSeparator(" - ");
doc.save(dataDir + "Demo.docx");

โปรดดูผลลัพธ์ด้านล่าง:

pie-chart-aspose-words-java

วิธีการจัดรูปแบบจำนวนของฉลากข้อมูลแผนภูมิ

การใช้คุณสมบัติNumberFormatคุณสามารถระบุการจัดรูปแบบหมายเลขของฉลากข้อมูลเดียวของแผนภูมิ.

ตัวอย่างรหัสต่อไปนี้แสดงวิธีการจัดรูปแบบหมายเลขของป้ายข้อมูล:

// For complete examples and data files, please go to https://github.com/aspose-words/Aspose.Words-for-Java
Document doc = new Document();
DocumentBuilder builder = new DocumentBuilder(doc);
// Add chart with default data.
Shape shape = builder.insertChart(ChartType.LINE, 432, 252);
Chart chart = shape.getChart();
chart.getTitle().setText("Data Labels With Different Number Format");
// Delete default generated series.
chart.getSeries().clear();
// Add new series
ChartSeries series0 = chart.getSeries().add("AW Series 0", new String[] { "AW0", "AW1", "AW2" },
new double[] { 2.5, 1.5, 3.5 });
series0.hasDataLabels(true);
// Set currency format code.
series0.getDataLabels().get(0).getNumberFormat().setFormatCode("\"$\"#,##0.00");
// Set date format code.
series0.getDataLabels().get(1).getNumberFormat().setFormatCode("d/mm/yyyy");
// Set percentage format code.
series0.getDataLabels().get(2).getNumberFormat().setFormatCode("0.00%");
// Or you can set format code to be linked to a source cell,
// in this case NumberFormat will be reset to general and inherited from a
// source cell.
series0.getDataLabels().get(2).getNumberFormat().isLinkedToSource(true);
doc.save(dataDir + "NumberFormat_DataLabel_out.docx");

วิธีการตั้งค่าคุณสมบัติแกนแผนภูมิ

หากคุณต้องการทำงานกับแกนแผนภูมิการปรับขนาดและหน่วยแสดงผลสำหรับแกนค่าโปรดใช้ChartAxis,AxisDisplayUnitและAxisScalingคลาส.

ตัวอย่างรหัสต่อไปนี้แสดงวิธีการกำหนดคุณสมบัติของแกน:

// For complete examples and data files, please go to https://github.com/aspose-words/Aspose.Words-for-Java
Document doc = new Document();
DocumentBuilder builder = new DocumentBuilder(doc);
// Insert chart.
Shape shape = builder.insertChart(ChartType.AREA, 432, 252);
Chart chart = shape.getChart();
// Clear demo data.
chart.getSeries().clear();
// Fill data.
chart.getSeries().add("AW Series 1",
new Date[]{new Date(2002, 1, 1), new Date(2002, 6, 1), new Date(2015, 7, 1), new Date(2015, 8, 1), new Date(2015, 9, 1)},
new double[]{640, 320, 280, 120, 150});
ChartAxis xAxis = chart.getAxisX();
ChartAxis yAxis = chart.getAxisY();
// Change the X axis to be category instead of date, so all the points will be put with equal interval on the X axis.
xAxis.setCategoryType(AxisCategoryType.CATEGORY);
// Define X axis properties.
xAxis.setCrosses(AxisCrosses.CUSTOM);
xAxis.setCrossesAt(3); // measured in display units of the Y axis (hundreds)
xAxis.setReverseOrder(true);
xAxis.setMajorTickMark(AxisTickMark.CROSS);
xAxis.setMinorTickMark(AxisTickMark.OUTSIDE);
xAxis.setTickLabelOffset(200);
// Define Y axis properties.
yAxis.setTickLabelPosition(AxisTickLabelPosition.HIGH);
yAxis.setMajorUnit(100);
yAxis.setMinorUnit(50);
yAxis.getDisplayUnit().setUnit(AxisBuiltInUnit.HUNDREDS);
yAxis.getScaling().setMinimum(new AxisBound(100));
yAxis.getScaling().setMaximum(new AxisBound(700));
dataDir = dataDir + "SetAxisProperties_out.docx";
doc.save(dataDir);

วิธีการตั้งค่าDateTimeค่าของแกน

ตัวอย่างรหัสต่อไปนี้แสดงวิธีการตั้งค่าวันที่/เวลาเป็นคุณสมบัติของแกน:

// For complete examples and data files, please go to https://github.com/aspose-words/Aspose.Words-for-Java
Document doc = new Document();
DocumentBuilder builder = new DocumentBuilder(doc);
// Insert chart.
Shape shape = builder.insertChart(ChartType.COLUMN, 432, 252);
Chart chart = shape.getChart();
// Clear demo data.
chart.getSeries().clear();
// Fill data.
chart.getSeries().add("AW Series 1",
new Date[]{new Date(2017, 11, 06), new Date(2017, 11, 9), new Date(2017, 11, 15),
new Date(2017, 11, 21), new Date(2017, 11, 25), new Date(2017, 11, 29)},
new double[]{1.2, 0.3, 2.1, 2.9, 4.2, 5.3}
);
// Set X axis bounds.
ChartAxis xAxis = chart.getAxisX();
xAxis.getScaling().setMinimum(new AxisBound(new Date(2017, 11, 5).getTime()));
xAxis.getScaling().setMaximum(new AxisBound(new Date(2017, 12, 3).getTime()));
// Set major units to a week and minor units to a day.
xAxis.setMajorUnit(7);
xAxis.setMinorUnit(1);
xAxis.setMajorTickMark(AxisTickMark.CROSS);
xAxis.setMinorTickMark(AxisTickMark.OUTSIDE);
dataDir = dataDir + "SetDateTimeValuesToAxis_out.docx";
doc.save(dataDir);

วิธีการจัดรูปแบบจำนวนค่าของแกน

ตัวอย่างรหัสต่อไปนี้แสดงวิธีการเปลี่ยนรูปแบบของตัวเลขบนแกนค่า:

// For complete examples and data files, please go to https://github.com/aspose-words/Aspose.Words-for-Java
Document doc = new Document();
DocumentBuilder builder = new DocumentBuilder(doc);
// Insert chart.
Shape shape = builder.insertChart(ChartType.COLUMN, 432, 252);
Chart chart = shape.getChart();
// Clear demo data.
chart.getSeries().clear();
// Fill data.
chart.getSeries().add("AW Series 1",
new String[]{"Item 1", "Item 2", "Item 3", "Item 4", "Item 5"},
new double[]{1900000, 850000, 2100000, 600000, 1500000});
// Set number format.
chart.getAxisY().getNumberFormat().setFormatCode("#,##0");
dataDir = dataDir + "FormatAxisNumber_out.docx";
doc.save(dataDir);

วิธีการกำหนดขอบเขตของแกน

คลาสAxisBoundแสดงค่าต่ำสุดหรือสูงสุดของค่าแกน ผูกพันสามารถระบุเป็นตัวเลขวันที่เวลาหรือพิเศษ"อัตโนมัติ"ค่า.

ตัวอย่างรหัสต่อไปนี้แสดงวิธีการตั้งค่าขอบเขตของแกน:

// For complete examples and data files, please go to https://github.com/aspose-words/Aspose.Words-for-Java
Document doc = new Document();
DocumentBuilder builder = new DocumentBuilder(doc);
// Insert chart.
Shape shape = builder.insertChart(ChartType.COLUMN, 432, 252);
Chart chart = shape.getChart();
// Clear demo data.
chart.getSeries().clear();
// Fill data.
chart.getSeries().add("AW Series 1",
new String[]{"Item 1", "Item 2", "Item 3", "Item 4", "Item 5"},
new double[]{1.2, 0.3, 2.1, 2.9, 4.2});
chart.getAxisY().getScaling().setMinimum(new AxisBound(0));
chart.getAxisY().getScaling().setMaximum(new AxisBound(6));
dataDir = dataDir + "SetboundsOfAxis_out.docx";
doc.save(dataDir);

วิธีการตั้งค่าหน่วยช่วงเวลาระหว่างฉลาก

ตัวอย่างรหัสต่อไปนี้แสดงวิธีการตั้งค่าหน่วยช่วงเวลาระหว่างป้ายชื่อบนแกน:

// For complete examples and data files, please go to https://github.com/aspose-words/Aspose.Words-for-Java
Document doc = new Document();
DocumentBuilder builder = new DocumentBuilder(doc);
// Insert chart.
Shape shape = builder.insertChart(ChartType.COLUMN, 432, 252);
Chart chart = shape.getChart();
// Clear demo data.
chart.getSeries().clear();
// Fill data.
chart.getSeries().add("AW Series 1",
new String[]{"Item 1", "Item 2", "Item 3", "Item 4", "Item 5"},
new double[]{1.2, 0.3, 2.1, 2.9, 4.2});
chart.getAxisX().setTickLabelSpacing(2);
dataDir = dataDir + "SetIntervalUnitBetweenLabelsOnAxis_out.docx";
doc.save(dataDir);

วิธีการซ่อนแกนแผนภูมิ

หากคุณต้องการแสดงหรือซ่อนแกนแผนภูมิคุณสามารถทำได้โดยการตั้งค่าของคุณสมบัติChartAxis.Hidden.

ตัวอย่างรหัสต่อไปนี้แสดงวิธีการซ่อนแกนของแผนภูมิ:

// For complete examples and data files, please go to https://github.com/aspose-words/Aspose.Words-for-Java
Document doc = new Document();
DocumentBuilder builder = new DocumentBuilder(doc);
// Insert chart.
Shape shape = builder.insertChart(ChartType.COLUMN, 432, 252);
Chart chart = shape.getChart();
// Clear demo data.
chart.getSeries().clear();
// Fill data.
chart.getSeries().add("AW Series 1",
new String[]{"Item 1", "Item 2", "Item 3", "Item 4", "Item 5"},
new double[]{1.2, 0.3, 2.1, 2.9, 4.2});
// Hide the Y axis.
chart.getAxisY().setHidden(true);
dataDir = dataDir + "HideChartAxis_out.docx";
doc.save(dataDir);

วิธีการจัดแนวป้ายชื่อแผนภูมิ

หากคุณต้องการตั้งค่าการจัดตำแหน่งข้อความสำหรับป้ายชื่อหลายบรรทัด คุณสามารถทำได้ง่ายๆ โดยตั้งค่าคุณสมบัติ setTickLabelAlignment().

ตัวอย่างรหัสต่อไปนี้แสดงวิธีการติ๊กการจัดตำแหน่งป้ายกำกับ:

// For complete examples and data files, please go to https://github.com/aspose-words/Aspose.Words-for-Java
Document doc = new Document(dataDir + "Document.docx");
Shape shape = (Shape) doc.getChild(NodeType.SHAPE, 0, true);
ChartAxis axis = shape.getChart().getAxisX();
//This property has effect only for multi-line labels.
axis.setTickLabelAlignment(ParagraphAlignment.RIGHT);
doc.save(dataDir + "Document_out.docx");

วิธีการตั้งค่าการกรอกข้อมูลและการจัดรูปแบบจังหวะ

กรอกข้อมูลและการจัดรูปแบบจังหวะสามารถตั้งค่าสำหรับชุดแผนภูมิจุดข้อมูลและเครื่องห ในการทำเช่นนี้คุณต้องใช้คุณสมบัติของChartFormatชนิดในชั้นเรียนChartSeries,ChartDataPointและChartMarkerรวมทั้งนามแฝงสำหรับคุณสมบัติบางอย่างเช่นForeColor,BackColor,ที่มองเห็นได้และความโปร่งใสในชั้นเรียนStroke.

ตัวอย่างรหัสต่อไปนี้แสดงวิธีการตั้งค่าสีชุด:

Document doc = new Document();
DocumentBuilder builder = new DocumentBuilder(doc);

Shape shape = builder.InsertChart(ChartType.Column, 432, 252);

Chart chart = shape.Chart;
ChartSeriesCollection seriesColl = chart.Series;

// Delete default generated series.
seriesColl.Clear();

// Create category names array.
string[] categories = new string[] { "AW Category 1", "AW Category 2" };

// Adding new series. Value and category arrays must be the same size.
ChartSeries series1 = seriesColl.Add("AW Series 1", categories, new double[] { 1, 2 });
ChartSeries series2 = seriesColl.Add("AW Series 2", categories, new double[] { 3, 4 });
ChartSeries series3 = seriesColl.Add("AW Series 3", categories, new double[] { 5, 6 });

// Set series color.
series1.Format.Fill.ForeColor = Color.Red;
series2.Format.Fill.ForeColor = Color.Yellow;
series3.Format.Fill.ForeColor = Color.Blue;

doc.Save("ColumnColor.docx");

ตัวอย่างรหัสต่อไปนี้แสดงวิธีการตั้งค่าสีและน้ำหนัก:

Document doc = new Document();
DocumentBuilder builder = new DocumentBuilder(doc);

Shape shape = builder.InsertChart(ChartType.Line, 432, 252);

Chart chart = shape.Chart;
ChartSeriesCollection seriesColl = chart.Series;

// Delete default generated series.
seriesColl.Clear();

// Adding new series.
ChartSeries series1 = seriesColl.Add("AW Series 1", new double[] { 0.7, 1.8, 2.6 }, new double[] { 2.7, 3.2, 0.8 });
ChartSeries series2 = seriesColl.Add("AW Series 2", new double[] { 0.5, 1.5, 2.5 }, new double[] { 3, 1, 2 });

// Set series color.
series1.Format.Stroke.ForeColor = Color.Red;
series1.Format.Stroke.Weight = 5;
series2.Format.Stroke.ForeColor = Color.LightGreen;
series2.Format.Stroke.Weight = 5;

doc.Save("LineColorAndWeight.docx");