Analyzing your prompt, please hold on...
An error occurred while retrieving the results. Please refresh the page and try again.
มีการเพิ่มวิธี InsertChart ใหม่ลงในคลาส DocumentBuilder มาดูวิธีแทรกแผนภูมิคอลัมน์อย่างง่ายลงในเอกสารโดยใช้วิธี InsertChart
ในส่วนนี้ เราจะได้เรียนรู้วิธีแทรกแผนภูมิลงในเอกสาร
ตัวอย่างโค้ดต่อไปนี้แสดงวิธีการแทรกแผนภูมิคอลัมน์:
รหัสให้ผลลัพธ์ดังต่อไปนี้:
มีโอเวอร์โหลดที่แตกต่างกันสี่แบบสำหรับวิธีการเพิ่มแบบอนุกรม ซึ่งเปิดเผยให้ครอบคลุมแหล่งข้อมูลรูปแบบต่างๆ ที่เป็นไปได้ทั้งหมดสำหรับแผนภูมิทุกประเภท:
รหัสให้ผลลัพธ์ดังต่อไปนี้:
ตัวอย่างโค้ดต่อไปนี้แสดงวิธีการแทรกแผนภูมิกระจาย:
รหัสให้ผลลัพธ์ดังต่อไปนี้:
ตัวอย่างโค้ดต่อไปนี้แสดงวิธีการแทรกแผนภูมิพื้นที่:
รหัสให้ผลลัพธ์ดังต่อไปนี้:
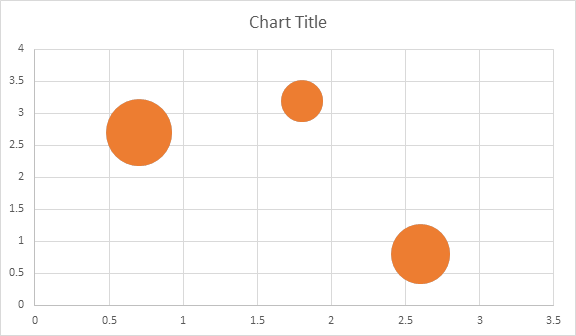
ตัวอย่างโค้ดต่อไปนี้แสดงวิธีการแทรกแผนภูมิฟอง:
รหัสให้ผลลัพธ์ดังต่อไปนี้:
Shape.Chartเมื่อแทรกแผนภูมิและเติมข้อมูลแล้ว คุณจะสามารถเปลี่ยนรูปลักษณ์ได้ คุณสมบัติ Shape.Chart มีตัวเลือกที่เกี่ยวข้องกับแผนภูมิทั้งหมดที่มีอยู่ใน API สาธารณะ
ตัวอย่างเช่น เปลี่ยนชื่อแผนภูมิหรือลักษณะการทำงานของคำอธิบายแผนภูมิ:
รหัสสร้างผลลัพธ์ดังต่อไปนี้:
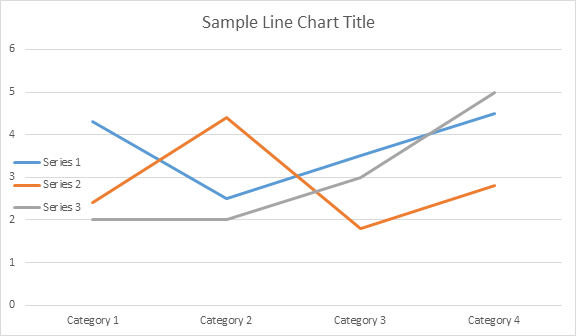
มาดูคอลเลกชัน ChartSeries กันดีกว่า ชุดแผนภูมิทั้งหมดมีอยู่ในคอลเลกชัน chart.Series ซึ่งก็คือ IEnumerable:
คุณสามารถลบซีรีส์ทีละรายการหรือล้างซีรีส์ทั้งหมด รวมถึงเพิ่มซีรี่ส์ใหม่ได้หากจำเป็น แผนภูมิที่แทรกใหม่มีชุดข้อมูลเริ่มต้นบางชุดที่เพิ่มลงในคอลเลกชันนี้ หากต้องการลบออกคุณต้องเรียกใช้วิธี แผนภูมิซีรีส์.เคลียร์()
ต่อไปนี้เป็นวิธีทำงานกับซีรีส์เฉพาะ:
โปรดดูผลลัพธ์ด้านล่าง:
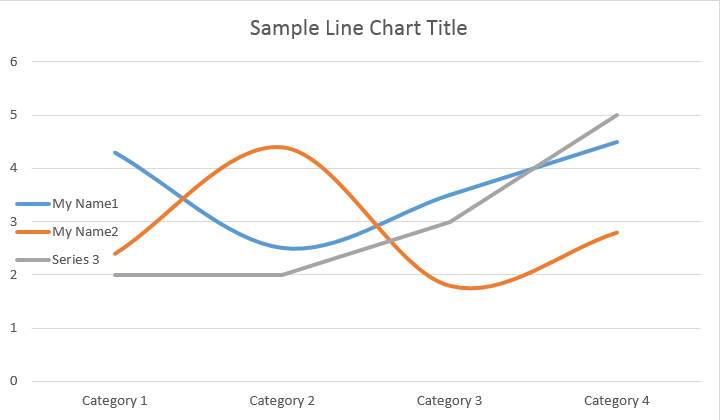
ChartSeries เดียวทั้งหมดมีตัวเลือก ChartDataPoint เริ่มต้น โปรดลองใช้รหัสต่อไปนี้เพื่อเปลี่ยนแปลง:
โปรดดูผลลัพธ์ด้านล่าง:
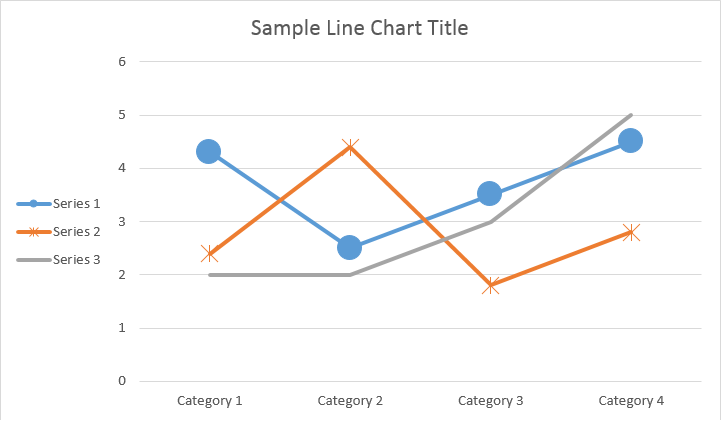
ChartSeriesการใช้ ChartDataPoint คุณสามารถปรับแต่งการจัดรูปแบบของจุดข้อมูลจุดเดียวของชุดแผนภูมิได้:
โปรดดูผลลัพธ์ด้านล่าง:
การใช้ ChartDataLabel ทำให้คุณสามารถระบุการจัดรูปแบบของป้ายกำกับข้อมูลเดียวของชุดแผนภูมิได้ เช่น แสดง/ซ่อน LegendKey, CategoryName, SeriesName, Value ฯลฯ:
โปรดดูผลลัพธ์ด้านล่าง:
คลาส ChartDataLabelCollection กำหนดคุณสมบัติที่สามารถใช้เพื่อตั้งค่าตัวเลือกเริ่มต้นสำหรับ ChartDataLabels สำหรับแผนภูมิ Series คุณสมบัติเหล่านี้ได้แก่ ShowCategoryName, ShowBubbleSize, ShowPercentage, ShowSeriesName, ShowValue ฯลฯ:
โปรดดูผลลัพธ์ด้านล่าง:
การใช้ NumberFormat ทำให้คุณสามารถระบุการจัดรูปแบบตัวเลขของป้ายกำกับข้อมูลเดียวของแผนภูมิได้
ตัวอย่างโค้ดต่อไปนี้แสดงวิธีจัดรูปแบบป้ายกำกับข้อมูลจำนวนหนึ่ง:
หากคุณต้องการทำงานกับแกนแผนภูมิ การปรับขนาด และหน่วยแสดงผลสำหรับแกนค่า โปรดใช้คลาส ChartAxis, AxisDisplayUnit และ AxisScaling
ตัวอย่างโค้ดต่อไปนี้แสดงวิธีกำหนดคุณสมบัติแกน X และ Y:
ตัวอย่างโค้ดต่อไปนี้แสดงวิธีการตั้งค่าวันที่/เวลาให้กับคุณสมบัติของแกน:
ตัวอย่างโค้ดต่อไปนี้แสดงวิธีการเปลี่ยนรูปแบบของตัวเลขบนแกนค่า:
คลาส AxisBound แสดงถึงขอบเขตต่ำสุดหรือสูงสุดของค่าแกน ขอบเขตสามารถระบุเป็นตัวเลข วันที่-เวลา หรือค่า “อัตโนมัติ” พิเศษได้
ตัวอย่างโค้ดต่อไปนี้แสดงวิธีการตั้งค่าขอบเขตของแกน:
ตัวอย่างโค้ดต่อไปนี้แสดงวิธีการตั้งค่าหน่วยช่วงเวลาระหว่างป้ายกำกับบนแกน:
หากคุณต้องการแสดงหรือซ่อนแกนแผนภูมิ คุณสามารถทำได้โดยการตั้งค่าคุณสมบัติ ChartAxis.Hidden
ตัวอย่างโค้ดต่อไปนี้แสดงวิธีการซ่อนแกน Y ของแผนภูมิ:
หากคุณต้องการตั้งค่าการจัดแนวข้อความสำหรับป้ายกำกับหลายบรรทัด คุณสามารถทำได้โดยการตั้งค่าคุณสมบัติ TickLabels.การจัดตำแหน่ง
ตัวอย่างโค้ดต่อไปนี้แสดงวิธีการทำเครื่องหมายการจัดตำแหน่งป้ายกำกับ:
สามารถตั้งค่าการจัดรูปแบบการเติมและเส้นขีดสำหรับชุดแผนภูมิ จุดข้อมูล และเครื่องหมายได้ ในการดำเนินการนี้ คุณจะต้องใช้คุณสมบัติของประเภท ChartFormat ในคลาส ChartSeries, ChartDataPoint และ ChartMarker รวมถึงนามแฝงสำหรับคุณสมบัติบางอย่าง เช่น ForeColor, BackColor, Visible และความโปร่งใสในคลาส Stroke
ตัวอย่างโค้ดต่อไปนี้แสดงวิธีการตั้งค่าสีของซีรี่ส์:
Document doc = new Document();
DocumentBuilder builder = new DocumentBuilder(doc);
Shape shape = builder.InsertChart(ChartType.Column, 432, 252);
Chart chart = shape.Chart;
ChartSeriesCollection seriesColl = chart.Series;
// Delete default generated series.
seriesColl.Clear();
// Create category names array.
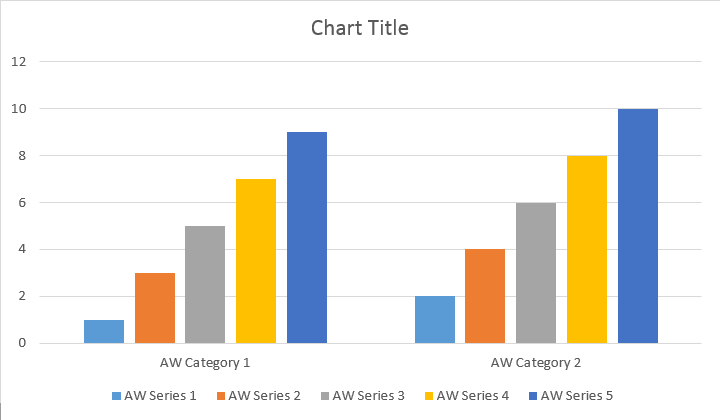
string[] categories = new string[] { "AW Category 1", "AW Category 2" };
// Adding new series. Value and category arrays must be the same size.
ChartSeries series1 = seriesColl.Add("AW Series 1", categories, new double[] { 1, 2 });
ChartSeries series2 = seriesColl.Add("AW Series 2", categories, new double[] { 3, 4 });
ChartSeries series3 = seriesColl.Add("AW Series 3", categories, new double[] { 5, 6 });
// Set series color.
series1.Format.Fill.ForeColor = Color.Red;
series2.Format.Fill.ForeColor = Color.Yellow;
series3.Format.Fill.ForeColor = Color.Blue;
doc.Save(dir + "ColumnColor.docx");
ตัวอย่างโค้ดต่อไปนี้แสดงวิธีการตั้งค่าสีและน้ำหนักของเส้น:
Document doc = new Document();
DocumentBuilder builder = new DocumentBuilder(doc);
Shape shape = builder.InsertChart(ChartType.Line, 432, 252);
Chart chart = shape.Chart;
ChartSeriesCollection seriesColl = chart.Series;
// Delete default generated series.
seriesColl.Clear();
// Adding new series.
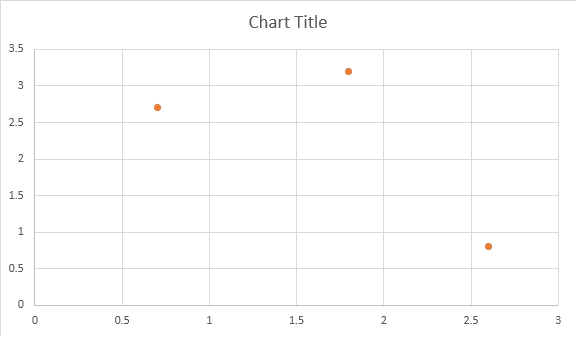
ChartSeries series1 = seriesColl.Add("AW Series 1", new double[] { 0.7, 1.8, 2.6 },
new double[] { 2.7, 3.2, 0.8 });
ChartSeries series2 = seriesColl.Add("AW Series 2", new double[] { 0.5, 1.5, 2.5 },
new double[] { 3, 1, 2 });
// Set series color.
series1.Format.Stroke.ForeColor = Color.Red;
series1.Format.Stroke.Weight = 5;
series2.Format.Stroke.ForeColor = Color.LightGreen;
series2.Format.Stroke.Weight = 5;
doc.Save(dir + "LineColorAndWeight.docx");
Analyzing your prompt, please hold on...
An error occurred while retrieving the results. Please refresh the page and try again.