
Grafiekopmaak voor presentaties op Android
Overzicht
Dit artikel legt uit hoe u grafieken in PowerPoint‑presentaties formatteert met behulp van Aspose.Slides. Het laat zien hoe u belangrijke grafiekelementen zoals assen, rasterlijnen, titels, legenda’s, het plotgebied en wandvullingen aanpast om het uiterlijk en de leesbaarheid van grafiekgegevens te verbeteren.
Het laat ook zien hoe u lettertype‑eigenschappen voor grafiektetst instelt, vooraf ingestelde numerieke opmaak op grafiekgegevens toepast en afgeronde hoeken voor het grafiekgebied inschakelt. Samen laten deze voorbeelden zien hoe u zowel de visuele stijl als de gegevenspresentatie van grafieken in een presentatie kunt beheersen.
Formateer grafiekelementen
Gebruik IChart om grafiektitels, assen, rasterlijnen, legenda’s en het plotgebied te formatteren. Dit voorbeeld maakt een lijngrafiek met markers en standaardgegevens, en past vervolgens afzonderlijke tekst‑ en lijnstijlen toe op de waarde‑ en categorie‑assen. Lettergroottes en lijndiktes worden gespecificeerd in punten; categorielabels worden 45 graden geroteerd.
De waardeas gebruikt setNumberFormat onafhankelijk van de broncellen. De schaal loopt van -2 tot 15, met grote intervallen van 2 en kleine intervallen van 0,5. Het voorbeeld combineert ook procentopmaak met setDisplayUnit ingesteld op duizenden, dus pas deze instellingen aan de betekenis en omvang van uw gegevens aan. De legenda blijft buiten het plotgebied omdat setOverlay wordt aangeroepen met false. Achterwand‑ en vloervullingen worden geconfigureerd via getBackWall en getFloor, maar deze oppervlakken zijn alleen zichtbaar in 3D‑grafieken.
import com.aspose.slides.*;
import android.graphics.Color;

Presentation presentation = new Presentation();
try {
    ISlide slide = presentation.getSlides().get_Item(0);

    IChart chart = slide.getShapes().addChart(ChartType.LineWithMarkers, 50, 50, 500, 400);

    chart.setTitle(true);
    chart.getChartTitle().addTextFrameForOverriding("");
    IPortion chartTitle = chart.getChartTitle().getTextFrameForOverriding().getParagraphs().get_Item(0).getPortions().get_Item(0);
    chartTitle.setText("Sample Chart");
    chartTitle.getPortionFormat().getFillFormat().setFillType(FillType.Solid);
    chartTitle.getPortionFormat().getFillFormat().getSolidFillColor().setColor(Color.GRAY);
    chartTitle.getPortionFormat().setFontHeight(20);
    chartTitle.getPortionFormat().setFontBold(NullableBool.True);
    chartTitle.getPortionFormat().setFontItalic(NullableBool.True);

    chart.getAxes().getVerticalAxis().getMajorGridLinesFormat().getLine().getFillFormat().setFillType(FillType.Solid);
    chart.getAxes().getVerticalAxis().getMajorGridLinesFormat().getLine().getFillFormat().getSolidFillColor().setColor(Color.BLUE);
    chart.getAxes().getVerticalAxis().getMajorGridLinesFormat().getLine().setWidth(5);
    chart.getAxes().getVerticalAxis().getMajorGridLinesFormat().getLine().setDashStyle(LineDashStyle.DashDot);

    chart.getAxes().getVerticalAxis().getMinorGridLinesFormat().getLine().getFillFormat().setFillType(FillType.Solid);
    chart.getAxes().getVerticalAxis().getMinorGridLinesFormat().getLine().getFillFormat().getSolidFillColor().setColor(Color.RED);
    chart.getAxes().getVerticalAxis().getMinorGridLinesFormat().getLine().setWidth(3);

    chart.getAxes().getVerticalAxis().setNumberFormatLinkedToSource(false);
    chart.getAxes().getVerticalAxis().setDisplayUnit(DisplayUnitType.Thousands);
    chart.getAxes().getVerticalAxis().setNumberFormat("0.0%");

    chart.getAxes().getVerticalAxis().setAutomaticMajorUnit(false);
    chart.getAxes().getVerticalAxis().setAutomaticMaxValue(false);
    chart.getAxes().getVerticalAxis().setAutomaticMinorUnit(false);
    chart.getAxes().getVerticalAxis().setAutomaticMinValue(false);

    chart.getAxes().getVerticalAxis().setMaxValue(15f);
    chart.getAxes().getVerticalAxis().setMinValue(-2f);
    chart.getAxes().getVerticalAxis().setMinorUnit(0.5f);
    chart.getAxes().getVerticalAxis().setMajorUnit(2.0f);

    IChartPortionFormat valueAxisText = chart.getAxes().getVerticalAxis().getTextFormat().getPortionFormat();
    valueAxisText.setFontBold(NullableBool.True);
    valueAxisText.setFontHeight(16);
    valueAxisText.setFontItalic(NullableBool.True);
    valueAxisText.getFillFormat().setFillType(FillType.Solid);
    valueAxisText.getFillFormat().getSolidFillColor().setPresetColor(PresetColor.DarkGreen);
    valueAxisText.setLatinFont(new FontData("Times New Roman"));

    chart.getAxes().getVerticalAxis().setTitle(true);
    chart.getAxes().getVerticalAxis().getTitle().addTextFrameForOverriding("");
    IPortion valueAxisTitle = chart.getAxes().getVerticalAxis().getTitle().getTextFrameForOverriding().getParagraphs().get_Item(0).getPortions().get_Item(0);
    valueAxisTitle.setText("Primary Axis");
    valueAxisTitle.getPortionFormat().getFillFormat().setFillType(FillType.Solid);
    valueAxisTitle.getPortionFormat().getFillFormat().getSolidFillColor().setColor(Color.GRAY);
    valueAxisTitle.getPortionFormat().setFontHeight(20);
    valueAxisTitle.getPortionFormat().setFontBold(NullableBool.True);
    valueAxisTitle.getPortionFormat().setFontItalic(NullableBool.True);

    chart.getAxes().getHorizontalAxis().getMajorGridLinesFormat().getLine().getFillFormat().setFillType(FillType.Solid);
    chart.getAxes().getHorizontalAxis().getMajorGridLinesFormat().getLine().getFillFormat().getSolidFillColor().setColor(Color.rgb(0, 128, 0));
    chart.getAxes().getHorizontalAxis().getMajorGridLinesFormat().getLine().setWidth(5);

    chart.getAxes().getHorizontalAxis().getMinorGridLinesFormat().getLine().getFillFormat().setFillType(FillType.Solid);
    chart.getAxes().getHorizontalAxis().getMinorGridLinesFormat().getLine().getFillFormat().getSolidFillColor().setColor(Color.YELLOW);
    chart.getAxes().getHorizontalAxis().getMinorGridLinesFormat().getLine().setWidth(3);

    IChartPortionFormat categoryAxisText = chart.getAxes().getHorizontalAxis().getTextFormat().getPortionFormat();
    categoryAxisText.setFontBold(NullableBool.True);
    categoryAxisText.setFontHeight(16);
    categoryAxisText.setFontItalic(NullableBool.True);
    categoryAxisText.getFillFormat().setFillType(FillType.Solid);
    categoryAxisText.getFillFormat().getSolidFillColor().setColor(Color.BLUE);
    categoryAxisText.setLatinFont(new FontData("Arial"));

    chart.getAxes().getHorizontalAxis().setTitle(true);
    chart.getAxes().getHorizontalAxis().getTitle().addTextFrameForOverriding("");

    IPortion categoryAxisTitle = chart.getAxes().getHorizontalAxis().getTitle().getTextFrameForOverriding().getParagraphs().get_Item(0).getPortions().get_Item(0);
    categoryAxisTitle.setText("Sample Category");
    categoryAxisTitle.getPortionFormat().getFillFormat().setFillType(FillType.Solid);
    categoryAxisTitle.getPortionFormat().getFillFormat().getSolidFillColor().setColor(Color.GRAY);
    categoryAxisTitle.getPortionFormat().setFontHeight(20);
    categoryAxisTitle.getPortionFormat().setFontBold(NullableBool.True);
    categoryAxisTitle.getPortionFormat().setFontItalic(NullableBool.True);

    chart.getAxes().getHorizontalAxis().setTickLabelPosition(TickLabelPositionType.Low);
    chart.getAxes().getHorizontalAxis().setTickLabelRotationAngle(45);

    IChartPortionFormat legendText = chart.getLegend().getTextFormat().getPortionFormat();
    legendText.setFontBold(NullableBool.True);
    legendText.setFontHeight(16);
    legendText.setFontItalic(NullableBool.True);
    legendText.getFillFormat().setFillType(FillType.Solid);
    legendText.getFillFormat().getSolidFillColor().setPresetColor(PresetColor.DarkRed);

    chart.getLegend().setOverlay(false);

    chart.getBackWall().setThickness(1);
    chart.getBackWall().getFormat().getFill().setFillType(FillType.Solid);
    chart.getBackWall().getFormat().getFill().getSolidFillColor().setColor(Color.rgb(255, 165, 0));

    chart.getFloor().getFormat().getFill().setFillType(FillType.Solid);
    chart.getFloor().getFormat().getFill().getSolidFillColor().setColor(Color.RED);

    chart.getPlotArea().getFormat().getFill().setFillType(FillType.Solid);
    chart.getPlotArea().getFormat().getFill().getSolidFillColor().setPresetColor(PresetColor.LightCyan);

    presentation.save("FormattedChart_out.pptx", SaveFormat.Pptx);
} finally {
    presentation.dispose();
}
Stel lettertype‑eigenschappen in voor een grafiek
Stel de standaardlettergrootte voor grafiekttekst in via Chart.getTextFormat. Het voorbeeld maakt een gegroepeerde kolomgrafiek met een lettertype van 20 punten en schakelt waardelabels in voor de eerste serie via setShowValue. Tekstelementen met hun eigen expliciete lettertype‑instellingen kunnen de standaard van de grafiek overschrijven.
import com.aspose.slides.*;

Presentation presentation = new Presentation();
try {
    ISlide slide = presentation.getSlides().get_Item(0);

    IChart chart = slide.getShapes().addChart(ChartType.ClusteredColumn, 100, 100, 500, 400);
    chart.getTextFormat().getPortionFormat().setFontHeight(20);
    chart.getChartData().getSeries().get_Item(0).getLabels().getDefaultDataLabelFormat().setShowValue(true);

    presentation.save("FontPropertiesForChart.pptx", SaveFormat.Pptx);
} finally {
    presentation.dispose();
}
Stel het numerieke formaat in
Gebruik IChartDataCell.setPresetNumberFormat om een ingebouwd getalformaat toe te passen op werkboekcellen van de grafiek. Dit voorbeeld maakt een gegroepeerde kolomgrafiek met standaard, cel‑ondersteunde gegevens en past formaatindex 10 (0.00%) toe op elke waardecel van de serie. Hierdoor wordt de weergave van de waarden in het werkboek aangepast zonder de onderliggende getallen te wijzigen; bijvoorbeeld, 0,25 wordt weergegeven als 25,00%. As‑ en datalabel‑formaten kunnen afzonderlijk worden geconfigureerd.
import com.aspose.slides.*;

Presentation presentation = new Presentation();
try {
    ISlide slide = presentation.getSlides().get_Item(0);

    IChart chart = slide.getShapes().addChart(ChartType.ClusteredColumn, 50, 50, 500, 400);
    IChartSeriesCollection series = chart.getChartData().getSeries();

    for (IChartSeries chartSeries : series)
    {
        for (IChartDataPoint dataPoint : chartSeries.getDataPoints())
        {
            dataPoint.getValue().getAsCell().setPresetNumberFormat((byte) 10); // 0,00%
        }
    }

    presentation.save("PresetNumberFormat_out.pptx", SaveFormat.Pptx);
} finally {
    presentation.dispose();
}
De volgende tabel geeft de ingebouwde getalformaat‑indices weer met representatieve Excel‑formaten voor de Engelse (Verenigde Staten) locale. De exacte opmaak‑strings en hun weergave kunnen variëren per applicatie en locale, met name voor valuta en datums. Sommige Excel‑formaten wijken ook af van de standaardinstellingen in de OOXML‑standaard, zoals beschreven in Microsoft’s number format implementation notes.
| Index | Format |
|---|---|
| 0 | General |
| 1 | 0 |
| 2 | 0.00 |
| 3 | #,##0 |
| 4 | #,##0.00 |
| 5 | "$"#,##0_);("$"#,##0) |
| 6 | "$"#,##0_);[Red]("$"#,##0) |
| 7 | "$"#,##0.00_);("$"#,##0.00) |
| 8 | "$"#,##0.00_);[Red]("$"#,##0.00) |
| 9 | 0% |
| 10 | 0.00% |
| 11 | 0.00E+00 |
| 12 | # ?/? |
| 13 | # ??/?? |
| 14 | m/d/yyyy |
| 15 | d-mmm-yy |
| 16 | d-mmm |
| 17 | mmm-yy |
| 18 | h:mm AM/PM |
| 19 | h:mm:ss AM/PM |
| 20 | h:mm |
| 21 | h:mm:ss |
| 22 | m/d/yyyy h:mm |
| 37 | #,##0_);(#,##0) |
| 38 | #,##0_);[Red](#,##0) |
| 39 | #,##0.00_);(#,##0.00) |
| 40 | #,##0.00_);[Red](#,##0.00) |
| 41 | _(* #,##0_);_(* (#,##0);_(* "-"_);_(@_) |
| 42 | _("$"* #,##0_);_("$"* (#,##0);_("$"* "-"_);_(@_) |
| 43 | _(* #,##0.00_);_(* (#,##0.00);_(* "-"??_);_(@_) |
| 44 | _("$"* #,##0.00_);_("$"* (#,##0.00);_("$"* "-"??_);_(@_) |
| 45 | mm:ss |
| 46 | [h]:mm:ss |
| 47 | mm:ss.0 |
| 48 | ##0.0E+0 |
| 49 | @ |
Stel afgeronde randen in voor het grafiekgebied
Roep IChart.setRoundedCorners aan met true om de hoeken van het grafiekgebied af te ronden. Het voorbeeld maakt een gegroepeerde kolomgrafiek en gebruikt getLineFormat om de omtrek een effen grijze kleur en een enkel‑lijn stijl te geven voordat de presentatie wordt opgeslagen.
import com.aspose.slides.*;
import android.graphics.Color;

Presentation presentation = new Presentation();
try {
    ISlide slide = presentation.getSlides().get_Item(0);

    IChart chart = slide.getShapes().addChart(ChartType.ClusteredColumn, 20, 100, 600, 400);
    chart.getLineFormat().getFillFormat().setFillType(FillType.Solid);
    chart.getLineFormat().getFillFormat().getSolidFillColor().setColor(Color.GRAY);
    chart.getLineFormat().setStyle(LineStyle.Single);
    chart.setRoundedCorners(true);

    presentation.save("out.pptx", SaveFormat.Pptx);
} finally {
    presentation.dispose();
}
Bewerk bestaande grafiekaanmerkingen
Een grafiek kan aangepaste vormen bevatten, zoals een tekst‑annotatie die de status van een rapport uitlegt. Toegang tot deze vormen krijg je via IChart.getUserShapes, ook vermeld onder Chart.getUserShapes in de Chart API‑referentie. De collectie die wordt geretourneerd door getShapes bevat de grafiek‑eigene vormen.
Een gewone tekstvak die boven een grafiek wordt geplaatst behoort tot de dia, zelfs als het eruitziet als onderdeel van de grafiek. Door te itereren over Slide.getShapes vind je de grafiek en gewone dia‑vormen, maar worden de individuele vormen binnen de grafiek niet opgesomd. Grafiektitels en datalabels zijn aparte grafiekelementen, geen aangepaste annotaties in deze collectie.
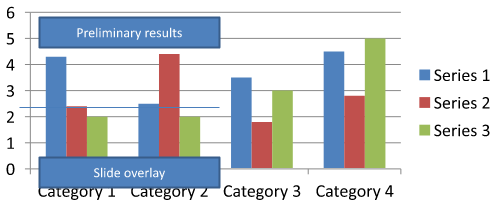
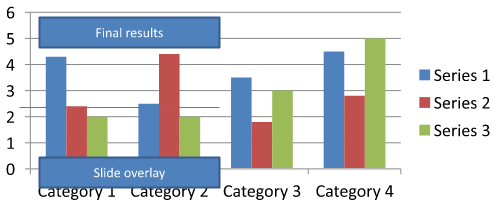
Download chart-annotations.pptx en plaats het in de werkmap van de applicatie. De eerste dia bevat een grafiek met een niet‑gegroepeerde annotatie met de tekst “Preliminary results”, een grafiek‑eigene lijn, en een gewoon dia‑tekstvak met de tekst “Slide overlay”. Het voorbeeld vindt de eerste grafiek op die dia en wijzigt de annotatie naar “Final results” wanneer het rapport klaar is om gepubliceerd te worden. Het controleert op een lege collectie en bewerkt alleen een IAutoShape met een niet‑null tekstframe dat wordt geretourneerd door getTextFrame en de verwachte tekst.
import com.aspose.slides.*;

Presentation presentation = new Presentation("chart-annotations.pptx");
try {
    ISlide slide = presentation.getSlides().get_Item(0);

    IChart chart = null;
    for (IShape shape : slide.getShapes()) {
        if (shape instanceof IChart) {
            chart = (IChart) shape;
            break;
        }
    }

    if (chart == null || chart.getUserShapes().getShapes().size() == 0) {
        System.out.println("No chart or chart-owned shapes found.");
        return;
    }

    boolean updated = false;
    for (IShape shape : chart.getUserShapes().getShapes()) {
        if (shape instanceof IAutoShape) {
            IAutoShape annotation = (IAutoShape) shape;
            if (annotation.getTextFrame() != null && "Preliminary results".equals(annotation.getTextFrame().getText())) {
                annotation.getTextFrame().setText("Final results");
                updated = true;
                break;
            }
        }
    }

    if (updated) {
        presentation.save("chart-annotations-updated.pptx", SaveFormat.Pptx);
    } else {
        System.out.println("No matching text annotation found.");
    }
} finally {
    presentation.dispose();
}
De lijn en het dia‑tekstvak blijven ongewijzigd. De volgende afbeeldingen tonen de invoer en het opgeslagen, opnieuw geopende resultaat:
| Before editing | After editing |
|---|---|
 |
 |
Note
Het voorbeeld inspecteert alleen de chart‑eigene vormen op het hoogste niveau. Als een annotatie zich binnen een IGroupShape bevindt, inspecteer dan ook de getShapes‑collectie van die groep. Herhaal dit recursief voor geneste groepen, en pas dezelfde tekstopdrachten toe op hun onderliggende vormen. Een groep zelf is een container; beschouw het niet als een tekstvak.FAQ
Kan ik halfdoorzichtige vullingen instellen voor kolommen/gebieden terwijl de rand ondoorzichtig blijft?
Ja. Vullings‑transparantie en de omtrek worden afzonderlijk geconfigureerd. Dit is handig om de leesbaarheid van het raster en de gegevens in dichte visualisaties te verbeteren.
Hoe kan ik omgaan met datalabels wanneer ze overlappen?
Verminder de lettergrootte, schakel niet‑essentiële labelonderdelen uit (bijvoorbeeld categorieën), pas de labelpositie aan, toon labels alleen voor geselecteerde punten indien nodig, of wijzig het formaat naar “waarde + legenda”.
Kan ik verloop‑ of patroonvullingen toepassen op series?
Ja. Series ondersteunen effen, verloop‑ en patroonvullingen. Gebruik in de praktijk verloopspunten spaarzaam en vermijd combinaties die het contrast met het raster en de tekst verminderen.