
Formatera presentationsdiagram på Android
Översikt
Den här artikeln förklarar hur du formaterar diagram i PowerPoint-presentationer med hjälp av Aspose.Slides. Den visar hur du anpassar viktiga diagramkomponenter såsom axlar, rutnätlinjer, titlar, förklaringar, plotområdet och väggfyllningar för att förbättra diagrammets utseende och läsbarhet.
Den visar också hur du ställer in teckensnittsegenskaper för diagramtext, använder förinställda numeriska format för diagramdata och aktiverar avrundade hörn för diagramområdet. Tillsammans visar dessa exempel hur du kontrollerar både den visuella stilen och datarepresentationen för diagram i en presentation.
Formatera diagramobjekt
Använd IChart för att formatera diagramtitlar, axlar, rutnätlinjer, förklaringar och plotområdet. Detta exempel skapar ett linjediagram med markörer och standarddata, och tillämpar sedan separata text- och linjestilar på dess värde- och kategoriaxlar. Teckenstorlekar och linjebredder anges i punkter; kategorietiketter roteras 45 grader.
Värdeaxeln använder setNumberFormat oberoende av källcellerna. Dess skala går från -2 till 15, med huvudintervall på 2 och delintervall på 0,5. Exemplet kombinerar även procentformat med setDisplayUnit inställt på tusental, så anpassa dessa inställningar efter din datas betydelse och storlek. Förklaringen placeras utanför plotområdet eftersom setOverlay anropas med false. Bakväggs- och golvfyllningar konfigureras via getBackWall och getFloor, men dessa ytor är bara synliga i 3D-diagram.
import com.aspose.slides.*;
import android.graphics.Color;

Presentation presentation = new Presentation();
try {
    ISlide slide = presentation.getSlides().get_Item(0);

    IChart chart = slide.getShapes().addChart(ChartType.LineWithMarkers, 50, 50, 500, 400);

    chart.setTitle(true);
    chart.getChartTitle().addTextFrameForOverriding("");
    IPortion chartTitle = chart.getChartTitle().getTextFrameForOverriding().getParagraphs().get_Item(0).getPortions().get_Item(0);
    chartTitle.setText("Sample Chart");
    chartTitle.getPortionFormat().getFillFormat().setFillType(FillType.Solid);
    chartTitle.getPortionFormat().getFillFormat().getSolidFillColor().setColor(Color.GRAY);
    chartTitle.getPortionFormat().setFontHeight(20);
    chartTitle.getPortionFormat().setFontBold(NullableBool.True);
    chartTitle.getPortionFormat().setFontItalic(NullableBool.True);

    chart.getAxes().getVerticalAxis().getMajorGridLinesFormat().getLine().getFillFormat().setFillType(FillType.Solid);
    chart.getAxes().getVerticalAxis().getMajorGridLinesFormat().getLine().getFillFormat().getSolidFillColor().setColor(Color.BLUE);
    chart.getAxes().getVerticalAxis().getMajorGridLinesFormat().getLine().setWidth(5);
    chart.getAxes().getVerticalAxis().getMajorGridLinesFormat().getLine().setDashStyle(LineDashStyle.DashDot);

    chart.getAxes().getVerticalAxis().getMinorGridLinesFormat().getLine().getFillFormat().setFillType(FillType.Solid);
    chart.getAxes().getVerticalAxis().getMinorGridLinesFormat().getLine().getFillFormat().getSolidFillColor().setColor(Color.RED);
    chart.getAxes().getVerticalAxis().getMinorGridLinesFormat().getLine().setWidth(3);

    chart.getAxes().getVerticalAxis().setNumberFormatLinkedToSource(false);
    chart.getAxes().getVerticalAxis().setDisplayUnit(DisplayUnitType.Thousands);
    chart.getAxes().getVerticalAxis().setNumberFormat("0.0%");

    chart.getAxes().getVerticalAxis().setAutomaticMajorUnit(false);
    chart.getAxes().getVerticalAxis().setAutomaticMaxValue(false);
    chart.getAxes().getVerticalAxis().setAutomaticMinorUnit(false);
    chart.getAxes().getVerticalAxis().setAutomaticMinValue(false);

    chart.getAxes().getVerticalAxis().setMaxValue(15f);
    chart.getAxes().getVerticalAxis().setMinValue(-2f);
    chart.getAxes().getVerticalAxis().setMinorUnit(0.5f);
    chart.getAxes().getVerticalAxis().setMajorUnit(2.0f);

    IChartPortionFormat valueAxisText = chart.getAxes().getVerticalAxis().getTextFormat().getPortionFormat();
    valueAxisText.setFontBold(NullableBool.True);
    valueAxisText.setFontHeight(16);
    valueAxisText.setFontItalic(NullableBool.True);
    valueAxisText.getFillFormat().setFillType(FillType.Solid);
    valueAxisText.getFillFormat().getSolidFillColor().setPresetColor(PresetColor.DarkGreen);
    valueAxisText.setLatinFont(new FontData("Times New Roman"));

    chart.getAxes().getVerticalAxis().setTitle(true);
    chart.getAxes().getVerticalAxis().getTitle().addTextFrameForOverriding("");
    IPortion valueAxisTitle = chart.getAxes().getVerticalAxis().getTitle().getTextFrameForOverriding().getParagraphs().get_Item(0).getPortions().get_Item(0);
    valueAxisTitle.setText("Primary Axis");
    valueAxisTitle.getPortionFormat().getFillFormat().setFillType(FillType.Solid);
    valueAxisTitle.getPortionFormat().getFillFormat().getSolidFillColor().setColor(Color.GRAY);
    valueAxisTitle.getPortionFormat().setFontHeight(20);
    valueAxisTitle.getPortionFormat().setFontBold(NullableBool.True);
    valueAxisTitle.getPortionFormat().setFontItalic(NullableBool.True);

    chart.getAxes().getHorizontalAxis().getMajorGridLinesFormat().getLine().getFillFormat().setFillType(FillType.Solid);
    chart.getAxes().getHorizontalAxis().getMajorGridLinesFormat().getLine().getFillFormat().getSolidFillColor().setColor(Color.rgb(0, 128, 0));
    chart.getAxes().getHorizontalAxis().getMajorGridLinesFormat().getLine().setWidth(5);

    chart.getAxes().getHorizontalAxis().getMinorGridLinesFormat().getLine().getFillFormat().setFillType(FillType.Solid);
    chart.getAxes().getHorizontalAxis().getMinorGridLinesFormat().getLine().getFillFormat().getSolidFillColor().setColor(Color.YELLOW);
    chart.getAxes().getHorizontalAxis().getMinorGridLinesFormat().getLine().setWidth(3);

    IChartPortionFormat categoryAxisText = chart.getAxes().getHorizontalAxis().getTextFormat().getPortionFormat();
    categoryAxisText.setFontBold(NullableBool.True);
    categoryAxisText.setFontHeight(16);
    categoryAxisText.setFontItalic(NullableBool.True);
    categoryAxisText.getFillFormat().setFillType(FillType.Solid);
    categoryAxisText.getFillFormat().getSolidFillColor().setColor(Color.BLUE);
    categoryAxisText.setLatinFont(new FontData("Arial"));

    chart.getAxes().getHorizontalAxis().setTitle(true);
    chart.getAxes().getHorizontalAxis().getTitle().addTextFrameForOverriding("");

    IPortion categoryAxisTitle = chart.getAxes().getHorizontalAxis().getTitle().getTextFrameForOverriding().getParagraphs().get_Item(0).getPortions().get_Item(0);
    categoryAxisTitle.setText("Sample Category");
    categoryAxisTitle.getPortionFormat().getFillFormat().setFillType(FillType.Solid);
    categoryAxisTitle.getPortionFormat().getFillFormat().getSolidFillColor().setColor(Color.GRAY);
    categoryAxisTitle.getPortionFormat().setFontHeight(20);
    categoryAxisTitle.getPortionFormat().setFontBold(NullableBool.True);
    categoryAxisTitle.getPortionFormat().setFontItalic(NullableBool.True);

    chart.getAxes().getHorizontalAxis().setTickLabelPosition(TickLabelPositionType.Low);
    chart.getAxes().getHorizontalAxis().setTickLabelRotationAngle(45);

    IChartPortionFormat legendText = chart.getLegend().getTextFormat().getPortionFormat();
    legendText.setFontBold(NullableBool.True);
    legendText.setFontHeight(16);
    legendText.setFontItalic(NullableBool.True);
    legendText.getFillFormat().setFillType(FillType.Solid);
    legendText.getFillFormat().getSolidFillColor().setPresetColor(PresetColor.DarkRed);

    chart.getLegend().setOverlay(false);

    chart.getBackWall().setThickness(1);
    chart.getBackWall().getFormat().getFill().setFillType(FillType.Solid);
    chart.getBackWall().getFormat().getFill().getSolidFillColor().setColor(Color.rgb(255, 165, 0));

    chart.getFloor().getFormat().getFill().setFillType(FillType.Solid);
    chart.getFloor().getFormat().getFill().getSolidFillColor().setColor(Color.RED);

    chart.getPlotArea().getFormat().getFill().setFillType(FillType.Solid);
    chart.getPlotArea().getFormat().getFill().getSolidFillColor().setPresetColor(PresetColor.LightCyan);

    presentation.save("FormattedChart_out.pptx", SaveFormat.Pptx);
} finally {
    presentation.dispose();
}
Ställ in teckensnitts‑egenskaper för ett diagram
Ställ in standardteckensnittsstorlek för diagramtext via Chart.getTextFormat. Exemplet skapar ett grupperat stapeldiagram med 20‑punkts teckensnitt och aktiverar värdeetiketter för den första serien via setShowValue. Textelement med egna explicita teckensnittsinställningar kan åsidosätta diagrammets standard.
import com.aspose.slides.*;

Presentation presentation = new Presentation();
try {
    ISlide slide = presentation.getSlides().get_Item(0);

    IChart chart = slide.getShapes().addChart(ChartType.ClusteredColumn, 100, 100, 500, 400);
    chart.getTextFormat().getPortionFormat().setFontHeight(20);
    chart.getChartData().getSeries().get_Item(0).getLabels().getDefaultDataLabelFormat().setShowValue(true);

    presentation.save("FontPropertiesForChart.pptx", SaveFormat.Pptx);
} finally {
    presentation.dispose();
}
Ställ in det numeriska formatet
Använd IChartDataCell.setPresetNumberFormat för att applicera ett inbyggt nummerformat på diagrammets arbetsboksceller. Detta exempel skapar ett grupperat stapeldiagram med standard‑, cell‑stödd data och tillämpar formatindex 10 (0.00%) på varje serie‑värdecell. Detta ändrar hur värdena visas i arbetsboken utan att ändra de underliggande siffrorna; exempelvis visas 0,25 som 25,00 %. Axel‑ och dataetikettformat kan konfigureras separat.
import com.aspose.slides.*;

Presentation presentation = new Presentation();
try {
    ISlide slide = presentation.getSlides().get_Item(0);

    IChart chart = slide.getShapes().addChart(ChartType.ClusteredColumn, 50, 50, 500, 400);
    IChartSeriesCollection series = chart.getChartData().getSeries();

    for (IChartSeries chartSeries : series)
    {
        for (IChartDataPoint dataPoint : chartSeries.getDataPoints())
        {
            dataPoint.getValue().getAsCell().setPresetNumberFormat((byte) 10); // 0,00%
        }
    }

    presentation.save("PresetNumberFormat_out.pptx", SaveFormat.Pptx);
} finally {
    presentation.dispose();
}
Följande tabell listar inbyggda nummerformat‑index med representativa Excel‑format för den engelska (USA)‑lokalen. Exakta formatsträngar och hur de visas kan variera mellan applikationer och språk, särskilt för valuta och datum. Vissa Excel‑format skiljer sig också från standarderna i OOXML, enligt Microsoft’s number format implementation notes.
| Index | Format |
|---|---|
| 0 | General |
| 1 | 0 |
| 2 | 0.00 |
| 3 | #,##0 |
| 4 | #,##0.00 |
| 5 | "$"#,##0_);("$"#,##0) |
| 6 | "$"#,##0_);[Red]("$"#,##0) |
| 7 | "$"#,##0.00_);("$"#,##0.00) |
| 8 | "$"#,##0.00_);[Red]("$"#,##0.00) |
| 9 | 0% |
| 10 | 0.00% |
| 11 | 0.00E+00 |
| 12 | # ?/? |
| 13 | # ??/?? |
| 14 | m/d/yyyy |
| 15 | d-mmm-yy |
| 16 | d-mmm |
| 17 | mmm-yy |
| 18 | h:mm AM/PM |
| 19 | h:mm:ss AM/PM |
| 20 | h:mm |
| 21 | h:mm:ss |
| 22 | m/d/yyyy h:mm |
| 37 | #,##0_);(#,##0) |
| 38 | #,##0_);[Red](#,##0) |
| 39 | #,##0.00_);(#,##0.00) |
| 40 | #,##0.00_);[Red](#,##0.00) |
| 41 | _(* #,##0_);_(* (#,##0);_(* "-"_);_(@_) |
| 42 | _("$"* #,##0_);_("$"* (#,##0);_("$"* "-"_);_(@_) |
| 43 | _(* #,##0.00_);_(* (#,##0.00);_(* "-"??_);_(@_) |
| 44 | _("$"* #,##0.00_);_("$"* (#,##0.00);_("$"* "-"??_);_(@_) |
| 45 | mm:ss |
| 46 | [h]:mm:ss |
| 47 | mm:ss.0 |
| 48 | ##0.0E+0 |
| 49 | @ |
Ställ in avrundade kanter för diagramområdet
Anropa IChart.setRoundedCorners med true för att avrunda hörnen på diagramområdet. Exemplet skapar ett grupperat stapeldiagram och använder getLineFormat för att ge dess kontur en solid grå färg och en enkel linjestil innan presentationen sparas.
import com.aspose.slides.*;
import android.graphics.Color;

Presentation presentation = new Presentation();
try {
    ISlide slide = presentation.getSlides().get_Item(0);

    IChart chart = slide.getShapes().addChart(ChartType.ClusteredColumn, 20, 100, 600, 400);
    chart.getLineFormat().getFillFormat().setFillType(FillType.Solid);
    chart.getLineFormat().getFillFormat().getSolidFillColor().setColor(Color.GRAY);
    chart.getLineFormat().setStyle(LineStyle.Single);
    chart.setRoundedCorners(true);

    presentation.save("out.pptx", SaveFormat.Pptx);
} finally {
    presentation.dispose();
}
Redigera befintliga diagramanteckningar
Ett diagram kan innehålla anpassade former, till exempel en textanteckning som förklarar statusen för en rapport. Åtkomst till dessa former sker via IChart.getUserShapes, även listad under Chart.getUserShapes i Diagram‑API‑referensen. Samlingen som returneras av getShapes innehåller de diagram‑ägdde formerna.
En vanlig textruta placerad ovanpå ett diagram tillhör sliden, även om den ser ut som en del av diagrammet. Genom att iterera över Slide.getShapes hittas diagrammet samt vanliga slide‑former, men inte de enskilda formerna inuti diagrammet. Diagramtitlar och datalabels är separata diagramelement, inte anpassade anteckningar i denna samling.
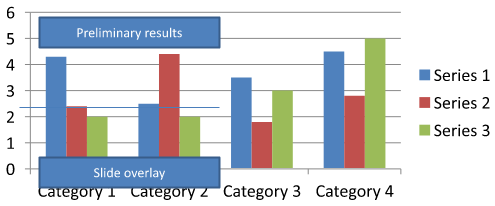
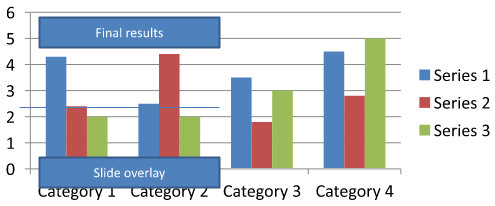
Ladda ner chart-annotations.pptx och placera den i applikationens arbetskatalog. Dess första bild innehåller ett diagram med en odelad anteckning som säger “Preliminary results”, en diagram‑ägd linje och en vanlig slide‑textruta med texten “Slide overlay”. Exemplet hittar det första diagrammet på den bilden och ändrar anteckningen till “Final results” när rapporten är klar för publicering. Det kontrollerar om samlingen är tom och redigerar endast en IAutoShape med en icke‑null text‑ram som returneras av getTextFrame och den förväntade texten.
import com.aspose.slides.*;

Presentation presentation = new Presentation("chart-annotations.pptx");
try {
    ISlide slide = presentation.getSlides().get_Item(0);

    IChart chart = null;
    for (IShape shape : slide.getShapes()) {
        if (shape instanceof IChart) {
            chart = (IChart) shape;
            break;
        }
    }

    if (chart == null || chart.getUserShapes().getShapes().size() == 0) {
        System.out.println("No chart or chart-owned shapes found.");
        return;
    }

    boolean updated = false;
    for (IShape shape : chart.getUserShapes().getShapes()) {
        if (shape instanceof IAutoShape) {
            IAutoShape annotation = (IAutoShape) shape;
            if (annotation.getTextFrame() != null && "Preliminary results".equals(annotation.getTextFrame().getText())) {
                annotation.getTextFrame().setText("Final results");
                updated = true;
                break;
            }
        }
    }

    if (updated) {
        presentation.save("chart-annotations-updated.pptx", SaveFormat.Pptx);
    } else {
        System.out.println("No matching text annotation found.");
    }
} finally {
    presentation.dispose();
}
Linjen och slide‑textrutan förblir oförändrade. Följande bilder visar indata och det sparade, återöppnade resultatet:
| Före redigering | Efter redigering |
|---|---|
 |
 |
Note
Exemplet granskar endast diagram‑ägdde former på top‑nivå. Om en anteckning finns i en IGroupShape, inspektera även den gruppens getShapes‑samling. Upprepa detta rekursivt för inbäddade grupper och tillämpa samma textkontroller på deras barnformer. En grupp är i sig en behållare; behandla den inte som en textruta.FAQ
Kan jag ange halvtransparenta fyllningar för kolumner/områden samtidigt som kanten förblir ogenomskinlig?
Ja. Fyllnadens transparens och konturen konfigureras separat. Detta är användbart för att förbättra läsbarheten av rutnätet och data i täta visualiseringar.
Hur hanterar jag dataetiketter när de överlappar?
Minska teckenstorleken, inaktivera icke‑viktiga etikettkomponenter (till exempel kategorier), justera etikettpositionen, visa etiketter endast för utvalda punkter om nödvändigt, eller byt format till “värde + förklaring”.
Kan jag applicera gradient‑ eller mönsterfyllningar på serier?
Ja. Serier stödjer solida, gradient‑ och mönsterfyllningar. Använd gradienter sparsamt i praktiken och undvik kombinationer som minskar kontrasten mot rutnätet och texten.