Display Multiple Columns in Rendered Gantt Chart Image
Overview
In Microsoft Project, project data can be represented both in textual form and graphically as charts. The most common chart types include Gantt Chart, Task Usage, and Resource Usage. Aspose.Tasks for .NET supports rendering project data as graphical charts.
This article describes two approaches for customizing project columns displayed in a Gantt chart and demonstrates how to render the chart to an image.
Gantt Chart
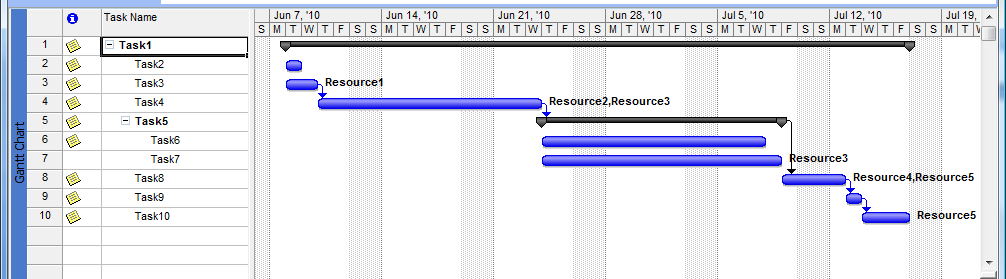
A Gantt chart is a timeline-based graphical representation of project tasks, segmented by days, weeks, or months. A project typically consists of tasks assigned to resources. An individual task may be divided into subtasks. Each task has a start and end date that defines its duration. A Gantt chart in Microsoft Project provides a visual overview of this information.
The following screenshot shows a typical Gantt chart in Microsoft Project:
Gantt Chart Image in Aspose.Tasks for .NET
In Aspose.Tasks for .NET, the Project class is the primary class for working with project files. It exposes multiple overloads of the Save method to export project data to various formats.
For example, the Save(string, SaveOptions) overload:
- The first parameter specifies the output file name.
- The second parameter accepts an instance of a class derived from
SaveOptions, such asPdfSaveOptionsfor PDF format.
SaveOptions Type
Rendering behavior can be customized using properties of the SaveOptions class or one of its inheritors. For example:
- Use
SaveOptions.CustomPageSizeto define the output page size. - Use
SaveOptions.LegendOnEachPageto control whether a legend appears on each page.
1PdfSaveOptions saveOptions = new PdfSaveOptions()
2{
3    CustomPageSize = new SizeF(800, 600),
4    LegendOnEachPage = false
5};
There are at least two approaches to customize the appearance of the rendered Gantt chart.
Customize Gantt Chart Columns Using ProjectView
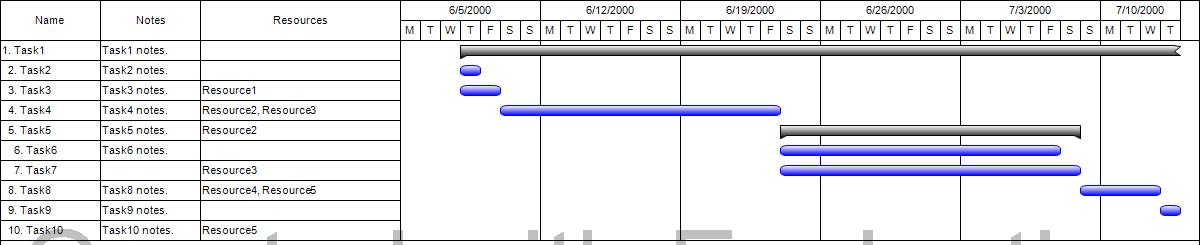
This approach is considered obsolete and is unlikely to be extended in future releases. The ProjectView class provides limited functionality and allows specifying a set of columns to be included in the output image.
To use it, create a list of GanttChartColumn instances and pass them to the ProjectView constructor. Then assign this view to the SaveOptions.View property.
 1// Create the view columns
 2var columns = new List<GanttChartColumn>();
 3columns.Add(new GanttChartColumn("Name", 100, new TaskToColumnTextConverter(TaskName)));
 4columns.Add(new GanttChartColumn("Notes", 100, new TaskToColumnTextConverter(TaskNotes)));
 5columns.Add(new GanttChartColumn("Resources", 200, new TaskToColumnTextConverter(TaskResources)));
 6
 7// Create the view
 8ProjectView projectView = new ProjectView(columns);
 9
10// Create SaveOptions
11PdfSaveOptions saveOptions = new PdfSaveOptions()
12{
13    CustomPageSize = new SizeF(800, 600),
14    View = projectView
15};
16
17// Save the project to PDF
18project.Save("output.pdf", saveOptions);
The GanttChartColumn constructor accepts three arguments: the column name, column width, and a TaskToColumnTextConverter delegate that converts task data to display text. Example implementations:
1private string TaskName(Task task)
2{
3 StringBuilder res = new StringBuilder();
4 for (int i = 1; i < task.OutlineLevel; i++)
5 {
6 res.Append(" ");
7 }
8
9 res.AppendFormat("{0}. {1}", task.Id, task.Name);
10 return res.ToString();
11}
12
13private string TaskNameHtml(Task task)
14{
15 StringBuilder res = new StringBuilder();
16 for (int i = 1; i < task.OutlineLevel; i++)
17 {
18 res.Append(" ");
19 }
20
21 res.AppendFormat("{0}. {1}", task.Id, task.Name);
22 return res.ToString();
23}
24
25private string TaskNotes(Task task)
26{
27 return task.NotesText ?? string.Empty;
28}
29
30private string TaskResources(Task task)
31{
32 StringBuilder res = new StringBuilder();
33 Project project = task.ParentProject;
34 bool bFirst = true;
35 foreach (ResourceAssignment assignment in project.GetResourceAssignmentsByTask(task))
36 {
37 if (assignment.Resource != null)
38 {
39 if (!bFirst)
40 {
41 res.Append(", ");
42 }
43
44 res.Append(assignment.Resource.Name);
45 bFirst = false;
46 }
47 }
48
49 return res.ToString();
50}Below are examples of resulting images exported using the above code:
Customize Gantt Chart Columns Using View
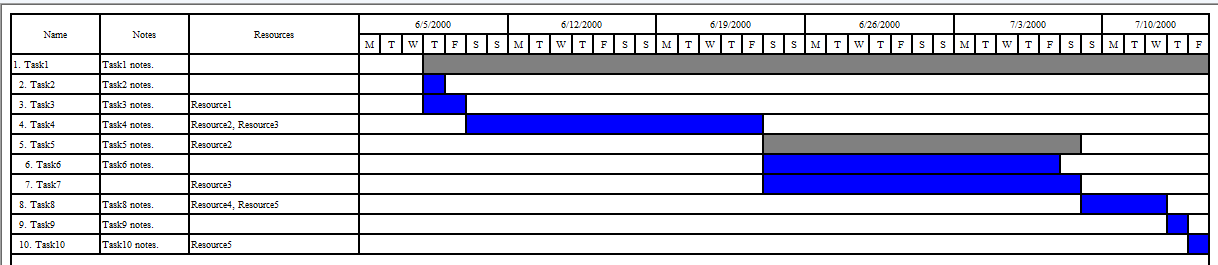
Using the View class and its inheritors is the recommended approach for customizing chart output. The View class corresponds to the view settings in Microsoft Project and provides a richer API compared to ProjectView.
An existing view can be retrieved from the Views collection (for MPP files), customized, and passed to the Project.Save method via the SaveOptions.ViewSettings property.
The following example demonstrates how to retrieve an existing view from an MPP file, insert a new column into it, and use this view for rendering the Gantt chart.
 1Project project = new Project("input.mpp");
 2
 3// Get existing view
 4var view = (GanttChartView) project.Views.GetByName("&Gantt Chart");
 5
 6// Define and insert new column
 7TableField field = new TableField()
 8{
 9    AlignData = StringAlignment.Far,
10    Width = 50,
11    Field = Field.TaskName,
12    Title = "Task name"
13};
14
15view.Table.TableFields.Insert(1, field);
16
17PdfSaveOptions saveOptions = new PdfSaveOptions()
18{
19    ViewSettings = view
20};
21
22project.Save("output.pdf", saveOptions);
Conclusion
Aspose.Tasks for .NET provides multiple options for customizing Gantt chart rendering. Although ProjectView allows basic configuration, its functionality is limited and it is considered deprecated.
For more advanced control and alignment with Microsoft Project’s visual structure, the use of View and its associated classes is recommended. This approach provides better flexibility and is suitable for working with views defined in MPP files or for programmatically configuring new view layouts.