Analyzing your prompt, please hold on...
An error occurred while retrieving the results. Please refresh the page and try again.
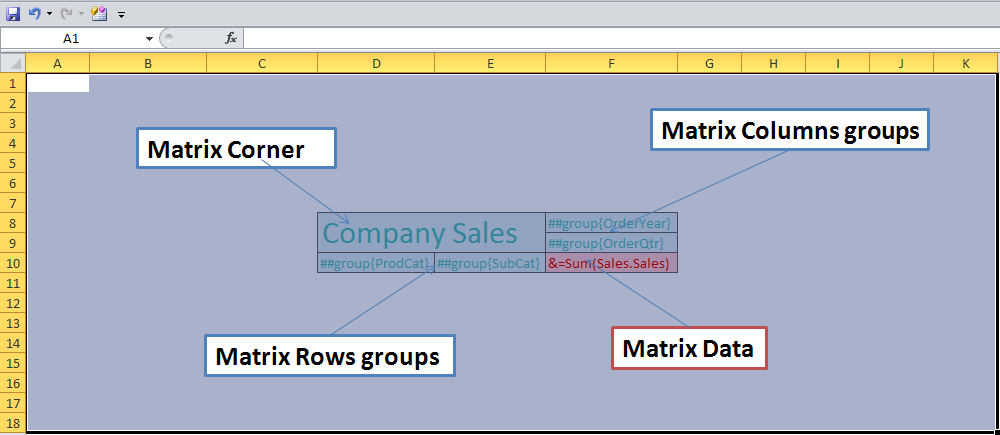
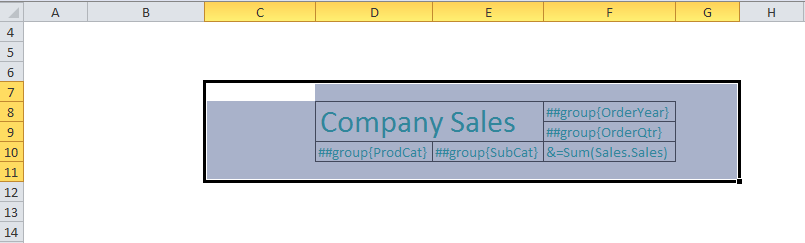
In an Aspose.Cells report template, a matrix consists of a corner, row groups, column groups and data portions. A sample matrix is shown below.
A sample matrix
Before creating a matrix report, create the data sources, datasets and report parameters (optional). (Follow the instructions in Data Sources and Queries if you need assistance.) In the sample, we use the AdventureWorks sample database that ships with SQL Server Reporting Services 2008.
To create a new matrix:
Open Microsoft Excel.
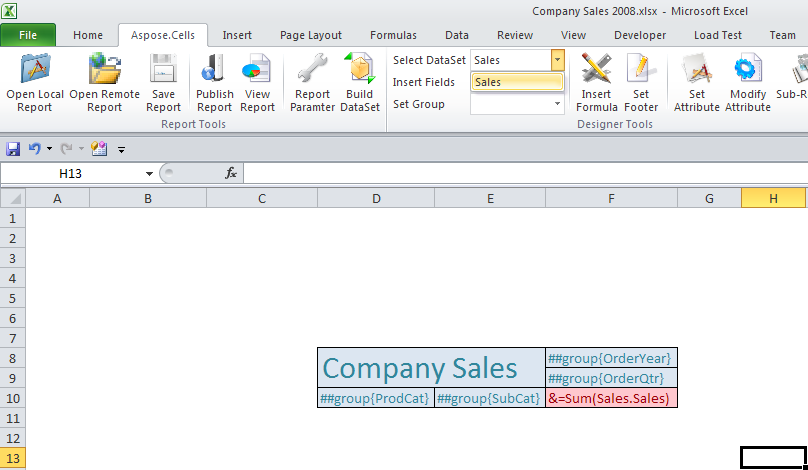
Click Open Report to open an RDL report file that contains the data sources, datasets and report parameters created in advance. Once the file has been opened successfully, all its information is available for use; for example, its datasets are listed in the DataSet list.
Open a Microsoft Excel worksheet and select a data set.
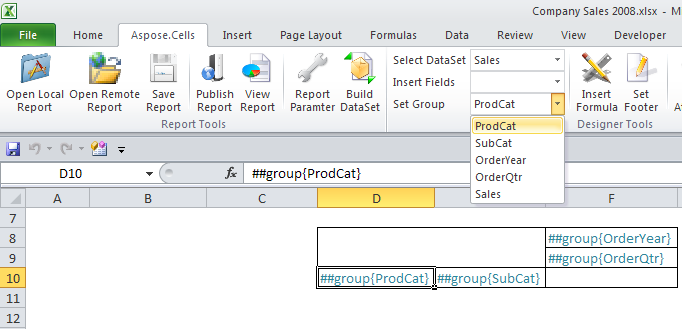
Set row groups and column groups through Set Group.
Merge cells to set the matrix corner.
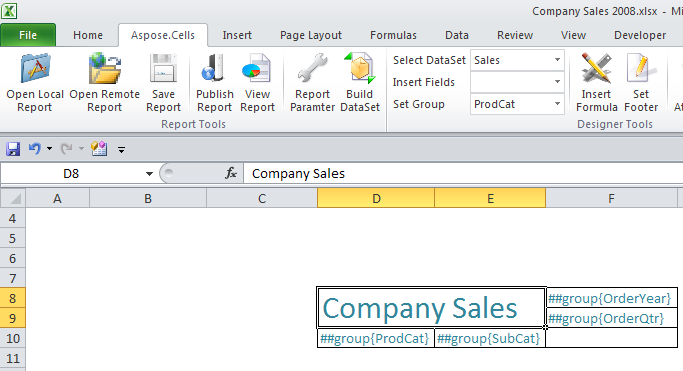
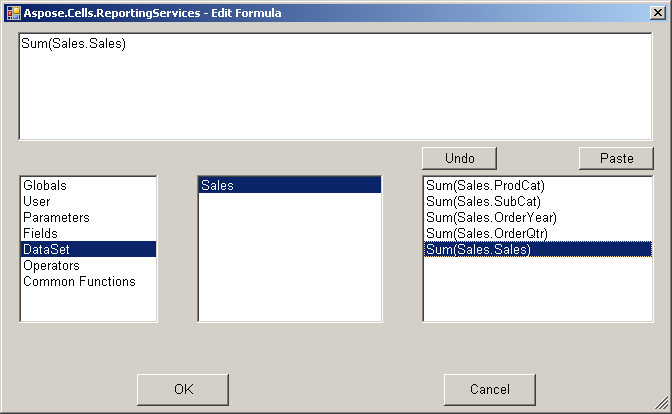
Set the matrix corner by inserting a formula.
Click Set Attribute to set matrix attributes.
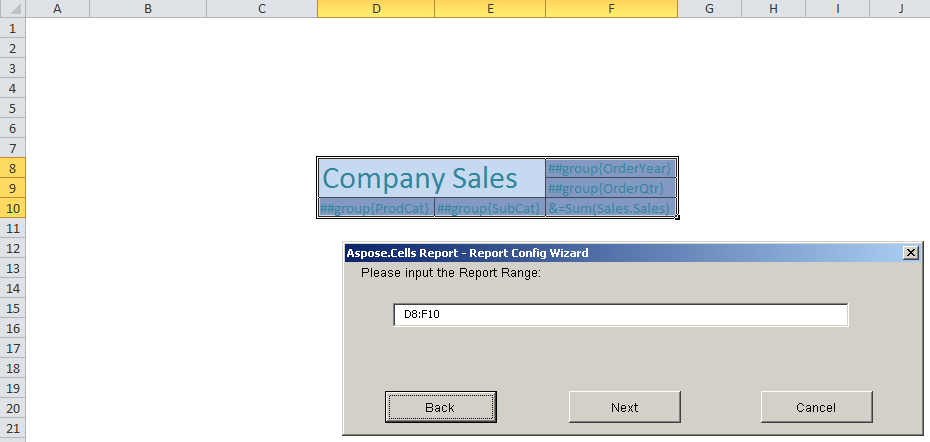
These attributes consist of name, range, group, and order.
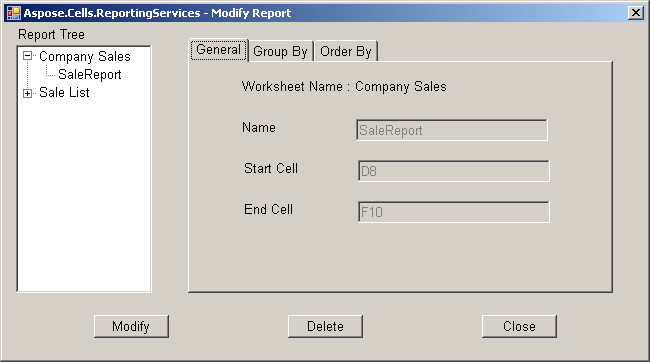
Clicking Modify Attribute checks and modifies all matrix attributes of the current worksheet.
Save, publish, and review the report.
Analyzing your prompt, please hold on...
An error occurred while retrieving the results. Please refresh the page and try again.