Working with Charts
New InsertChart method was added into the DocumentBuilder class. So, let’s see how to insert a simple column chart into the document using the InsertChart method.
How to Insert a Chart
In this section we will learn how to insert a chart into a document.
Insert Column Chart
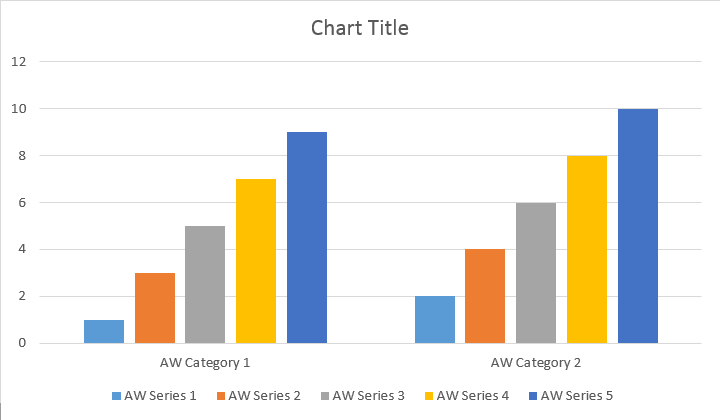
The following code example shows how to insert column chart:
// For complete examples and data files, please go to https://github.com/aspose-words/Aspose.Words-for-.NET.git. | |
Document doc = new Document(); | |
DocumentBuilder builder = new DocumentBuilder(doc); | |
// You can specify different chart types and sizes. | |
Shape shape = builder.InsertChart(ChartType.Column, 432, 252); | |
Chart chart = shape.Chart; | |
ChartSeriesCollection seriesColl = chart.Series; | |
Console.WriteLine(seriesColl.Count); | |
// Delete default generated series. | |
seriesColl.Clear(); | |
// Create category names array, in this example we have two categories. | |
string[] categories = new string[] { "Category 1", "Category 2" }; | |
// Please note, data arrays must not be empty and arrays must be the same size. | |
seriesColl.Add("Aspose Series 1", categories, new double[] { 1, 2 }); | |
seriesColl.Add("Aspose Series 2", categories, new double[] { 3, 4 }); | |
seriesColl.Add("Aspose Series 3", categories, new double[] { 5, 6 }); | |
seriesColl.Add("Aspose Series 4", categories, new double[] { 7, 8 }); | |
seriesColl.Add("Aspose Series 5", categories, new double[] { 9, 10 }); | |
doc.Save(ArtifactsDir + "WorkingWithCharts.InsertSimpleColumnChart.docx"); |
The code produces the following result:
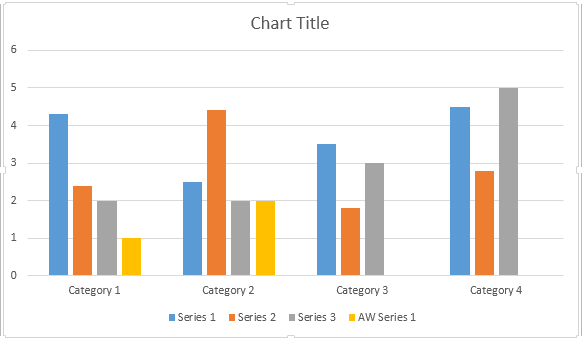
There are four different overloads for series Add method, which was exposed to cover all possible variants of data sources for all chart types:
// For complete examples and data files, please go to https://github.com/aspose-words/Aspose.Words-for-.NET.git. | |
Document doc = new Document(); | |
DocumentBuilder builder = new DocumentBuilder(doc); | |
Shape shape = builder.InsertChart(ChartType.Column, 432, 252); | |
Chart chart = shape.Chart; | |
chart.Series.Add("Aspose Series 1", new string[] { "Category 1", "Category 2" }, new double[] { 1, 2 }); | |
doc.Save(ArtifactsDir + "WorkingWithCharts.InsertColumnChart.docx"); |
The code produces the following result:
Insert Scatter Chart
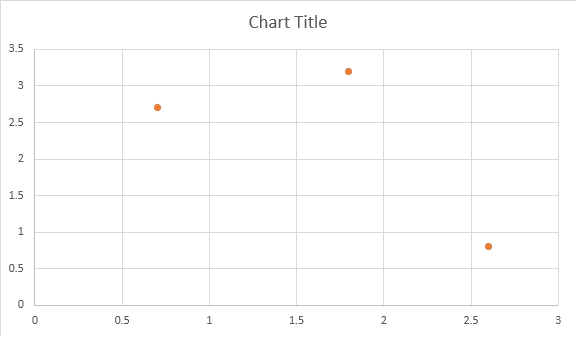
The following code example shows how to insert a scatter chart:
// For complete examples and data files, please go to https://github.com/aspose-words/Aspose.Words-for-.NET.git. | |
Document doc = new Document(); | |
DocumentBuilder builder = new DocumentBuilder(doc); | |
Shape shape = builder.InsertChart(ChartType.Scatter, 432, 252); | |
Chart chart = shape.Chart; | |
chart.Series.Add("Aspose Series 1", new double[] { 0.7, 1.8, 2.6 }, new double[] { 2.7, 3.2, 0.8 }); | |
doc.Save(ArtifactsDir + "WorkingWithCharts.InsertScatterChart.docx"); |
The code produces the following result:
Insert Area Chart
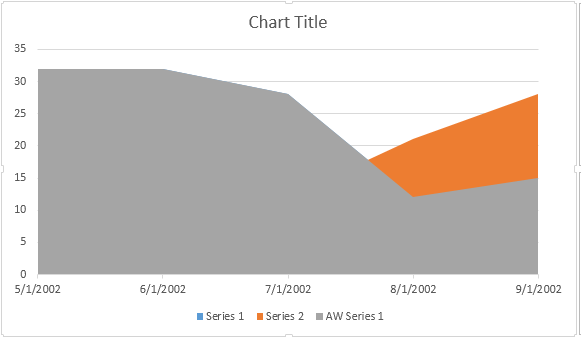
The following code example shows how to insert an area chart:
// For complete examples and data files, please go to https://github.com/aspose-words/Aspose.Words-for-.NET.git. | |
Document doc = new Document(); | |
DocumentBuilder builder = new DocumentBuilder(doc); | |
Shape shape = builder.InsertChart(ChartType.Area, 432, 252); | |
Chart chart = shape.Chart; | |
chart.Series.Add("Aspose Series 1", new [] | |
{ | |
new DateTime(2002, 05, 01), | |
new DateTime(2002, 06, 01), | |
new DateTime(2002, 07, 01), | |
new DateTime(2002, 08, 01), | |
new DateTime(2002, 09, 01) | |
}, | |
new double[] { 32, 32, 28, 12, 15 }); | |
doc.Save(ArtifactsDir + "WorkingWithCharts.InsertAreaChart.docx"); |
The code produces the following result:
Insert Bubble Chart
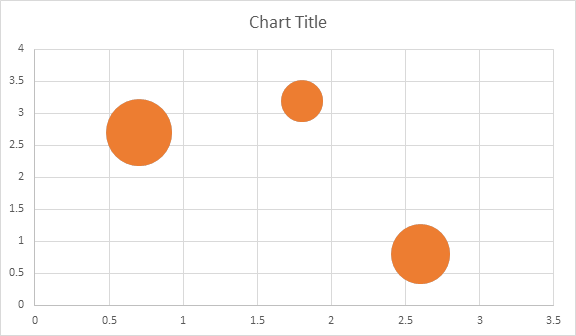
The following code example shows how to insert a bubble chart:
// For complete examples and data files, please go to https://github.com/aspose-words/Aspose.Words-for-.NET.git. | |
Document doc = new Document(); | |
DocumentBuilder builder = new DocumentBuilder(doc); | |
Shape shape = builder.InsertChart(ChartType.Bubble, 432, 252); | |
Chart chart = shape.Chart; | |
chart.Series.Add("Aspose Series 1", new double[] { 0.7, 1.8, 2.6 }, new double[] { 2.7, 3.2, 0.8 }, | |
new double[] { 10, 4, 8 }); | |
doc.Save(ArtifactsDir + "WorkingWithCharts.InsertBubbleChart.docx"); |
The code produces the following result:
Working with Charts through Shape.Chart
Object
Once the chart was inserted and filled with data, you are able to change its appearance. Shape.Chart
property contains all chart related options available through the public API.
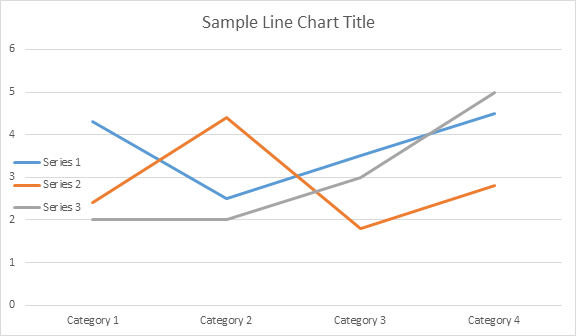
For example, let’s change Chart title or legend behavior:
// For complete examples and data files, please go to https://github.com/aspose-words/Aspose.Words-for-.NET.git. | |
Document doc = new Document(); | |
DocumentBuilder builder = new DocumentBuilder(doc); | |
Shape shape = builder.InsertChart(ChartType.Line, 432, 252); | |
Chart chart = shape.Chart; | |
chart.Title.Show = true; | |
chart.Title.Text = "Line Chart Title"; | |
chart.Title.Overlay = false; | |
// Please note if null or empty value is specified as title text, auto generated title will be shown. | |
chart.Legend.Position = LegendPosition.Left; | |
chart.Legend.Overlay = true; | |
doc.Save(ArtifactsDir + "WorkingWithCharts.CreateChartUsingShape.docx"); |
The code generates the followings results:
How to Work with ChartSeriesCollection of Chart
Let’s look into ChartSeries collection. All chart series are available through chart.Series collection, which is IEnumerable:
// For complete examples and data files, please go to https://github.com/aspose-words/Aspose.Words-for-.NET.git. | |
ChartSeriesCollection seriesColl = chart.Series; | |
Console.WriteLine(seriesColl.Count); |
You can remove series one by one or clear all of them as well as add a new one if needed. The newly inserted chart has some default series added to this collection. To remove them you need to call the chart.Series.Clear() method.
Working with Single ChartSeries Class
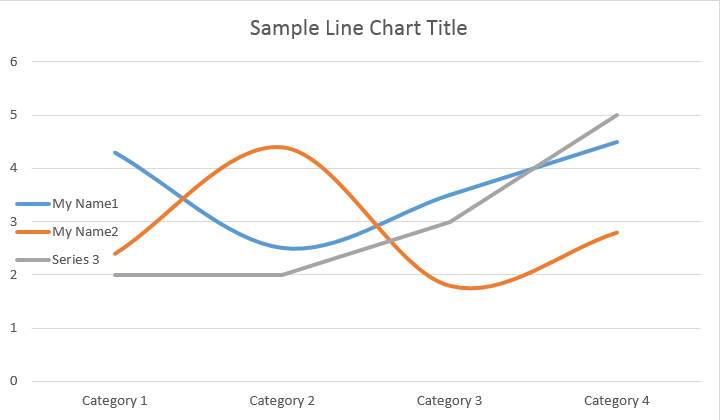
Here is how to work with a particular series:
// For complete examples and data files, please go to https://github.com/aspose-words/Aspose.Words-for-.NET.git. | |
ChartSeries series0 = chart.Series[0]; | |
ChartSeries series1 = chart.Series[1]; | |
series0.Name = "Chart Series Name 1"; | |
series1.Name = "Chart Series Name 2"; | |
// You can also specify whether the line connecting the points on the chart shall be smoothed using Catmull-Rom splines. | |
series0.Smooth = true; | |
series1.Smooth = true; |
Please see the result below:
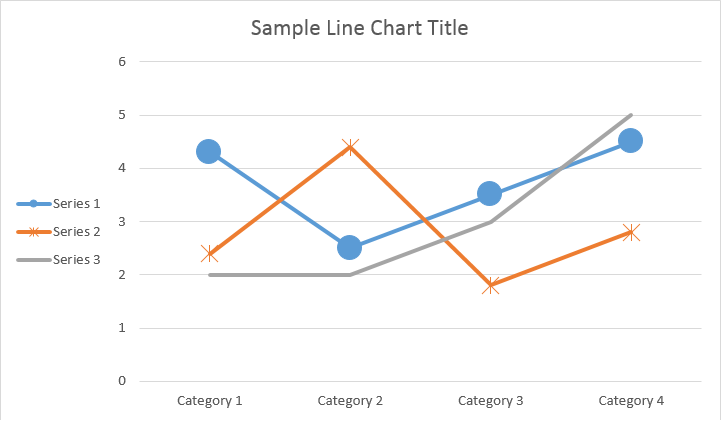
All single ChartSeries have default ChartDataPoint options, please try using the following code to change them:
// For complete examples and data files, please go to https://github.com/aspose-words/Aspose.Words-for-.NET.git. | |
// Specifies whether by default the parent element shall inverts its colors if the value is negative. | |
series0.InvertIfNegative = true; | |
series0.Marker.Symbol = MarkerSymbol.Circle; | |
series0.Marker.Size = 15; | |
series1.Marker.Symbol = MarkerSymbol.Star; | |
series1.Marker.Size = 10; |
Please see the result below:
How to Work with Single ChartDataPoint of a ChartSeries
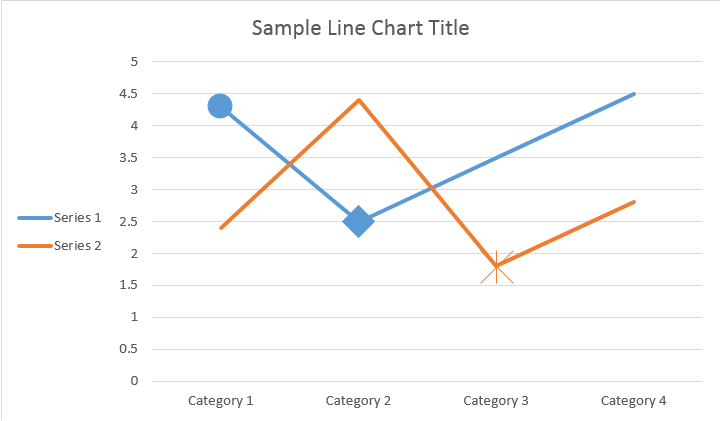
Using ChartDataPoint you are able to customize the formatting of a single data point of the chart series:
// For complete examples and data files, please go to https://github.com/aspose-words/Aspose.Words-for-.NET.git. | |
Document doc = new Document(); | |
DocumentBuilder builder = new DocumentBuilder(doc); | |
Shape shape = builder.InsertChart(ChartType.Line, 432, 252); | |
Chart chart = shape.Chart; | |
ChartSeries series0 = chart.Series[0]; | |
ChartSeries series1 = chart.Series[1]; | |
ChartDataPointCollection dataPointCollection = series0.DataPoints; | |
ChartDataPoint dataPoint00 = dataPointCollection[0]; | |
ChartDataPoint dataPoint01 = dataPointCollection[1]; | |
dataPoint00.Explosion = 50; | |
dataPoint00.Marker.Symbol = MarkerSymbol.Circle; | |
dataPoint00.Marker.Size = 15; | |
dataPoint01.Marker.Symbol = MarkerSymbol.Diamond; | |
dataPoint01.Marker.Size = 20; | |
ChartDataPoint dataPoint12 = series1.DataPoints[2]; | |
dataPoint12.InvertIfNegative = true; | |
dataPoint12.Marker.Symbol = MarkerSymbol.Star; | |
dataPoint12.Marker.Size = 20; | |
doc.Save(ArtifactsDir + "WorkingWithCharts.SingleChartDataPoint.docx"); |
Please see the result below:
How to Work with ChartDataLabel of a Single ChartSeries
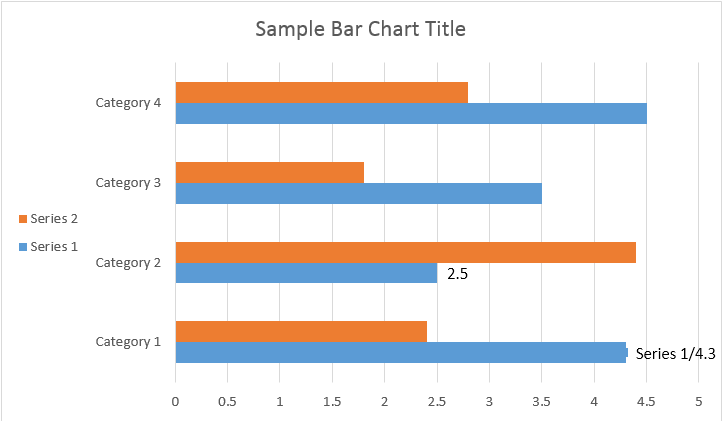
Using ChartDataLabel you are able to specify the formatting of a single data label of the chart series, like show/hide LegendKey, CategoryName, SeriesName, Value etc:
// For complete examples and data files, please go to https://github.com/aspose-words/Aspose.Words-for-.NET.git. | |
Document doc = new Document(); | |
DocumentBuilder builder = new DocumentBuilder(doc); | |
Shape shape = builder.InsertChart(ChartType.Bar, 432, 252); | |
Chart chart = shape.Chart; | |
ChartSeries series0 = shape.Chart.Series[0]; | |
ChartDataLabelCollection labels = series0.DataLabels; | |
labels.ShowLegendKey = true; | |
// By default, when you add data labels to the data points in a pie chart, leader lines are displayed for data labels that are | |
// positioned far outside the end of data points. Leader lines create a visual connection between a data label and its | |
// corresponding data point. | |
labels.ShowLeaderLines = true; | |
labels.ShowCategoryName = false; | |
labels.ShowPercentage = false; | |
labels.ShowSeriesName = true; | |
labels.ShowValue = true; | |
labels.Separator = "/"; | |
labels.ShowValue = true; | |
doc.Save(ArtifactsDir + "WorkingWithCharts.ChartDataLabel.docx"); |
Please see the result below:
How to Define Default Options for ChartDataLabels of ChartSeries
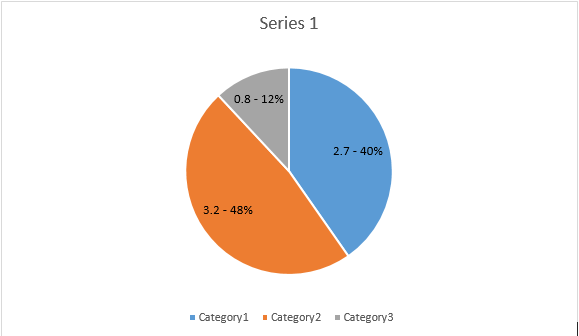
The ChartDataLabelCollection class defines properties which can be used to set default options for ChartDataLabels for Chart Series. These properties include ShowCategoryName, ShowBubbleSize, ShowPercentage, ShowSeriesName, ShowValue etc:
// For complete examples and data files, please go to https://github.com/aspose-words/Aspose.Words-for-.NET.git. | |
Document doc = new Document(); | |
DocumentBuilder builder = new DocumentBuilder(doc); | |
Shape shape = builder.InsertChart(ChartType.Pie, 432, 252); | |
Chart chart = shape.Chart; | |
chart.Series.Clear(); | |
ChartSeries series = chart.Series.Add("Aspose Series 1", | |
new string[] { "Category 1", "Category 2", "Category 3" }, | |
new double[] { 2.7, 3.2, 0.8 }); | |
ChartDataLabelCollection labels = series.DataLabels; | |
labels.ShowPercentage = true; | |
labels.ShowValue = true; | |
labels.ShowLeaderLines = false; | |
labels.Separator = " - "; | |
doc.Save(ArtifactsDir + "WorkingWithCharts.DefaultOptionsForDataLabels.docx"); |
Please see the result below:
How to Format Number of Chart Data Label
Using NumberFormat you are able to specify number formatting of a single data label of the chart.
The following code example shows how to format a number of the data label:
// For complete examples and data files, please go to https://github.com/aspose-words/Aspose.Words-for-.NET.git. | |
Document doc = new Document(); | |
DocumentBuilder builder = new DocumentBuilder(doc); | |
Shape shape = builder.InsertChart(ChartType.Line, 432, 252); | |
Chart chart = shape.Chart; | |
chart.Title.Text = "Data Labels With Different Number Format"; | |
// Delete default generated series. | |
chart.Series.Clear(); | |
ChartSeries series1 = chart.Series.Add("Aspose Series 1", | |
new string[] { "Category 1", "Category 2", "Category 3" }, | |
new double[] { 2.5, 1.5, 3.5 }); | |
series1.HasDataLabels = true; | |
series1.DataLabels.ShowValue = true; | |
series1.DataLabels[0].NumberFormat.FormatCode = "\"$\"#,##0.00"; | |
series1.DataLabels[1].NumberFormat.FormatCode = "dd/mm/yyyy"; | |
series1.DataLabels[2].NumberFormat.FormatCode = "0.00%"; | |
// Or you can set format code to be linked to a source cell, | |
// in this case NumberFormat will be reset to general and inherited from a source cell. | |
series1.DataLabels[2].NumberFormat.IsLinkedToSource = true; | |
doc.Save(ArtifactsDir + "WorkingWithCharts.FormatNumberOfDataLabel.docx"); |
How to Set Chart Axis Properties
If you want to work with chart axis, scaling, and display units for the value axis, please use ChartAxis, AxisDisplayUnit, and AxisScaling classes.
The following code example shows how to define X and Y-axis properties:
// For complete examples and data files, please go to https://github.com/aspose-words/Aspose.Words-for-.NET.git. | |
Document doc = new Document(); | |
DocumentBuilder builder = new DocumentBuilder(doc); | |
// Insert chart | |
Shape shape = builder.InsertChart(ChartType.Area, 432, 252); | |
Chart chart = shape.Chart; | |
chart.Series.Clear(); | |
chart.Series.Add("Aspose Series 1", | |
new DateTime[] | |
{ | |
new DateTime(2002, 01, 01), new DateTime(2002, 06, 01), new DateTime(2002, 07, 01), | |
new DateTime(2002, 08, 01), new DateTime(2002, 09, 01) | |
}, | |
new double[] { 640, 320, 280, 120, 150 }); | |
ChartAxis xAxis = chart.AxisX; | |
ChartAxis yAxis = chart.AxisY; | |
// Change the X axis to be category instead of date, so all the points will be put with equal interval on the X axis. | |
xAxis.CategoryType = AxisCategoryType.Category; | |
xAxis.Crosses = AxisCrosses.Custom; | |
xAxis.CrossesAt = 3; // Measured in display units of the Y axis (hundreds). | |
xAxis.ReverseOrder = true; | |
xAxis.MajorTickMark = AxisTickMark.Cross; | |
xAxis.MinorTickMark = AxisTickMark.Outside; | |
xAxis.TickLabels.Offset = 200; | |
yAxis.TickLabels.Position = AxisTickLabelPosition.High; | |
yAxis.MajorUnit = 100; | |
yAxis.MinorUnit = 50; | |
yAxis.DisplayUnit.Unit = AxisBuiltInUnit.Hundreds; | |
yAxis.Scaling.Minimum = new AxisBound(100); | |
yAxis.Scaling.Maximum = new AxisBound(700); | |
doc.Save(ArtifactsDir + "WorkingWithCharts.DefineAxisProperties.docx"); |
How to Set Date Time Value of Axis
The following code example shows how to set date/time values to axis properties:
// For complete examples and data files, please go to https://github.com/aspose-words/Aspose.Words-for-.NET.git. | |
Document doc = new Document(); | |
DocumentBuilder builder = new DocumentBuilder(doc); | |
Shape shape = builder.InsertChart(ChartType.Column, 432, 252); | |
Chart chart = shape.Chart; | |
chart.Series.Clear(); | |
chart.Series.Add("Aspose Series 1", | |
new[] | |
{ | |
new DateTime(2017, 11, 06), new DateTime(2017, 11, 09), new DateTime(2017, 11, 15), | |
new DateTime(2017, 11, 21), new DateTime(2017, 11, 25), new DateTime(2017, 11, 29) | |
}, | |
new double[] { 1.2, 0.3, 2.1, 2.9, 4.2, 5.3 }); | |
ChartAxis xAxis = chart.AxisX; | |
xAxis.Scaling.Minimum = new AxisBound(new DateTime(2017, 11, 05).ToOADate()); | |
xAxis.Scaling.Maximum = new AxisBound(new DateTime(2017, 12, 03).ToOADate()); | |
// Set major units to a week and minor units to a day. | |
xAxis.MajorUnit = 7; | |
xAxis.MinorUnit = 1; | |
xAxis.MajorTickMark = AxisTickMark.Cross; | |
xAxis.MinorTickMark = AxisTickMark.Outside; | |
doc.Save(ArtifactsDir + "WorkingWithCharts.DateTimeValuesToAxis.docx"); |
How to Format Number Value of Axis
The following code example shows how to change the format of numbers on the value axis:
// For complete examples and data files, please go to https://github.com/aspose-words/Aspose.Words-for-.NET.git. | |
Document doc = new Document(); | |
DocumentBuilder builder = new DocumentBuilder(doc); | |
Shape shape = builder.InsertChart(ChartType.Column, 432, 252); | |
Chart chart = shape.Chart; | |
chart.Series.Clear(); | |
chart.Series.Add("Aspose Series 1", | |
new string[] { "Item 1", "Item 2", "Item 3", "Item 4", "Item 5" }, | |
new double[] { 1900000, 850000, 2100000, 600000, 1500000 }); | |
chart.AxisY.NumberFormat.FormatCode = "#,##0"; | |
doc.Save(ArtifactsDir + "WorkingWithCharts.NumberFormatForAxis.docx"); |
How to Set Bounds of Axis
The AxisBound
class represents a minimum or maximum bound of axis values. Bound can be specified as a numeric, date-time or a special “auto” value.
The following code example shows how to set bounds of an axis:
// For complete examples and data files, please go to https://github.com/aspose-words/Aspose.Words-for-.NET.git. | |
Document doc = new Document(); | |
DocumentBuilder builder = new DocumentBuilder(doc); | |
Shape shape = builder.InsertChart(ChartType.Column, 432, 252); | |
Chart chart = shape.Chart; | |
chart.Series.Clear(); | |
chart.Series.Add("Aspose Series 1", | |
new string[] { "Item 1", "Item 2", "Item 3", "Item 4", "Item 5" }, | |
new double[] { 1.2, 0.3, 2.1, 2.9, 4.2 }); | |
chart.AxisY.Scaling.Minimum = new AxisBound(0); | |
chart.AxisY.Scaling.Maximum = new AxisBound(6); | |
doc.Save(ArtifactsDir + "WorkingWithCharts.BoundsOfAxis.docx"); |
How to Set Interval Unit Between Labels
The following code example shows how to set the interval unit between labels on an axis:
// For complete examples and data files, please go to https://github.com/aspose-words/Aspose.Words-for-.NET.git. | |
Document doc = new Document(); | |
DocumentBuilder builder = new DocumentBuilder(doc); | |
Shape shape = builder.InsertChart(ChartType.Column, 432, 252); | |
Chart chart = shape.Chart; | |
chart.Series.Clear(); | |
chart.Series.Add("Aspose Series 1", | |
new string[] { "Item 1", "Item 2", "Item 3", "Item 4", "Item 5" }, | |
new double[] { 1.2, 0.3, 2.1, 2.9, 4.2 }); | |
chart.AxisX.TickLabels.Spacing = 2; | |
doc.Save(ArtifactsDir + "WorkingWithCharts.IntervalUnitBetweenLabelsOnAxis.docx"); |
How to Hide Chart Axis
If you want to show or hide the chart axis, you can simply achieve this by setting the value of ChartAxis.Hidden
property.
The following code example shows how to hide the Y-axis of the chart:
// For complete examples and data files, please go to https://github.com/aspose-words/Aspose.Words-for-.NET.git. | |
Document doc = new Document(); | |
DocumentBuilder builder = new DocumentBuilder(doc); | |
Shape shape = builder.InsertChart(ChartType.Column, 432, 252); | |
Chart chart = shape.Chart; | |
chart.Series.Clear(); | |
chart.Series.Add("Aspose Series 1", | |
new string[] { "Item 1", "Item 2", "Item 3", "Item 4", "Item 5" }, | |
new double[] { 1.2, 0.3, 2.1, 2.9, 4.2 }); | |
chart.AxisY.Hidden = true; | |
doc.Save(ArtifactsDir + "WorkingWithCharts.HideChartAxis.docx"); |
How to Align Chart Label
If you want to set a text alignment for multi-line labels, you can simply achieve this by setting the value of the TickLabels.Alignment property.
The following code example shows how to tick label alignment:
// For complete examples and data files, please go to https://github.com/aspose-words/Aspose.Words-for-.NET.git. | |
Document doc = new Document(); | |
DocumentBuilder builder = new DocumentBuilder(doc); | |
Shape shape = builder.InsertChart(ChartType.Scatter, 450, 250); | |
ChartAxis axis = shape.Chart.AxisX; | |
// This property has effect only for multi-line labels. | |
axis.TickLabels.Alignment = ParagraphAlignment.Right; | |
doc.Save(ArtifactsDir + "WorkingWithCharts.TickMultiLineLabelAlignment.docx"); |
How to Set Fill and Stroke Formatting
Fill and stroke formatting can be set for chart series, data points, and markers. To do this, you need to use the properties of the ChartFormat type in the ChartSeries, ChartDataPoint, and ChartMarker classes, as well as aliases for some properties, such as ForeColor, BackColor, Visible, and Transparency in the Stroke
class.
The following code example shows how to set series color:
// For complete examples and data files, please go to https://github.com/aspose-words/Aspose.Words-for-.NET.git. | |
Document doc = new Document(); | |
DocumentBuilder builder = new DocumentBuilder(doc); | |
Shape shape = builder.InsertChart(ChartType.Column, 432, 252); | |
Chart chart = shape.Chart; | |
ChartSeriesCollection seriesColl = chart.Series; | |
// Delete default generated series. | |
seriesColl.Clear(); | |
// Create category names array. | |
string[] categories = new string[] { "AW Category 1", "AW Category 2" }; | |
// Adding new series. Value and category arrays must be the same size. | |
ChartSeries series1 = seriesColl.Add("AW Series 1", categories, new double[] { 1, 2 }); | |
ChartSeries series2 = seriesColl.Add("AW Series 2", categories, new double[] { 3, 4 }); | |
ChartSeries series3 = seriesColl.Add("AW Series 3", categories, new double[] { 5, 6 }); | |
// Set series color. | |
series1.Format.Fill.ForeColor = Color.Red; | |
series2.Format.Fill.ForeColor = Color.Yellow; | |
series3.Format.Fill.ForeColor = Color.Blue; | |
doc.Save(ArtifactsDir + "WorkingWithCharts.FillFormatting.docx"); |
The following code example shows how to set line color and weight:
// For complete examples and data files, please go to https://github.com/aspose-words/Aspose.Words-for-.NET.git. | |
Document doc = new Document(); | |
DocumentBuilder builder = new DocumentBuilder(doc); | |
Shape shape = builder.InsertChart(ChartType.Line, 432, 252); | |
Chart chart = shape.Chart; | |
ChartSeriesCollection seriesColl = chart.Series; | |
// Delete default generated series. | |
seriesColl.Clear(); | |
// Adding new series. | |
ChartSeries series1 = seriesColl.Add("AW Series 1", new double[] { 0.7, 1.8, 2.6 }, | |
new double[] { 2.7, 3.2, 0.8 }); | |
ChartSeries series2 = seriesColl.Add("AW Series 2", new double[] { 0.5, 1.5, 2.5 }, | |
new double[] { 3, 1, 2 }); | |
// Set series color. | |
series1.Format.Stroke.ForeColor = Color.Red; | |
series1.Format.Stroke.Weight = 5; | |
series2.Format.Stroke.ForeColor = Color.LightGreen; | |
series2.Format.Stroke.Weight = 5; | |
doc.Save(ArtifactsDir + "WorkingWithCharts.StrokeFormatting.docx"); |