Apply Chart Worksheet Formulas in Presentations Using Java
Overview
A chart worksheet is the data source behind a chart in a presentation. It stores category and series names together with the numeric values displayed by the chart. In Aspose.Slides, this worksheet is available through the chart data workbook, which allows you to work with chart data programmatically.
This article explains how to use worksheet formulas in chart data so that cell values can be calculated and updated automatically instead of being entered manually. It shows how to assign formulas, use both A1-style and R1C1-style references, recalculate workbook formulas, and work with the supported constants, operators, cell references, and predefined functions available for chart worksheets in presentations.
About Chart Spreadsheet Formulas in Presentations
Chart spreadsheet (or chart worksheet) in presentation is the data source of the chart. Chart spreadsheet contains data, which are represented on the chart in a graphic way. When you create a chart in PowerPoint, the worksheet associated with this chart is automatically created too. Chart worksheet is created for all types of charts: line chart, bar chart, sunburst chart, pie chart, etc. To see chart spreadsheet in PowerPoint you should double-click on the chart:
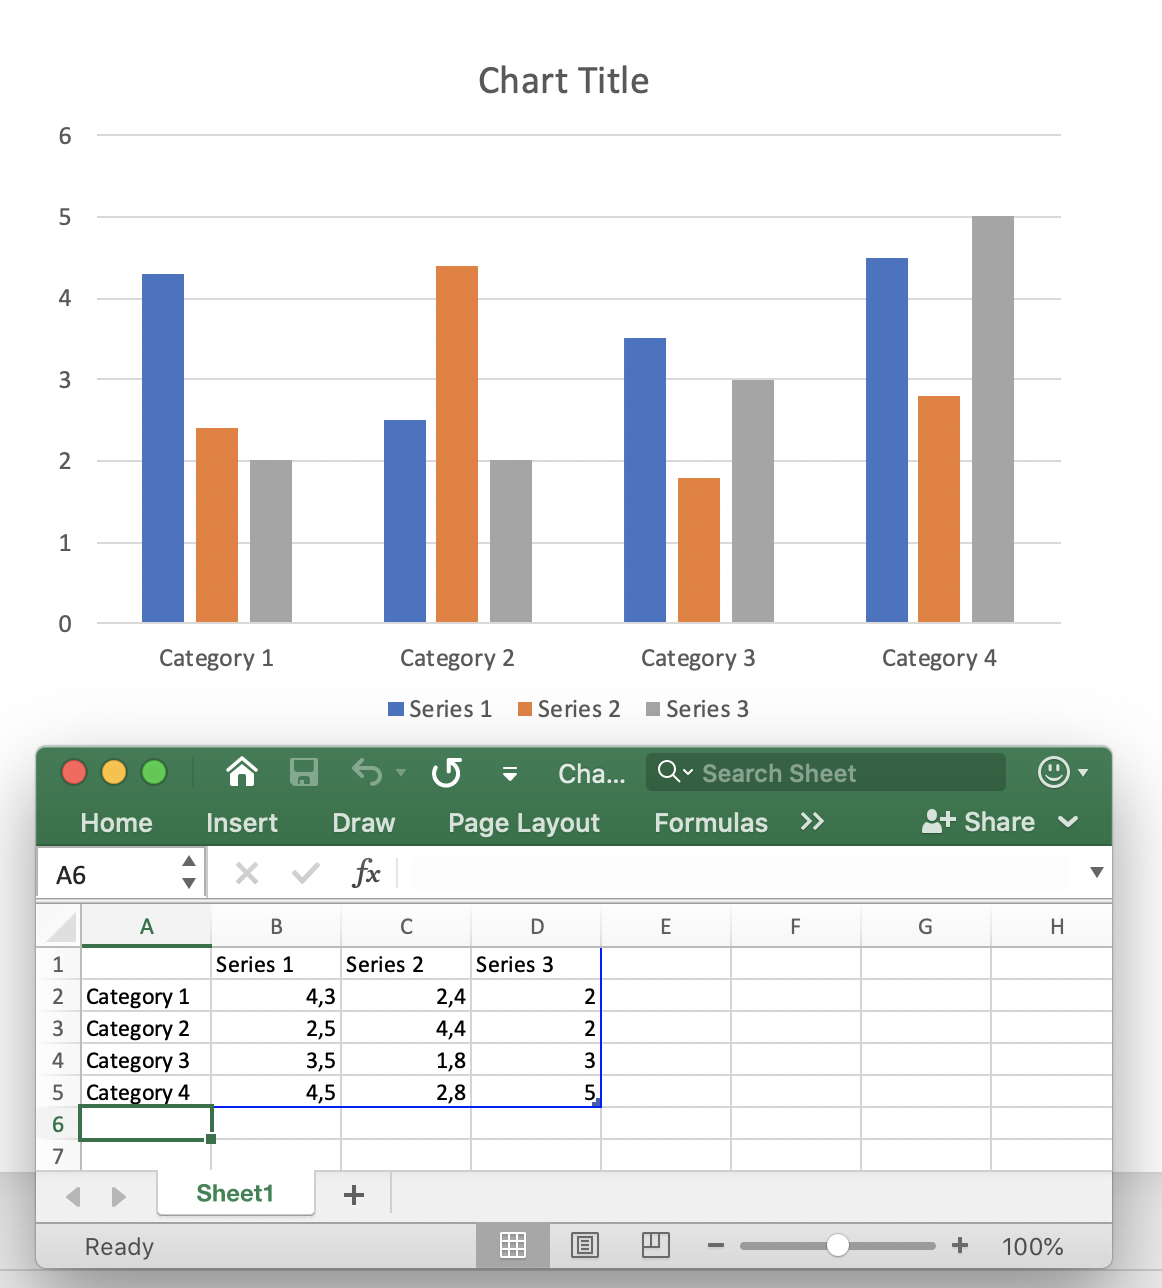
Chart spreadsheet contains the names of chart elements (Category Name: Category1, Serie Name) and a table with numeric data appropriate to these categories and series. By default, when you create a new chart - the chart spreadsheet data are set with the default data. Then you may change spreadsheet data in the worksheet manually.
Usually, the chart represents complicated data (e.g. financial analysts, scientific analysts), having cells that are calculated from the values in other cells or from other dynamic data. Calculating cell’s value manually and hard-coding it into the cell, makes it difficult to change it in the future. If you will change the value of a certain cell, all the cells dependent on it will require to be updated too. Moreover, table data may depend on the data from other tables, creating a complex presentation data scheme with a need to be updated in an easy and flexible way.
Chart spreadsheet formula in presentation is an expression to automatically calculate and update chart spreadsheet data. Spreadsheet formula defines the data calculation logic for a certain cell or a set of cells. Spreadsheet formula is a math formula or a logical formula, which is using: cell references, math functions, logical operators, arithmetic operators, conversion functions, string constants, etc. The definition of the formula is written into a cell, and this cell does not contain a simple value. Spreadsheet formula calculates the value and returns it back, then this value is assigned to the cell. Chart spreadsheet formulas in presentations are actually the same as excel formulas, and there are supported the same default functions, operators and constants for their implementation.
In Aspose.Slides chart spreadsheet is represented with Chart.getChartData.getChartDataWorkbook method of the IChartDataWorkbook type. Spreadsheet formula can be assigned and changed with IChartDataCell.setFormula method. The following functionality is supported for formulas in Aspose.Slides:
- Logical constants
- Numerical constants
- String constants
- Error constants
- Arithmetic operators
- Comparison operators
- A1-style cell references
- R1C1-style cell references
- Predefined functions
Typically, spreadsheets store the last calculated formula values. If after presentation loading, the chart data were not changed - IChartDataCell.getValue method it returns those values while reading. But, if spreadsheet data had been changed, while reading ChartDataCell.Value property it throws the CellUnsupportedDataException for the unsupported formulas. This is because when formulas are successfully parsed, the cell dependencies are determined and the correctness of the last values is determined. But, if the formula can not be parsed, the correctness of cell value cannot be guaranteed.
Add a Chart Spreadsheet Formula to a Presentation
First, add a chart to the first slide of a new presentation with IShapeCollection.getShapes.addChart. The worksheet of the chart is automatically created and can be accessed with Chart.getChartData.getChartDataWorkbook method:
Presentation pres = new Presentation();
try {
    IChart chart = pres.getSlides().get_Item(0).getShapes().addChart(ChartType.ClusteredColumn, 150, 150, 500, 300);

    IChartDataWorkbook workbook = chart.getChartData().getChartDataWorkbook();

    // ...
} finally {
    if (pres != null) pres.dispose();
}
Let’s write some values in cells with IChartDataCell.setValue property of the Object type, which means you can set any value to the property:
workbook.getCell(0, "F2").setValue(-2.5);

workbook.getCell(0, "G3").setValue(6.3);

workbook.getCell(0, "H4").setValue(3);
Now to write formula to the cell, you can use the IChartDataCell.setFormula method:
Note: IChartDataCell.setFormula method is used to set A1-style cell references.
To set the R1C1Formula cell reference, you can use the IChartDataCell.setR1C1Formula method:
Then if you try to read the values from the cells B2 and C2, they will be calculated:
Object value1 = cell1.getValue(); // 7.8

Object value2 = cell2.getValue(); // 2.1
Logical Constants
You can use logical constants such as FALSE and TRUE in cell formulas:
workbook.getCell(0, "A2").setValue(false);
IChartDataCell cell = workbook.getCell(0, "B2");
cell.setFormula("A2 = TRUE");
Object value = cell.getValue(); // the value contains boolean "false"
Numerical Constants
Numbers can be used in common or scientific notations to create chart spreadsheet formula:
workbook.getCell(0, "A2").setFormula("1 + 0.5");
workbook.getCell(0, "B2").setFormula(".3 * 1E-2");
String Constants
String (or literal) constant is a specific value that is used as it is and does not change. String constants may be: dates, texts, numbers, etc.:
workbook.getCell(0, "A2").setFormula("\"abc\"");
workbook.getCell(0, "B2").setFormula("\"2/3/2020 12:00\"");
Error Constants
Sometimes its not possible to calculate the result by the formula. In that case, the error code is shown in the cell instead of its value. Each type of error has a specific code:
- #DIV/0! - formula tries to divide by zero.
- #GETTING_DATA - may be shown on a cell, while its value is still calculating.
- #N/A - information is missing or not available. Some reasons can be: the cells used in the formula is empty, an extra space character, misspelling, etc.
- #NAME? - a certain cell or other formula objects can not be found by its name.
- #NULL! - may appear when there is a mistake in the formula, like: (,) or a space character used instead of a colon (:).
- #NUM! - the numeric in the formula may be invalid, too long or too small, etc.
- #REF! - invalid cell reference.
- #VALUE! - unexpected value type. For example, string value set to numeric cell.
IChartDataCell cell = workbook.getCell(0, "A2");
cell.setFormula("2 / 0");
Object value = cell.getValue(); // the value contains the string "#DIV/0!"
Arithmetic Operators
You can use all the arithmetic operators in chart worksheet formulas:
| Operator | Meaning | Example |
|---|---|---|
| + (plus sign) | Addition or unary plus | 2 + 3 |
| - (minus sign) | Subtraction or negation | 2 - 3 -3 |
| * (asterisk) | Multiplication | 2 * 3 |
| / (forward slash) | Division | 2 / 3 |
| % (percent sign) | Percent | 30% |
| ^ (caret) | Exponentiation | 2 ^ 3 |
Note: To change the order of evaluation, enclose in parentheses the part of the formula to be calculated first.
Comparison Operators
You can compare the values of cells with the comparison operators. When two values are compared by using these operators, the result is a logical value either TRUE or FALSE:
| Operator | Meaning | Meaning |
|---|---|---|
| = (equal sign) | Equal to | A2 = 3 |
| <> (not equal sign) | Not equal to | A2 <> 3 |
| > (greater than sign) | Greater than | A2 > 3 |
| >= (greater than or equal to sign) | Greater than or equal to | A2 >= 3 |
| < (less than sign) | Less than | A2 < 3 |
| <= (less than or equal to sign) | Less than or equal to | A2 <= 3 |
A1-style Cell References
A1-style cell references are used for the worksheets, where the column has a letter identifier (e.g. “A") and the row has a numeric identifier (e.g. “1"). A1-style cell references can be used in the following way:
| Cell reference | Example | ||
|---|---|---|---|
| Absolute | Relative | Mixed | |
| Cell | $A$2 | A2 | A$2 $A2 |
| Row | $2:$2 | 2:2 | - |
| Column | $A:$A | A:A | - |
| Range | $A$2:$C$4 | A2:C4 | $A$2:C4 A$2:$C4 |
Here is an example how to use A1-style cell reference in formula:
workbook.getCell(0, "A2").setFormula("C3 + SUM(F2:H5)");
R1C1-style Cell References
R1C1-style cell references are used for the worksheets, where both a row and a column has the numeric identifier. R1C1-style cell references can be used in the following way:
| Cell reference | Example | ||
|---|---|---|---|
| Absolute | Relative | Mixed | |
| Cell | R2C3 | R[2]C[3] | R2C[3] R[2]C3 |
| Row | R2 | R[2] | - |
| Column | C3 | C[3] | - |
| Range | R2C3:R5C7 | R[2]C[3]:R[5]C[7] | R2C3:R[5]C[7] R[2]C3:R5C[7] |
Here is an example how to use A1-style cell reference in formula:
workbook.getCell(0, "A2").setR1C1Formula("R2C4 + SUM(R5C6:R7C9)");
Predefined Functions
There are predefined functions, that can be used in the formulas to simplify their implementation. These functions encapsulate the most commonly used operations, like:
- ABS
- AVERAGE
- CEILING
- CHOOSE
- CONCAT
- CONCATENATE
- DATE (1900 date system)
- DAYS
- FIND
- FINDB
- IF
- INDEX (reference form)
- LOOKUP (vector form)
- MATCH (vector form)
- MAX
- SUM
- VLOOKUP
FAQ
Are external Excel files supported as a data source for a chart with formulas?
Yes. Aspose.Slides supports external workbooks as a chart’s data source, which lets you use formulas from an XLSX outside the presentation.
Can chart formulas reference sheets within the same workbook by sheet name?
Yes. Formulas follow the standard Excel reference model, so you can reference other sheets within the same workbook or an external workbook. For external references, include the path and workbook name using Excel syntax.